
Remember me

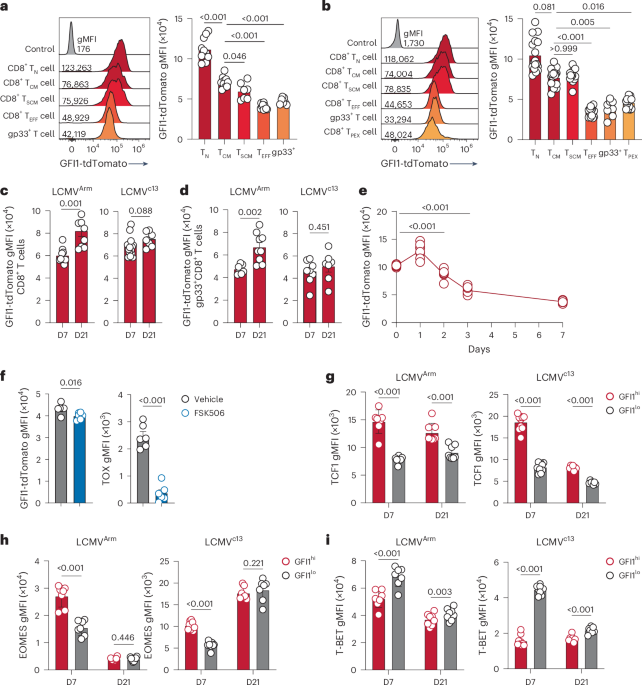

To understand how GFI1 is regulated in CD8+ T cells, Gfi1tdTomato/+ reporter mice, which express tdTomato under the Gfi1 promotor in all cells20,21,22, were infected with LCMV that induces either acute infection (Armstrong strain, LCMVArm) or chronic infection (clone 13 strain, LCMVc13). In naive Gfi1tdTomato/+ mice, GFI1-tdTomato was uniformly highly expressed in CD8+ T cells (Extended Data Fig. 1a). Following infection, CD8+ T cells showed a significant downregulation of GFI1-tdTomato expression (Extended Data Fig. 1b,c). Further analyses revealed a graded expression of GFI1-tdTomato whereby CD8+ TCM and CD8+ TSCM cells exhibited high expression of GFI1-tdTomato (Fig. 1a,b and Extended Data Fig. 1d). TCF1−CX3CR1+ TEFF cells showed the lowest GFI1-tdTomato expression (Fig. 1a,b and Extended Data Fig. 1e), whereas high expression was maintained in CD8+ TSCM cells (Extended Data Fig. 1e). TCF1+TOX+ CD8+ TPEX cells that maintain stem-like proliferation following LCMVc13 infection4 showed significantly lower expression of GFI1-tdTomato than CD8+ TCM and CD8+ TSCM cells (Fig. 1b). Further resolving the CD8+ TPEX cell population revealed that CD62L+CD8+ TPEX cells, which were reported to exhibit superior proliferative capacity23, had higher GFI1-tdTomato expression than CD62L−CD8+ TPEX cells (Extended Data Fig. 1f). Following the initial downregulation of GFI1-tdTomato expression after LCMV infection, GFI1-tdTomato subsequently increased between day 7 and day 21 for LCMVArm infection but remained low following LCMVc13 infection (Fig. 1c). This pattern persisted in LCMV-specific gp33+CD8+ T cells during late LCMVc13 infection (Fig. 1d and Extended Data Fig. 1g,h). Tracking the temporal dynamics of GFI1 expression early in infection using Gfi1tdTomato/+ P14 CD8+ T cells showed that GFI1-tdTomato expression was significantly downregulated on day 2 and day 3 in P14 T cells isolated from spleen and mesenteric lymph nodes (mLN), respectively (Fig. 1e and Extended Data Fig. 1i,j). FK506, a potent inhibitor of calcineurin that blocks TCR-dependent signaling, showed that although TOX expression was impaired, GFI1-tdTomato was not affected (Fig. 1f). Thus, calcineurin signaling was not essential to GFI1 regulation, and infection-induced inflammation was sufficient for GFI1 downregulation. Together, these data show that GFI1 is rapidly downregulated in activated CD8+ T cells after infection and is selectively maintained in TM cell subsets.
Fig. 1: GFI1 is differentially expressed in CD8+ T cell effector subsets during chronic infection.
a, Representative histogram (left) and quantification (right) of GFI1-tdTomato expression in splenic CD11a–CD44–CD8+ TN cells from C57BL/6 mice (control) and CD8+ TN, CD11a+CD44+CD62L+CD27+CD8+ TCM cells, CD11a+CD44+TCF1+CX3CR1–CD8+ TSCM cells, TCF1-CX3CR1+CD8+ TEFF cells and gp33+CD8+ T cells from the spleen of Gfi1tdTomato/+ mice at day 7 (D7) post infection with LCMVArm. Data are pooled from two experiments (n = 7 mice). gMFI, geometric mean fluorescence intensity. b, Representative histogram (left) and quantification (right) of GFI1-tdTomato expression in splenic CD8+ TN cells from C57BL/6 mice (control) and CD8+ TN, CD8+ TCM, CD8+ TSCM, CD8+ TEFF, CD8+gp33+ and TCF1+TOX+CD8+ TPEX cells from the spleen of LCMVc13-infected Gfi1tdTomato/+ mice at D7. Pooled from four experiments (n = 13 mice). c,d, GFI1-tdTomato in total CD8+ T cells (c) and gp33+CD8+ T cells (d) from the spleen of LCMVArm and LCMVc13-infected Gfi1tdTomato/+ mice at D7 and D21. Pooled from two experiments (n = 8 or 17 mice per time point). e,f, Expression of GFI1-tdTomato in splenic CD8+ P14 T cells at D0–D7 post LCMVc13 infection (n = 8 mice per time point) (e) and GFI1-tdTomato and TOX in splenic CD8+ P14 T cells at D7 post LCMVc13 infection (f) in C57BL/6 mice transferred with congenically labeled Gfi1tdTomato/+ CD8+ P14 TN cells, infected with LCMVc13 1 day later (e,f) and treated with FK506 or vehicle daily from D4–D6 post infection (f). Pooled from two experiments (n = 6 mice). g–i, TCF1 (g), EOMES (h) and T-BET (i) expression in activated CD11a+CD44+GFI1hi and CD11a+CD44+GFI1lo CD8+ T cells from LCMVArm-infected and LCMVc13-infected Gfi1tdTomato/+ mice at D7 and D21 post infection. Data pooled from two experiments (n = 7 or 8 mice). Individual values and means are shown; error bars, s.e.m. Error bars not shown in e. Statistical significance using a one-way ANOVA and Dunnett’s post hoc test for a, b and e; two-tailed Student’s t-test for c, d and f; Wilcoxon signed-rank two-tailed paired t-test for g–i.
Given the emergence of distinct high and low GFI1-tdTomato-expressing populations among activated CD11a+CD44+ CD8+ T cells, the GFI1hi and GFI1lo CD8+ T cells (Extended Data Fig. 1b) were further analyzed to determine the expression of other transcription factors. GFI1hiCD8+ T cells showed increased expression of TCF1 and EOMES compared to GFI1loCD8+ T cells at day 7 post LCMVArm or LCMVc13 infection (Fig. 1g,h). TCF1 remained high in GFI1hiCD8+ T cells at day 21, while EOMES expression was similar in GFI1hi and GFI1lo CD8+ T cells at day 21 (Fig. 1h). T-BET expression was low in GFI1hiCD8+ T cells at day 7 and day 21 after LCMVArm and LCMVc13 infection (Fig. 1i). Therefore, GFI1 was differentially regulated among TM and TEFF cells and was associated with memory CD8+ T cell formation.
GFI1 identifies transcriptionally distinct CD8+ T cellsRNA sequencing (RNA-seq) of GFI1hi and GFI1lo CD8+ T cells isolated from LCMVArm-infected or LCMVc13-infected mice (Extended Data Fig. 2a) showed that GFI1hiCD8+ T cells responding to both infections exhibited a similar transcriptional profile, which was distinct from that of GFI1loCD8+ T cells (Extended Data Fig. 2b). We identified 929 and 220 unique differentially expressed genes (DEGs) in GFI1hiCD8+ T cells isolated from LCMVArm-infected and LCMVc13-infected mice, respectively (Fig. 2a and Supplementary Tables 1 and 2). GFI1hiCD8+ T cells showed upregulation of transcription factors associated with T cell memory4,24, including Eomes, Id3 and Tcf7, whereas transcription factors linked with TEFF cell programs such as Id2, Tbx21 and Zeb2 were downregulated24,25 (Fig. 2b,c). GFI1hiCD8+ T cells showed higher Gfi1 expression than GFI1lo CD8+ T cells (Fig. 2c and Extended Data Fig. 2c), suggesting that the reporter levels reflect GFI1 gene expression. GFI1hiCD8+ T cells showed upregulation of genes associated with cell proliferation and cell cycle, including Cdk1, Top2a and Myc (Fig. 2c and Extended Data Fig. 2d) and significant enrichment of memory signature genes, such as Tcf7, Eomes and Il7r (Fig. 2d and Extended Data Fig. 2e), suggesting that GFI1hiCD8+ T cells had enhanced proliferative potential. This premise was further supported by upregulation of E2f target genes and the G2M checkpoint pathway in GFI1hiCD8+ T cells (Extended Data Fig. 2f). To understand whether the memory signature26 observed in the transcriptome of GFI1hiCD8+ T cells was solely caused by enrichment of CD8+ TCM and CD8+ TSCM cell subsets or whether GFI1-tdTomato expression regulated memory gene expression within CD8+ TCM and CD8+ TSCM cell populations, the transcriptional profile of GFI1hi and GFI1lo subsets from CD44+CD62L+ and CD44+Ly108+ (Ly108 was used as a surrogate marker for TCF1+ memory cells27) CD8+ T cell populations were analyzed. We found that GFI1hiCD8+ T cell fractions within CD8+ TCM and CD8+ TSCM cells expressed higher levels of Id3, Ikzf2 and Tcf7, whereas Gzmb, Havcr2 and Zeb2 showed lower expression (Fig. 2e, Extended Data Fig. 3a,b and Supplementary Tables 3 and 4). These data strongly suggest that high expression of GFI1 identifies key features of memory programmed CD8+ T cells, indicating a superior capacity to respond to infection.
Fig. 2: GFI1-expressing CD8+ T cells exhibit a TM cell molecular program.
a, Shared and unique DEGs (P < 0.05) in activated CD11a+CD44+GFI1hi CD8+ T cells isolated from the spleen of Gfi1tdTomato/+ mice at D7 post infection with LCMVc13 or LCMVArm and analyzed by RNA-seq. b, Volcano plot of DEGs in GFI1hi CD8+ T cells from LCMVc13-infected mice as in a. Blue and red indicate genes upregulated in activated GFI1lo and GFI1hi CD8+ T cells, respectively. Gray dots indicate P > 0.05. c, DEseq2-normalized expression of selected genes in GFI1hi and GFI1lo CD8+ T cells isolated from LCMVc13-infected mice as in a. d, Gene set enrichment analysis of GFI1hi and GFI1lo CD8+ T cells isolated from LCMVc13-infected mice as in a, using a memory CD8+ T cells gene signature26. NES, normalized enrichment score. e, Shared and unique DEGs (P < 0.05) in CD44+CD62L+GFI1hi and CD44+Ly108+GFI1hi CD8+ TM cells isolated from the spleen of Gfi1tdTomato/+ mice at D7 post infection with LCMVc13 and analyzed by RNA-seq. f,g, Representative flow cytometry plots (f) and quantification (g) of spleen donor CD45.2+CD8+ T cells at D7 post LCMVArm infection in congenic C57BL/6 mice transferred intravenously (i.v.) with splenic CD8+ T cells isolated at D21 post LCMVArm infection from CD45.2+Gfi1tdTomato/+ mice and infected with LCMVArm 24 h later. Data pooled from two experiments (n = 7 mice per group). h, Total donor CD45.2+CD8+ T cells at D14 post LCMVc13 infection in the spleen of congenic C57BL/6 recipients infected with LCMVc13 7 days before transfer of infection-matched (D7) CD8+ T cells isolated from LCMVc13-infected CD45.2+Gfi1tdTomato/+ mice. Data pooled from two experiments (n = 5 or 7 mice per group). P values were calculated using a Wald’s test (b, d and e) or a two-tailed Student’s t-test (g and h). Data in g and h show means; error bars, s.e.m.
To determine whether GFI1hi and GFI1lo CD8+ T cells differed in their capacity to respond to a secondary infection, GFI1hi and GFI1lo CD8+ T cells were isolated from the spleen of LCMVArm-infected wild-type (WT) mice on day 21 after infection and adoptively transferred into secondary recipients that were challenged with LCMVArm the next day (Extended Data Fig. 3c). In this acute challenge model, GFI1hi CD8+ T cells expanded approximately fourfold more than GFI1lo CD8+ T cells by day 7 post LCMVArm infection (Fig. 2f,g and Extended Data Fig. 3d), demonstrating the enhanced proliferative potential of GFI1hi CD8+ T cells in response to a secondary infection. Next, we adoptively transferred CD44+CD62L+GFI1hi, CD44+Ly108+GFI1hi or CD44+GFI1lo CD8+ T cells isolated from spleen and mLN of LCMVArm-infected mice at day 21 after infection into congenically marked secondary recipient mice that were subsequently infected with LCMVArm the next day. This procedure showed that both CD44+CD62L+GFI1hi and CD44+Ly108+GFI1hi CD8+ T cell populations exhibited superior expansion compared with that of CD44+GFI1loCD8+ T cells (Extended Data Fig. 3e). In line with these observations, adoptive transfer of GFI1hi and GFI1lo CD8+ T cells isolated from spleen of Gfi1tdTomato/+ mice infected with LCMVc13 at day 7 after infection into infection-matched recipients (Extended Data Fig. 3f) showed that GFI1hiCD8+ T cells had more enhanced capacity to proliferate than GFI1lo CD8+ T cells (Fig. 2h). Collectively, these data showed that GFI1hi CD8+ T cells identified a TM cell population with superior expansion and recall response capacity.
GFI1 epigenetically regulates CD8+ T cell function and persistenceTo study the role of GFI1, Gfi1fl/fl mice were crossed with CD8acre/+ (E8I-Cre)28 to create GFI1ΔCD8 mice, in which GFI1 was deleted in mature peripheral CD8+ T cells. Unlike T cells in the Gfi1–/– strain18, the numbers of CD4+ and CD8+ T cells in the thymus (Extended Data Fig. 4a,b) and spleen (Extended Data Fig. 4c,d) of naive GFI1ΔCD8 mice were similar to WT mice. Moreover, selective ablation of GFI1 did not alter TCF1, EOMES, T-BET or TOX expression in naive CD8+ T cells (Extended Data Fig. 4e). When equal numbers of WT (CD45.1+) and GFI1ΔCD8 (CD45.1+CD45.2+) P14 CD8+ T cells were co-transferred into congenic recipients, both WT and GFI1ΔCD8 P14 CD8+ T cells expanded equivalently by day 5 after LCMVc13 infection (Extended Data Fig. 5a). However, the frequency and number of GFI1ΔCD8 CD8+ T cells declined from day 7 and were largely lost by day 21 after LCMVc13 infection in spleen, blood, mLN and lungs (Fig. 3a,b and Extended Data Fig. 5a). This decline mirrored a reduction in P14 CD8+ TSCM cells (Fig. 3c,d and Extended Data Fig. 5b) and P14 CD8+ TCM cells (Fig. 3e). CD8+ TEFF cells were also decreased at day 7 (Fig. 3c and Extended Data Fig. 5c). GFI1ΔCD8 P14 CD8+ T cells showed lower expression of Ki-67, TCF1, EOMES, TOX and CX3CR1 (Fig. 3f,g and Extended Data Fig. 5d) and increased expression of FOXO1, CD127 and TIM3 (Extended Data Fig. 5d) compared to WT P14 CD8+ T cells. These results demonstrate that GFI1 is needed for antigen-specific memory CD8+ T cell persistence in chronic infection.
Fig. 3: GFI1 drives epigenetic and transcriptional changes to promote antiviral CD8+ T cell persistence.
a,b, Representative flow cytometry plots (a) and total number (b) of WT and GFI1ΔCD8 live CD8+ P14 T cells at D5–D60 post infection in the spleen of C57BL/6 mice that received a 1:1 mix of congenically labeled WT and GFI1ΔCD8 TN cells followed by LCMVc13 infection 24 h later. Data are pooled from two (n = 10 mice for D7 and D21) or one experiment (n = 5 for D5, D14, D28 and D60). c, Representative plots showing frequency of CD8+ TSCM cells at D7 in the spleen of LCMVc13-infected mice as in a. d,e, Total number of CD8+ P14 TSCM (d) and CD8+ P14 TCM (e) cells in the spleen of LCMVc13-infected mice as in a. Data are pooled from two experiments (n = 10 mice per time point). f, Representative histograms at D7 (right) and quantification (left) of Ki-67 expression in WT and GFI1ΔCD8 CD8+P14 T cells as in a. D7 data are representative of two experiments (n = 5 mice); D14 data are representative of one experiment. g, TCF1, EOMES and TOX expression in CD8+ P14 T cells at D7 in the spleen of LCMVc13-infected mice. Data are representative of two experiments (n = 6 mice). h, Expression of selected genes in WT and GFI1ΔCD8 CD8+ P14 T cells from the spleen of C57BL/6 mice transferred i.v. with congenically marked WT or GFI1ΔCD8 CD8+ P14 TN cells, infected with LCMVc13 24 h post transfer and analyzed by RNA-seq at D7 and D21 post LCMVc13 infection. i, PCA plot of WT or GFI1ΔCD8 CD8+P14 T cells at D7 and D21 post LCMVc13 infection based on RNA-seq as in h. j, Shared and unique DEGs at D7 and D21in GFI1ΔCD8 CD8+ T cells as in h. k, ATAC-seq PCA plot of splenic WT and GFI1ΔCD8 CD8+ T cells at D0, D3, D5 and D7 post LCMVc13 infection in C57BL/6 mice transferred i.v. with congenically labeled WT or GFI1ΔCD8 CD8+ P14 T cells 24 h before infection. l, Total number of DARs detected in GFI1ΔCD8 CD8+ P14 T cells versus WT CD8+ P14 T cells at D0, D3, D5 and D7 post LCMVc13 infection as in k. m, Number of DARs annotated in promotor or exon regions in GFI1ΔCD8 CD8+ P14 T cells compared with WT CD8+ P14 T cells as in l. n, Predicted GFI1 binding motif by HOMER analysis using DEGs from GFI1ΔCD8 CD8+ T cells isolated at D7 post LCMVc13 infection as in h. Statistical significance was calculated using a two-tailed paired t-test (b and d–g) or Wald’s test (j, l and m).
To identify the transcriptional program regulated by GFI1 following CD8+ T cell activation, WT and GFI1ΔCD8 P14 CD8+ T cells were analyzed by RNA-seq on day 7 and day 21 after LCMVc13 infection. Loss of GFI1 impaired expression of proliferation and cell cycle genes such as Cdk1, Cdk2, E2f2, Mki67 and Top2a (Fig. 3h) and altered transcription of memory genes including Eomes, Id2 and Tox (Fig. 3h,i and Supplementary Table 5). RNA-seq identified 2,832 unique DEGs in GFI1ΔCD8 P14 CD8+ T cells at day 7 and 302 DEGs at day 21 (Fig. 3j). Pathway analyses showed downregulation of DNA replication and cell division pathways (Extended Data Fig. 5e), indicating that GFI1 had a key role in proliferation. GFI1 loss also disrupted metabolic gene expression associated with glucose and lipid uptake such as Acss1, Pgk1 and Uqcrh (Extended Data Fig. 6a,b), increased mitochondrial dysfunction (Extended Data Fig. 6c,d) and reduced granzyme B production (Extended Data Fig. 6e).
GFI1 modifies chromatin to repress transcription29. Assay for transposase-accessible chromatin using sequencing (ATAC-seq) showed that WT and GFI1ΔCD8 P14 CD8+ TN cells had similar epigenetic profiles (Fig. 3k,l and Extended Data Fig. 6f). By contrast, CD8+ T cell activation following LCMVc13 infection resulted in a significant change in the epigenetic profile of LCMV-activated CD8+ T cells compared with CD8+ TN cells (Fig. 3k,l). Both WT and GFI1ΔCD8 CD8+ T cells showed a similar epigenetic profile on day 3 and day 5 after infection, whereas at day 7, the profile of GFI1ΔCD8 CD8+ T cells was substantially different from WT CD8+ T cells (Fig. 3k,l and Supplementary Table 6). Differentially accessible chromatin regions (DARs) were upregulated in GFI1ΔCD8 CD8+ T cells following activation but not in CD8+ TN cells (Fig. 3l,m and Extended Data Fig. 6g). The HOMER motif discovery analysis predicted that the GFI1 binding motif in the promotor region of various targets is important for CD8+ T cell proliferation and differentiation, such as E2f7, Eomes, Foxo1, Havcr2 and Il7r (Fig. 3n and Supplementary Table 7). Altogether, these data show that GFI1-mediated epigenetic silencing regulates the CD8+ T cell transcriptional program to promote their persistence during chronic viral infection.
Loss of GFI1 abrogates inflationary CD8+ T cell responsesMurine cytomegalovirus (MCMV) infection is characterized by the development of ‘memory inflation’ driven by TSCM cell precursors6,30,31. To understand the role of GFI1 in the development of these unusual T cell populations, we generated mixed bone marrow chimeras with WT or GFI1ΔCD8 bone marrow cells. Then, 8 weeks after bone marrow reconstitution, mice were infected with MCMV, and antigen-specific CD8+ T cells were monitored longitudinally in blood (Extended Data Fig. 7a). The number of WT and GFI1ΔCD8 CD8+ T cells in peripheral blood of chimeric mice was similar before virus infection (Extended Data Fig. 7b), suggesting that CD8+ TN cell development from GFI1ΔCD8 bone marrow was not impaired. Following MCMV infection, WT CD8+ T cells mounted a strong response to the non-inflationary M45 epitope at day 7, followed by a sharp contraction of the response (Fig. 4a,b). No change in CD4+ T cell frequency was observed (Fig. 4c). WT M38-specific CD8+ T cells accumulated gradually to produce ‘memory inflation’ during virus latency (Fig. 4a,b)31,32. By contrast, GFI1ΔCD8 CD8+ T cells had impaired responses for both epitopes and contracted prematurely (Fig. 4a,b). The M38 and m139 inflationary epitope-specific GFI1ΔCD8 CD8+ T cells were significantly lower in spleen during latency (Fig. 4d). The inflationary T cell responses have been previously found to be maintained by continuous production of KLRG1+CD27− CD8+ TSLEC cells, which arise from KLRG1−CD27+ memory precursor CD8+ T (TMPEC) cells30,31. The GFI1ΔCD8 M38-specific and total activated CD11a+CD44+CD8+ T cell population exhibited a lower frequency of CD8+ TSLEC cells (Fig. 4e and Extended Data Fig. 7c). Thus, GFI1 deficiency resulted in loss of long-term CD8+ T cell responses, in particular inflationary responses, following latent virus infection. GFI1ΔCD8 P14 CD8+ T cells mounted an impaired inflationary response following infection with a recombinant MCMV that expressed LCMV gp33 epitope (MCMV-ie2-gp33) (Fig. 4f,g). This included reduced CD8+ TSCM cells, CD8+ TCM cells (Fig. 4h) and CD8+ TSLEC cells (Extended Data Fig. 7d) and lower Ki-67, TCF1, EOMES and TOX expression (Extended Data Fig. 7e). Altogether, these data demonstrate the essential role of GFI1 in mounting inflationary CD8+ T cell responses in MCMV infection.
Fig. 4: GFI1 is essential for persistent CD8+ T cell responses to cytomegalovirus infection.
a,b, Representative flow cytometry plots at D7 and D90 (a) and total number at D0–D90 (b) of CD45.1+M45+ and CD45.1+M38+ CD8+ T cells post infection with MCMV in the peripheral blood of chimeric C57BL/6 mice that were reconstituted with a 1:1 mix of congenically labeled Cd8acre/+ (WT) CD45.1+ and WT CD45.2+ (WT) or Cd8acre/+Gfi1fl/fl (GFI1ΔCD8) CD45.1+ and WT CD45.2+ (GFI1ΔCD8) bone marrow (BM) after lethal irradiation and infected with MCMV 8 weeks post BM reconstitution. c, Frequency of blood CD45.1+CD8+ T cells and CD45.1+CD4+ T cells among CD8+ and CD4+ T cells in WT and GFI1ΔCD8 mice as in a. d, Total splenic M38+CD45.1+CD8+ and m139+CD45.1+CD8+ T cells at D90 post infection with MCMV in WT and GFI1ΔCD8 mice as in a. e, Representative plot (left) and quantification (right) of CD45.1+KLRG1+CD27− CD8+ TSLEC cells and CD45.1+KLRG1−CD27+ CD8+ TMPEC cells in spleen at D90 post infection with MCMV in WT and GFI1ΔCD8 mice as in a. f, Kinetics of WT or GFI1ΔCD8 CD8+ P14 T cells at D0, D14, D30, D60 and D90 post MCMV-ie2-gp33 infection in the peripheral blood of C57BL/6 mice that received 1:1 mix of congenically labeled WT and GFI1ΔCD8 CD8+ P14 TN cells followed by infection with MCMV-ie2-gp33 24 h post transfer. g, Number of WT and GFI1ΔCD8 CD8+ T cells in the spleen, mLN and lung at D90 post infection with MCMV-ie2-gp33 as in f. h, Number of CD8+ TSCM and CD8+ TCM cells in the spleen at D90 post infection with MCMV-ie2-gp33 as in f. Data are shown as means; error bars, s.e.m. i, Normalized gene expression in splenic WT and GFI1ΔCD8 CD8+ P14 T cells at D7 post infection with MCMV-ie2-gp33 as in f. j, Frequency of upregulated and downregulated DARs in splenic GFI1ΔCD8 CD8+ P14 T cells at D7 post infection with MCMV-ie2-gp33 as in f. Outer donut, distribution of DARs within the exonic regions (3′-UTR, 5′-UTR, CDS and other exons). P values: two-tailed Student’s t-test (b–e); two-tailed paired t-test (f–h). Data in b–e are pooled from three experiments; mean values are shown; error bars, s.e.m. (n = 10 mice per group); data in f–h are pooled from two experiments (n = 10 mice). CDS, coding DNA sequence; UTR, untranslated region.
Transcriptional analysis showed that GFI1ΔCD8 CD8+ T cells downregulated TEFF cell surface receptor genes such as Cx3cr1 and Klrg1 (Fig. 4i and Supplementary Table 8). Furthermore, the transcriptional profile of GFI1ΔCD8 P14 CD8+ T cells was similar following infection with either MCMV-ie2-gp33 or chronic LCMVc13 (Fig. 3i), with GFI1ΔCD8 cells showing both Eomes and Tox downregulation (Fig. 4i). We observed that Tnf expression was upregulated in GFI1ΔCD8 P14 CD8+ T cells (Fig. 4i). Peptide stimulation confirmed a higher frequency of IFNγ+ and TNFα+ cells among GFI1ΔCD8 CD8+ T cells compared to WT CD8+ T cells (Extended Data Fig. 7f). Following MCMV infection, ATAC-seq revealed that GFI1 deficiency resulted in increased chromatin accessibility in GFI1ΔCD8 CD8+ T cells (Fig. 4j and Extended Data Fig. 7g), with 54,137 upregulated DARs and 646 downregulated DARs (Supplementary Table 9) compared to WT CD8+ T cells. Thus, GFI1 acted to epigenetically repress the transcriptional landscape of CD8+ T cells and promote inflationary T cell responses to cytomegalovirus infection.
GFI1 epigenetically regulates TSCM CD8+ T cell transcriptionTo map the epigenetic and transcriptional landscape at single-cell level, we performed single-cell multiome sequencing (scMultiome-seq), which combines ATAC and gene expression analyses on WT and GFI1ΔCD8 P14 CD8+ T cells isolated at day 7 after LCMVc13 infection (Extended Data Fig. 8a). Uniform manifold approximation and projection (UMAP) and unsupervised clustering of integrated WT and GFI1ΔCD8 CD8+ T cells divided them into seven clusters based on their epigenome and transcriptome (Fig. 5a,b and Extended Data Fig. 8b). Cluster 1 was identified as CD8+ TSCM cell precursors and clusters 2 and 3 were proliferating cells, respectively (Extended Data Fig. 8c). Cluster 1 cells expressed high levels of Tcf7, Slamf6 and Id3 and were thus annotated as CD8+ TSCM cells (Extended Data Fig. 8d), while cluster 2 and cluster 3 cells expressed high levels of Cdk1, Birc5 and Mki67 (Extended Data Fig. 8d). The GFI1ΔCD8 CD8+ T cell population had fewer cells in clusters 1 and 2 (Fig. 5c and Extended Data Fig. 8b). By contrast, a higher fraction of the GFI1ΔCD8 CD8+ T population was located in cluster 5 (Fig. 5c). This population exhibited reduced expression of genes associated with proliferation and high expression of Btg1 (Extended Data Fig. 8d). GFI1ΔCD8 CD8+ T cells had high Btg1, while E2f2, Eomes and Tcf7 was downregulated (Fig. 5d,e). scATAC-seq data confirmed increased chromatin accessibility at the Btg1 locus in clusters 1 and 5 (Extended Data Fig. 8e). To identify DEGs and DARs within the CD8+ TSCM cell cluster, we performed pseudobulk RNA-seq (Supplementary Table 10) and ATAC-seq (Supplementary Table 11) analyses on cluster 1 cells. These analyses showed that loss of GFI1 led to increased Btg1 and Btg2 expression, whereas the expression of Tcf7, Eomes, Bcl2 and Mki67 was reduced in CD8+ TSCM cells (Fig. 5f). These transcriptional changes were linked to upregulated DARs in the Btg1 and Btg2 gene loci and downregulated DARs in E2f1 and Mki67 genes (Fig. 5f). Thus, GFI1ΔCD8 CD8+ TSCM cells had reduced proliferation gene expression and increased quiescence gene expression.
Comments (0)