
Remember me


Previous work (Cai et al. 2019) has shown that in E. coli cultures at low temperatures, up to OD600 = 6, before induction, a high amount of protein (relative to the amount of medium used), with isotopic labelling of approximately 97% is obtained. Despite this good result, there is a percentage of the 13C-D-glucose that is used just to generate biomass and therefore “wasted” to improve the yield of labelled protein.
A simple way to improve this would be to combine this protocol with a first step of biomass generation in rich media, similar to other protocols, which switch to labelled media by centrifugation and produce high yields of labelled proteins. One drawback of this approach is that centrifugation steps can be stressful for the bacteria, and they recover slowly. In fact, the OD600 can drop in the first few moments in minimal media, and it is difficult to estimate how long the bacteria need to be grown in these media before induction to maximize expression and minimize detrimental unproductive consumption of labelled nutrients.
Therefore, it can be hypothesized that the complete consumption of unlabelled glucose in minimal media could be as efficient in terms of biomass production as using rich media but avoiding the stress of centrifugation. It has been reported that E. coli recover quickly from short periods of starvation with no apparent sequelae (Lempp et al. 2019). In addition, the cells adapt to grow in these minimal media from the beginning, further reducing the stress of switching from rich to poor media and minimizing the time required to incorporate labelled metabolites.
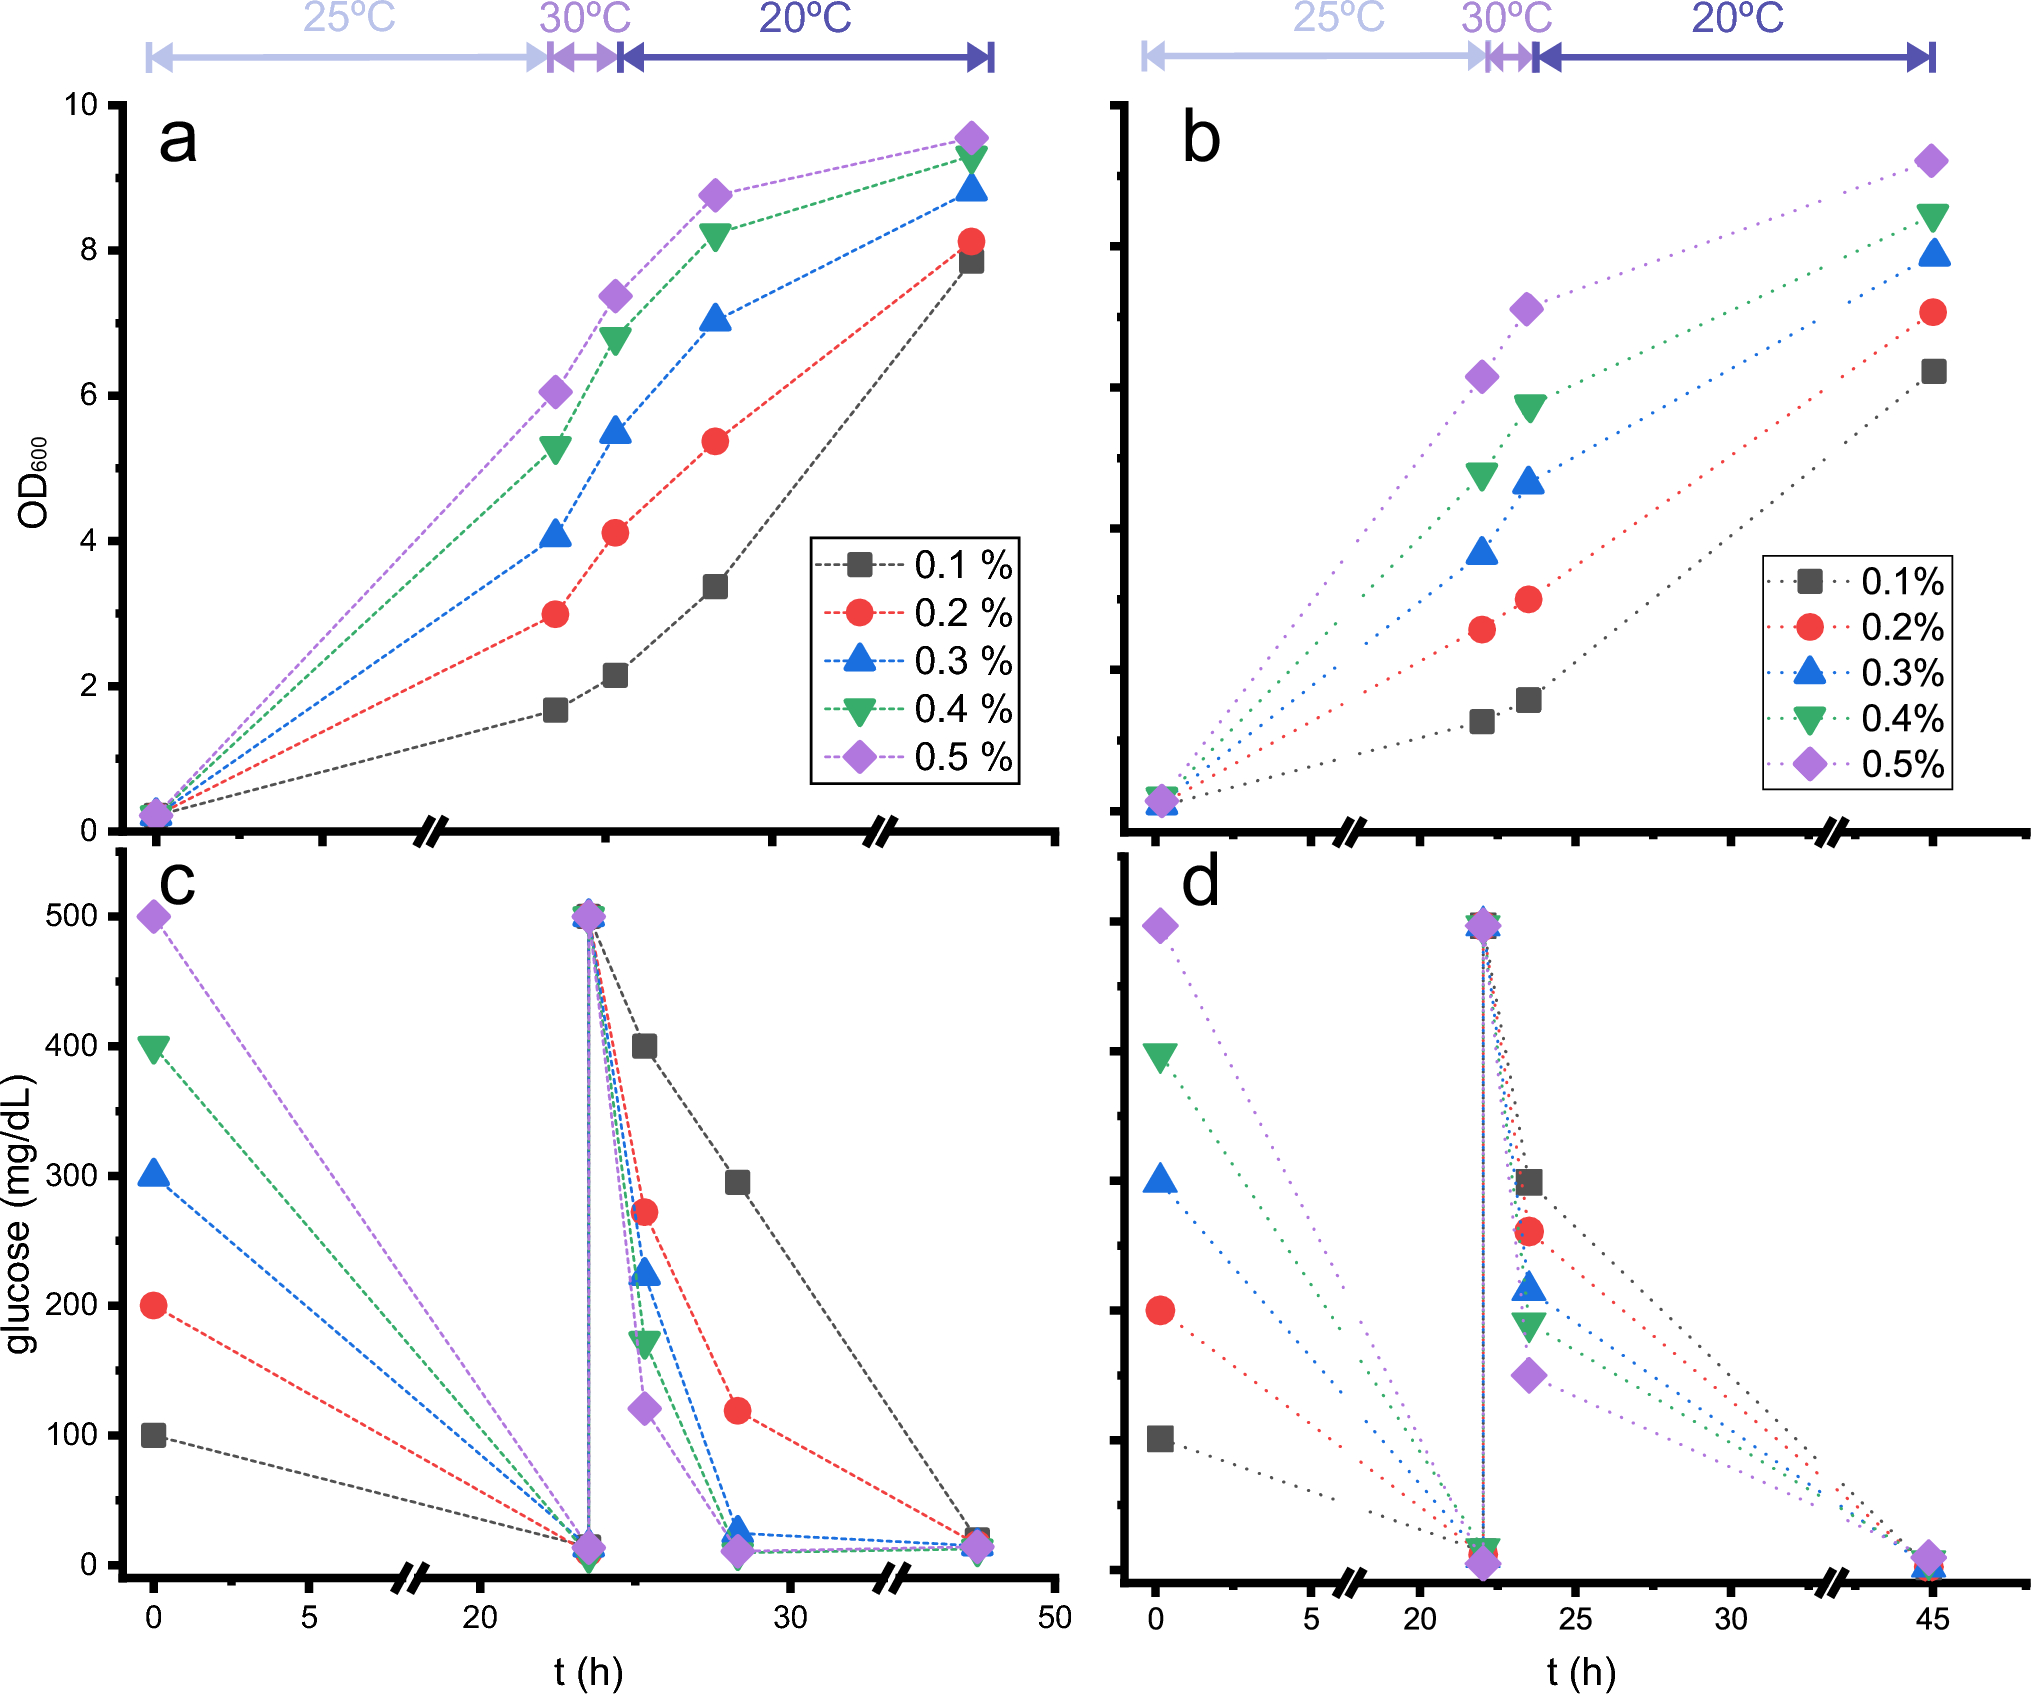
To evaluate this hypothesis, biomass production and glucose consumption were monitored under different conditions (Fig. 1a, c). Different initial D-glucose concentrations were tested. In all the samples, after 23 h of growth at 25 °C, 0.5% D-glucose was added, and the culture continued to grow at 30 °C for 1.5 h, followed by growth at 20 °C for another 24 h. The depletion of glucose after overnight growth was complete under all the conditions tested, and the growth rate recovery appeared to be complete after the addition of supplemental 0.5% D-glucose. Although it was predictable that some of this additional D-glucose would be consumed during the isotope integration step, after 1.5 h at 30 °C, the remaining nutrient content was extremely low for the cultures with high initial glucose concentrations, leaving around 0.1% D-glucose available for the protein expression step under the initial 0.5% D-glucose condition. After 3 additional hours at 20 °C, no glucose remained for the 0.3, 0.4 or 0.5% initial glucose conditions.
Fig. 1
Optical density (a, b) and dissolved D-glucose (c, d) in E. coli cultures as a function of initial D-glucose concentration. Cultures were kept at the temperatures indicated at the top of the figure, mimicking the steps in the induced cultures, i.e., 25 °C during the ‘biomass generation step’, 30 °C after the addition of 0.5% 12C-D-glucose (a, c) or 0.5% 13C-D-glucose (b, d) and 20 °C after the induction with IPTG (‘expression step’). The dashed lines do not represent linear growth and are only added to help locate points from the same conditions
Differences due to switching from one isotope to the other –12C to 13C– in the “isotope integration step”, while keeping the rest of the conditions unchanged, were also tested (Fig. 1b, d). Although there is some variability during growth, as indicated by OD600 measurements, even before the addition of labelled glucose -probably due to the different colony used for each set of experiments-and it seems that the behaviour for 13C-D-glucose consumption is slightly different from that for 12C-D-glucose, the final global behaviour is very similar for both isotopic intakes: initial unlabelled glucose was completely consumed after 23 h at 25 ℃. When new glucose is added, 12C or 13C, the higher the initial glucose, the higher the consumption of glucose before IPTG induction and, after IPTG addition, glucose is completely consumed after 24 additional hours. Other studies indicated a small influence of 13C or 12C glucose in the metabolism of E. coli (Sandberg et al. 2016) and even a slight decrease of growth (usually under a 5%) using 13C-glucose (Xie and Zubarev 2015).
Thus, a counterintuitive result was found: it is not convenient to produce large amounts of biomass but rather to find a compromise between biomass and the consumption of labelled glucose to improve the final protein yield.
Influence of initial glucose/labelled glucose ratio on isotope incorporationThe second variable monitored was the incorporation of 13C into the labelled protein. The data show that at high initial glucose, only partial incorporation into the protein was reached, but when the initial glucose was reduced from 0.5 to 0.4% and to 0.2%, the incorporation increased from 75 to 90% and 98%, respectively, as detected by NMR (Fig. 2).
Fig. 2
13C incorporation under different culture conditions measured by NMR. Spectra with or without a 13C decoupling pulse are shown. On the left, the full spectra are shown; on the right, the selected region is magnified. To improve clarity, the spectra are shifted vertically. For each pair of numbers naming each condition, the first of the two indicates the initial percentage of unlabelled glucose in the culture and the second indicates the percentage of 13C-glucose added after consumption of the previous one
These results led to the testing of other conditions—decreasing the glucose in the biomass generation step and increasing the labelled glucose added in the “isotope integration step”. The protein yield under each new condition was greater for 0.2–0.3% D-glucose in the “biomass generation step” combined with at least 1% D-glucose added in the “isotope integration step” (Fig. 3).
Fig. 3
Yields of protein with different percentages of initial D-glucose and D-glucose added. For each condition, the first number indicates the initial glucose percentage in the culture and the second one the percentage of 13C-glucose added after consumption of the previous one. n.i.: not induced; Marley: Marley et al (2001) conditions. a: Fluorescence emission under UV exposure of an SDS‒PAGE gel. b: Bar graph representing the relative fluorescence according to the method of Marley et al. considered as a unit
“Isotope integration step” durationConsidering the data from the previous experiments, the effect of varying the time of the “isotope integration step” was tested by monitoring the protein yield and 13C incorporation (Fig. 4, Supplementary Fig. 1). A second counterintuitive fact emerged: there is a minimal effect of the length of this phase on 13C incorporation, which is always approximately 97–98% and can even be eliminated without any effect on yield of protein or 13C incorporation.
Fig. 4
Effect of different “isotope integration” times (in minutes) on yield and 13C labelling. a: Fluorescence emission under UV exposure of an SDS‒PAGE gel. Rightmost lane are molecular weight markers. b: Bar graph representing the relative fluorescence according to the method of Marley et al. 2001, which was used as a unit. The data are the mean of three experiments. Error bars are for standard deviations. c: Mass spectra. The masses of the more intense peak for each condition are given in the square. The expected mass for CNRIP1a is 18,705 Da without labelling and 19,548 with complete 100% 13C incorporation. To calculate the percentage of incorporation, the formula \(\% } = 100 \times \, \left( } - }} \right)/\left( }100\% } - }} \right)\) can be used. So, for masses of 19,527 and 19,528 Da, the percentage incorporation was 97.5 and 97.6%, respectively
As the initial data indicated that for 0.5/0.5% conditions, even with a 1.5 h isotope integration step the incorporation was approximately 75%, it seems that, in any case, the relative ratio between the initial unlabelled and subsequently added labelled glucose should not exceed 20% (0.2% initial D-glucose, 1% labelled D-glucose).
Glucose depletion vs. temperatureAlthough all biomass generation cultures were performed at 25 °C to ensure maximum O2 availability to the cells, the influence of temperature on growth was monitored at 25 °C, 30 °C and 37 °C (Fig. 5). Complete glucose depletion is reached in overnight cultures at 25 °C or 30 °C, whereas at 37 °C, complete glucose depletion is achieved after approximately 5.5 h. This would allow the biomass generation step to be shortened. However, the high growth rate at 37 °C could have disadvantages, such as a lower number of ribosomes per cell (Marr 1991) or a possible microaerobic state, which could promote the accumulation of acetate (Partridge et al. 2007) and therefore inhibit cellular growth or the expression of the desired protein (Shiloach and Fass 2005). Finally, other E. coli strains or plasmid-strain combinations may be less efficient in nutrient consumption than those tested here and may require longer culture times. Although the total time for cultures at 25 °C or 30 °C is longer, the active time for the present method decreases from approximately 1–2 h (due to measurements of the OD600 until it reaches 0.6, centrifugation, resuspension in minimal medium, and addition of inductor) to approximately 5–10 min (due to the addition of labelled nutrients and inductor simultaneously) (see Table 2). Taking all these facts into consideration, for this method, it is recommended to grow the culture at 25 ℃.
Fig. 5
Optical density (top) and dissolved D-glucose (bottom) in E. coli BL21star(DE3) cultures as a function of temperature. The dashed lines do not represent linear growth and are only added to make it easier to locate symbols from the same conditions. At 30 °C, no recording was made at the likely hour of complete D-glucose consumption, so an unfilled circle was added on the basis of the exponential behavior of the curves to provide an indication of the approximate time of the event
Table 2 Time spent in different protocols 13C-Glucose concentration optimizationThe influence of different glucose concentrations during the expression step on yield was also investigated (Fig. 6). A slight increase in yield was detected when the glucose concentration in the expression step increased from 1 to 1.5%, but the yield decreased at higher percentages. In any case, the increment of yiels obtained adding 1.5% 13C-D-glucose is within the statistical margin of error when compared with the yield obtained adding 1% 13C-D-glucose Thus, we have chosen 0.2% initial unlabelled + 1% added labelled as universal conditions for the method in an attempt to keep the conditions in a safe range where, given the possible variability between plasmid and strain combinations, we can ensure that we avoid concentrations too close to those that produce a significant decrease in expression/13C consumption ratio. Slight improvements can be achieved for individual proteins and/or strains. In any case, this method clearly improves the yield of labelled protein compared with some of the previously described protocols, and even in the least favorable case, there is a 20% increase. The tests indicate that 50 mL of culture (0.5 g of 13C-D-glucose) is sufficient to obtain 10–20 mg of purified labelled protein. Notably, Sivashanmugam’s protocol was modified, and 3 times more NH4Cl was used for this experiment. When the original amounts were used, the yield was drastically reduced (see Fig. 9 below), indicating the importance of an appropriate ratio of nutrients to obtain the maximum yield in any protocol.
Fig. 6
Effect of the percentage of D-glucose added in the “protein expression step” on protein yield. The pair of numbers naming each condition indicates the initial glucose concentration and that added after consumption of the first one (both in percentage); Cai indicates conditions from Cai et al, (2019) and HCDI* conditions from Sivashanmugam et al. (2009) with 3 times more NH4Cl than the original. a: Fluorescence emission under UV exposure of an SDS‒PAGE gel. b: Bar graph of relative fluorescence of the band corresponding to CNRIP1. Band intensities were referenced to the HCDI* band. For comparison, a checkered bar corresponding to the relative yield obtained using Marley et al. protocol, which was determined in previous experiments, was added to the graph. The data are from five experiments
The ratios of NH4Cl and D-glucose in this recipe were calculated to ensure that glucose was the limiting nutrient. In this way, it can be ensured that all the unlabelled glucose has been depleted in the biomass production step. Since 13C-labelled proteins for NMR are usually also 15N-labelled, 15NH4Cl must be used from the beginning because it cannot be assured that there is no remaining nitrogen that has not been consumed in the initial steps. Since 15NH4Cl is much cheaper than 13C-D-glucose, net savings still prevail, and it will be even more significant if we need to use D7-13C-D-glucose or other isotope-labelled precursors, which are even more expensive than 13C-D-glucose.
Scale up influenceSome of the optimizations described above were carried out in small volumes, usually 5 ml while the productions for NMR samples were carried out with 50–100 ml of media. To check if there was any effect on incorporation or growth due to the different scale, different volumes of media were tested keeping the same ratio (1/20) to the Erlenmeyer volume (Fig. 7). Although there are slight differences in OD600 and glucose consumption between each condition, there is no direct correlation with the culture volume. In any case, the isotope incorporation of around 97%, and similar protein yields are maintained for all the conditions, indicating that the protocol is consistent regardless of the culture volume, at least in the ranges tested. Volumes of 50–100 ml of culture provide enough labelled protein for 0.5 ml samples of approximately 0.5–1 mM.
Fig. 7
Effect of different volumes of culture for constant media volume/Erlenmeyer volume ratios. a. Optical densities. b. Free D-glucose in media. c. protein yield quantified for fluorescence emission after SDS-PAGE. Values are mean of three experiments. Error bars indicate standard deviations. d. Mass spectra. for each condition. % Incorporation for each condition were: 97.2 for 6.25 mL, 97.0 for 12.5 mL and .97.5 for 25 and 50 mL
Universality and applicability of the method: other proteins and other strainsFinally, two experiments were carried out to test whether this method could be used universally, regardless of the strain or protein expressed. To check for strain independence, CNRP1 was expressed in the BL21star(DE3), Turner™(DE3), C41(DE3), and Shuffle® T7 LysY strains, and 13C incorporation was determined by mass spectrometry. No significant differences in glucose uptake or protein expression were found between these strains and the 13C incorporation was almost identical (97.6%, 97.4%, 97.9% and 96.9%, respectively) (Fig. 8). To determine the variations of yield in the expression of different proteins depending of the protocol used, the method was tested on the proteins CNRIP1, PHOX2b XS and NEX XF1 (Fig. 9). In all of them, a higher quantity of protein was obtained with the method described here than with the other protocols. Although, the ratios between the different methods are not exactly the same for the three proteins, the yield per gram of glucose is higher with this method for the three proteins tested.
Fig. 8
Effect of the E. coli strain on glucose consumption and protein expression. Top: dissolved glucose at different culture times for 3 different E. coli strains. Bottom: mass spectra of CNRIP1a expressed in different strains with the method described in this paper. The mass of the more intense peak for each condition is given in the square. To calculate the percentage of incorporation the formula \(\% } = 100 \times \, \left( } - }} \right)/\left( }100\% } - }} \right)\) can be used. So, for masses of 19,523, 19,525, 19,528, and 19,530 Da, percent incorporation was 96.9%, 97.3%, 97.6%, and 97.9% respectively. The second intense peak detected for some strains corresponded to the double ionized DNaseI added during purification
Fig. 9
Relative protein yield for three different proteins using different protocols. Each protein expression is referenced to the expression obtained using Marley’s protocol, which is considered a unit. Error bars indicate standard deviations
Comments (0)