
Remember me


The study was approved by the Swedish National Ethical Review Authority (2020–07227) and conducted following the Helsinki Declaration and its subsequent revisions. It included mechanically ventilated patients within 72 h of invasive mechanical ventilation in an early phase of ABI. Patients were admitted to the neurosurgical intensive care unit (Neuro-ICU) of the Uppsala University Hospital, Sweden. As the patients were unconscious at the time of inclusion, informed consent was obtained from the patient’s next of kin. A detailed description of the methods is reported as supplementary material.
Inclusion and exclusion criteriaPatients were prospectively screened for eligibility according to predefined inclusion criteria: 1) age older than 18; 2) ABI within 72 h from inclusion, i.e. subarachnoid haemorrhage; subdural haemorrhage; intracranial haemorrhage; traumatic brain injury; 3) less than 72 h since initiation of mechanical ventilation and insertion of invasive intracerebral pressure monitoring device; 3) mechanical ventilation expected to last for longer than 72 h; 4) ongoing ICP measurement. Exclusion criteria were: 1) chest tube or open chest trauma; 2) absolute contraindication to the insertion of nasogastric catheters: e.g., oesophagus rupture and oesophageal bleeding; 3) contraindication for the use of EIT: pacemaker and implantable cardioverter defibrillator, pregnancy, thoracic skin lesion, and burns on the belt area; 4) hemicraniectomy.
Monitoring proceduresAt inclusion, a nasogastric catheter for oesophagus pressure (Pes) monitoring (14Fr, Nutrivent, Sidam) was placed. At the moment of data acquisition, the oesophageal catheter and a patient spirometry catheter (D-lite + , GE Healthcare) with 9.5 ml instrumental dead space, not significantly interfering with patient CO2 clearance, were connected to the Pulmovista 500 pressure transducer (Pressure Pod, Dräger). Based on clinical routine, all patients had a central line catheter for drug infusion and central venous pressure (CVP) monitoring and an arterial catheter for invasive systemic blood pressure monitoring. Following clinical practice for intubated patients, side-stream capnography was recorded, and end-tidal carbon dioxide (EtCO2) was continuously monitored. All respiratory, haemodynamic, and neuromonitoring variables, including EIT imaging, were simultaneously acquired and synchronised offline for data analysis using MatLab, R2023b (The Mathworks, Natick, MA, USA). Demographics, epidemiologic, and clinical data were obtained from electronic medical records.
Patient management during data collectionFor data acquisition, all patients were placed in a semi-recumbent 30° head-elevated position and continuously sedated according to local standard practice. Deep sedation and complete neuromuscular blockade were established before data acquisition. The intraventricular drain catheter was closed throughout the protocol for ICP recording. An EIT belt was placed to collect chest impedance changes related to lung ventilation (Pulmovista 500, Dräger, Germany). The EIT belt was in place only during data acquisition and then removed, not interfering with clinical procedures. We strictly aligned with neuroprotection care bundle principles and always prioritised patient safety and best care. Data were not collected in case of severe respiratory, haemodynamic, or neurologic instability.
Protocol and data collectionThe ventilation mode was first changed to volume-controlled with a tidal volume of 6–8 ml/kg predicted body weight (PBW). The respiratory rate was adjusted to keep EtCO2 constant and maintain the clinical target of arterial pressure of carbon dioxide (PaCO2) unchanged. The fraction of inspiratory oxygen (FIO2) was set to stay partial pressure of arterial oxygen (PaO2) higher than 90 mm Hg. Data recording was initiated, and a standardised lung recruitment manoeuvre was performed, followed by a decreasing PEEP titration. Baseline PEEP was set based on best static compliance. After PEEP titration, an inspiratory-hold and an expiratory-hold manoeuvre were performed. A low-flow (5 L/min) inflation starting from PEEP 0 cm H2O and reaching the patient’s set tidal volume was performed to identify airway opening pressure (AOP), as previously described [16]. After baseline ventilation and reduction of respiratory rate to 10 breaths per minute to exclude the onset of intrinsic PEEP, patients were exposed to a single-breath derecruitment manoeuvre from high to low PEEP, with a delta of 10 cm H2O to calculate the RI ratio as previously described [13, 14]. Each PEEP step was set for at least three minutes, and plateau pressure was measured at low PEEP at the end of the manoeuvre. The RI ratio was spirometrically computed, and EIT images were acquired for a subsequent offline analysis of the recruited and inflated volumes. EIT images and other analysed variables were selected for each PEEP level during steady-state conditions.
Analysis of respiratory variablesThe end-expiratory transpulmonary pressure (Ppl) was directly calculated by subtracting Pes from PEEP [17]. This estimation of Ppl greatly reflects the dependent lung regions and is, as such, more representative of lung collapse [18]. Given its importance in promoting the transmission of static respiratory pressures to the intrathoracic and intracranial cavities [19, 20], chest wall elastance and its ratio to respiratory system elastance (ECW/ERS), as well as lung elastance (EL) where ERS = ECW + EL, were calculated. Given its clinical impact in mechanically ventilated patients with ABI [8], mechanical power was calculated as in Gattinoni et al. [21].
Analysis of neuromonitoring variablesCerebral perfusion pressure (CPP) was calculated by subtracting ICP from mean arterial pressure (MAP). The pressure reactivity index (PRx), an indicator for cerebral autoregulation, was calculated as previously described [2]: a moving Pearson correlation coefficient between MAP and ICP averaged over 10 s, using a 5-min moving time window. Thereafter, the values collected during a time interval of 1 h before the protocol started were averaged. A PRx value higher than 0.2 reflects poor cerebral autoregulation. The ICP pulse waveform analysis in the time domain was conducted to identify the second peak (P2), also called the tidal wave of the ICP curve, which is a proxy for intracranial compliance [22].
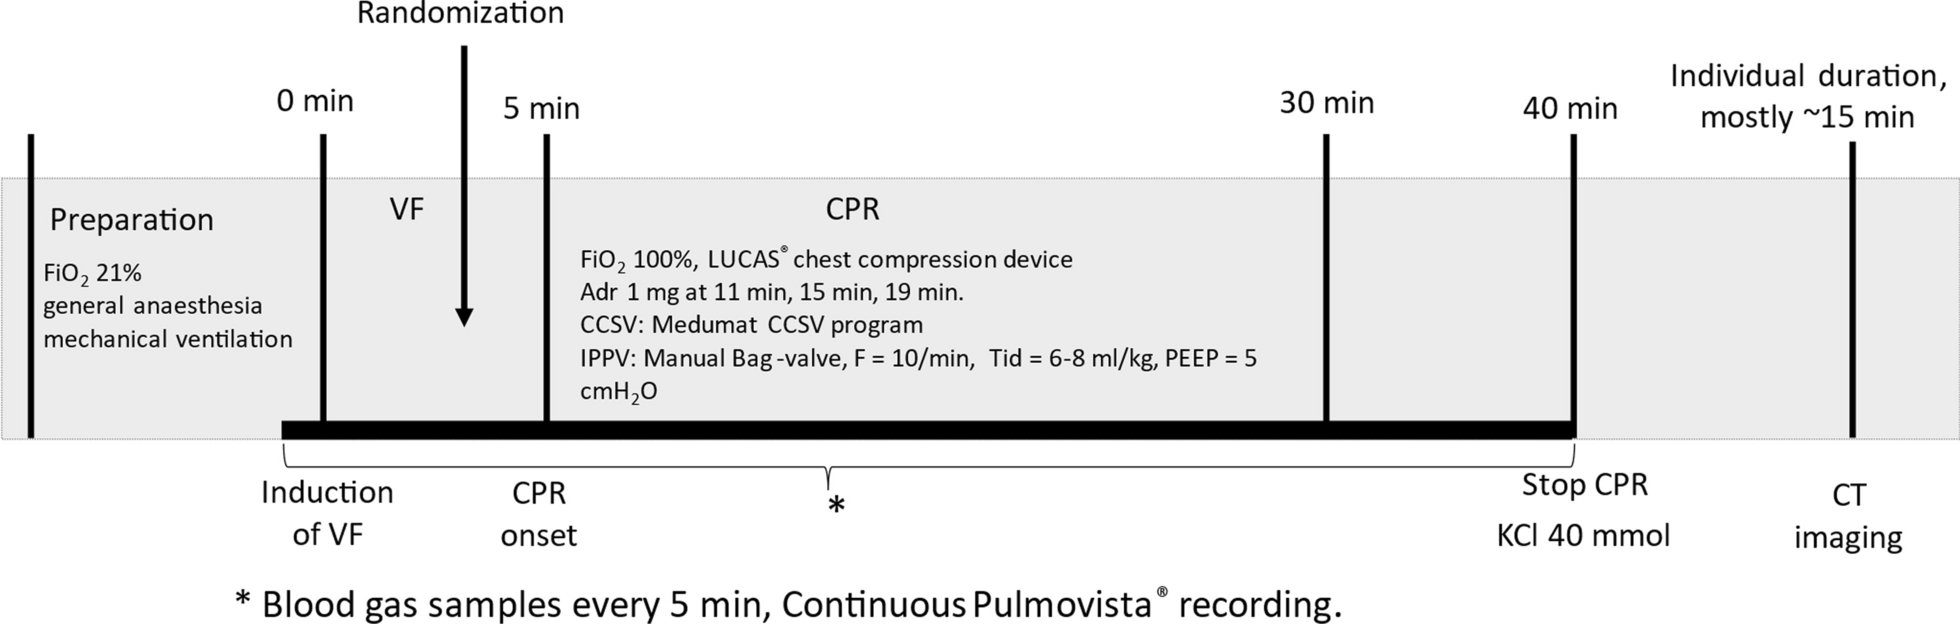
Analysis of haemodynamics and other variablesMAP was calculated as the sum between 1/3(systolic blood pressure) and 2/3(diastolic blood pressure). Arterial and central venous blood samples were collected three times during the protocol: 1) at least 5 min after the lung recruitment manoeuvre, 2) at high PEEP, and 3) at low PEEP during RI manoeuvre. Based on blood gas analysis, the ventilatory ratio, estimating the dead space fraction, was calculated as: (minute ventilation [ml/min] × PaCO2 [mm Hg]) / (PBW × 100 [ml/min] × 37.5 [mm Hg]) [23]. The shunt fraction was estimated based on the venous admixture determination, considering the central venous oxygen saturation as an acceptable surrogate for mixed venous oxygen saturation and assuming the respiratory ratio equal to 0.8 [24]. Figure 1 provides a schematic representation of the protocol
Analysis of EIT dataA. The RI ratioThe EIT baseline was set to correspond to the dynamic image with the lowest global impedance during expiratory hold at low PEEP. After that, dynamic EIT images (32 × 32 matrix) corresponding to 1) inspiratory hold PEEP low and 2) expiratory hold PEEP high were selected. For both selected EIT images, pixels characterised by delta impedance values (ΔZ) below 20% of the highest ΔZ in the same EIT image were considered not ventilated [25,26,27]. Based on the set tidal volume, impedance changes were translated into corresponding millilitres of gas to obtain the regional (pixel-based) distribution of ventilation [28]. Based on these EIT-derived images and the physiological rationale behind the RI ratio manoeuvre, the following three spirometric volume and volume maps, the latter providing pixel-wise information, were computed (see Figs. 1 and 2):
1)Delta end-expiratory lung volume (ΔEELV): the global change in lung volume corresponding to a delta PEEP of 10 cm H2O, between PEEP high and PEEP low and calculated as follows:
ΔEELV = (EIT image during expiratory hold PEEP high) – (EIT image during expiratory hold PEEP low)
where (EIT-derived image during expiratory hold PEEP low) corresponds to the EIT baseline.
2)Inflated volume (Vinfl) : the portion of ΔEELV inflating the already opened lung when going from PEEP low to PEEP high and calculated as:
Vinfl = [(EIT image during inspiratory hold PEEP low—EIT image during expiratory hold PEEP low)/ (plateau pressure – PEEP low)] x (PEEP high – PEEP low).
where [(EIT image during inspiratory hold PEEP low—EIT image during expiratory hold PEEP low)/ (plateau pressure – PEEP low)] is the compliance of the lung open at PEEP low.
3)The recruited volume (Vrec): the portion of ΔEELV recruiting new portions of lung parenchyma when going from PEEP low to PEEP high and calculated as:
Vrec = ΔEELV- Vinfl. The Vrec was then expressed as a percentage (Vrec%) of the corresponding ΔEELV.
Fig. 1
Study protocol for the primary analysis and estimation of EIT-based RI ratio. RI ratio with tested ΔPEEP equal to 10 cm H2O. BGA blood gas analysis, EIT electrical impedance tomography, PEEP positive end-expiratory pressure, AOP airway opening pressure, RI ratio recruitment–inflation ratio
Fig. 2
Method to calculate delta end-expiratory lung volume (ΔEELV), inflated volume (Vinfl) and recruited volume (Vrec). A Graphic representation of the three analysed volumes on the pressure–volume axes. B Representative example of spirometric volume and volume maps. The latter provides pixel-wise information about the analysed volumes. ΔEELV = Vinfl + Vrec, where ΔEELV = (EIT-image during expiratory-hold High PEEP) – (EIT-image during expiratory-hold LOW PEEP); Vinfl = [(EIT-image during inspiratory-hold Low PEEP)/ (plateau pressure – low PEEP)] x (high PEEP); Vrec = ΔEELV- Vinfl. Abbreviations: ΔEELV delta end-expiratory lung volume; Vinfl inflated volume; Vrec recruited volume, EIT electrical impedance tomography, PEEP positive end-expiratory pressure
B. Regional complianceTo further investigate regional lung recruitability and confirm lung recruitment and inflation at the two tested PEEP, regional maps of compliance at both low and high PEEPs have been computed based on the tidal impedance changes between plateau pressure and the corresponding PEEP [29]. The estimated tidal volume per pixel was then divided by the measured driving pressure to obtain the compliance maps (Fig. 3). Subsequently, the compliance map at high PEEP was subtracted from the compliance map at low PEEP to obtain the distribution of differential compliance. In this way, we discriminated pixels of compliance gain from pixels of compliance loss when lungs were exposed to high PEEP. The number of pixels with compliance gain was then expressed as a percentage of all pixels covering the lung area. Moreover, the mean compliance gain (or loss) was expressed in [ml/cm H2O per pixel]. The pixel compliance gain (or loss) summation was calculated.
Fig. 3
Compliance maps at high and low PEEP and compliance gain and loss based on EIT-analysis. Representative example. For compliance maps at low and high PEEP (left and central figures): the tidal change of ventilation for both PEEP is divided by the corresponding driving pressure. Pixel compliance is reported as ml/cmH2O per pixel. For compliance gain or loss (right figure). Gain is intended as an increase in compliance going from low to high PEEP. Red loss; green gain in compliance. PEEP positive end-expiratory pressure, EIT electrical impedance tomography
C. EIT-based inhomogeneity indexTo investigate the coupling between regional inhomogeneity of lung ventilation and neuromonitoring variables, two EIT-based indices were calculated for the ΔEELV delta volume maps: the global inhomogeneity index (GI) and the local inhomogeneity index (LI) [30]. These two indices report different information about gas distribution. GI is an index of global gas inhomogeneity [31, 32], while LI quantifies local inhomogeneity among neighbouring pixels. GI shows the variation of tidal volume distribution in the whole lung. GI is calculated as the summation of the absolute difference between the median value of the estimated gas volume for each analysed map and the estimated gas volume for every pixel. LI calculates the local differences among neighbour pixels. GI and LI were normalised by dividing them by the total gas content in the analysed volume map to make both indices comparable among patients. We hypothesised that non-uniformity of gas distribution may lead to alterations in cerebral venous outflow, impacting ICP.
GI and LI can be summarised with the following equations as in Zhao et al. [30]:
$$GI = \mathop \sum \limits_ \left| - Median \left( } \right)} \right| \div \mathop \sum \limits_ Dgas_ ,$$
$$LI = \mathop \sum \limits_ \left( \times \mathop \sum \limits_ \left| - Dgas_ } \right|} \right) \div \mathop \sum \limits_ Dgas_ ,$$
where x and y are the coordinates of each pixel; Dgasxy is the value of the differential impedance for the single pixel; Median (Dgaslung)is the median value of impedance in the lung area; m-1 is the number of neighbour pixels equal to eight; Dgasx+i,y+j is the differential impedance for the neighbouring pixels of Dgasxy.
Statistical methodsAn a priori sample size calculation was not feasible as no studies investigated the association between EIT-derived indices of lung recruitability and intracranial pressure in brain-injured patients. Our sample size was comparable to previous physiologic studies regarding PEEP changes in ABI patients [11]. We investigated the association between ventilatory variables (i.e. spirometric RI ratio, percentage of recruitable lung and indices of regional inhomogeneity) and changes in ICP (ΔICP) going from low PEEP to high PEEP levels, where positive changes indicating a higher ICP at low PEEP compared to high PEEP.
The primary outcomes were to test:
1) The association between RI ratio and oxygenation (i.e. PaO2/FIO2).
2) The association between recruited volume and ΔICP.
3) The association between inhomogeneity of gas distribution (GI, LI) and ΔICP.
Secondarily, we investigated changes in respiratory (e.g., static compliance, and end-exp Ppl), neuromonitoring (i.e. ICP, CPP and P2), and haemodynamic (i.e. CVP and MAP) variables when exposed to two different PEEP levels.
Data were expressed as median and interquartile range (interquartile range, IQR) or mean (± standard deviation, SD). The correlation between different variables was assessed using Spearman’s rank correlation coefficient with a 95% confidence interval. F-test statistic (α = 0.05) was used for linear regression analysis. Wilcoxon matched-pairs signed-rank test was used to test statistically significant changes in respiratory and neuromonitoring variables between the two tested PEEP levels. In case of missing values in the data range, the whole pair was excluded from the analysis. Friedman's test, followed by Bonferroni’s correction, was used to test statistical differences for neuromonitoring parameters among baseline ventilation, high PEEP and low PEEP. Statistical analysis was performed using MatLab (MATLAB R2023b, MathWorks, MA, USA) and GraphPad (GraphPad Prism v10, California, USA).
Comments (0)