
Remember me


We conducted this experimental animal study on healthy landrace pigs (n = 31, both sexes) at the Laboratory Animal Centre, Large Animals Unit at the Viikki Campus of the University of Helsinki between May 2021 and December 2022. The study was approved by the Finnish National Animal Experiment Board (ESAVI/ 4121/2021). The study is reported in adherence to the ARRIVE guidelines [17], and a checklist is included in Additional file 1.
Preparation and monitoringThe fasted animals were premedicated with intramuscular injections of medetomidine (9–10 mg) and racemic ketamine (450–500 mg). An IV line was inserted into an ear vein, and anaesthesia was induced with IV propofol (dose 1–1.5 mg/kg) and fentanyl (3–4 mcg/kg), after which endotracheal intubation was performed (internal diameter 6.0–7.0 mm). Mechanical ventilation was started (Servo Ventilator 900C, Siemens-Elema, Solna, Sweden) with 21% oxygen (O2) and an end-tidal carbon dioxide (EtCO2) target of 5%. The internal jugular vein and femoral artery were cannulated (arrow, size 8.5 Fr. 16 cm, Teleflex Medical Europe Ltd, Westmeath, Ireland and Avanti+, size 6F, length 11 cm, Cordis, Tipperary, Ireland, respectively), and baseline blood samples were taken. A temporary pacemaker wire was inserted next, and the right ventricular location was confirmed with the achievement of ventricular pacing (Medtronic 5348 Single Chamber Temporary Pacemaker, Soma Tech INTL, Bloomfield, CT, USA).
Arterial blood samples were analysed with a point-of-care device (i-STAT System, Abbott Laboratories, Princeton, NJ, USA), and haemodynamic and respiratory variables, including spirometry, were monitored using a Datex-Ohmeda AS/3 monitor with a M-COVX gas module (GE Healthcare, Helsinki, Finland) and recorded using data collection software (iCentral® and S/5 Collect®, GE Healthcare, Helsinki, Finland). A rectal temperature probe was inserted, and a normal temperature of 38 °C–39 °C was targeted with the use of warm blankets when necessary. Cerebral oximetry was performed with NIRS (INVOS TM5100C Cerebral Oximeter, Somanetics Inc., Troy, MI, USA) with one sensor in the forehead and another on the belly as a control. The EIT belt was set around the chest just caudal to the compression device piston. The hair under the belt was shaved off, and the skin was cleaned with 70% ethanol to ensure the best possible conductivity. The EIT data were recorded with a Dräger Pulmovista® 500 (Drägerwerk AG & Co., Lübeck, Germany) and analysed with a Dräger SW EITdiag V1.6 (Drägerwerk AG & Co., Lübeck, Germany).
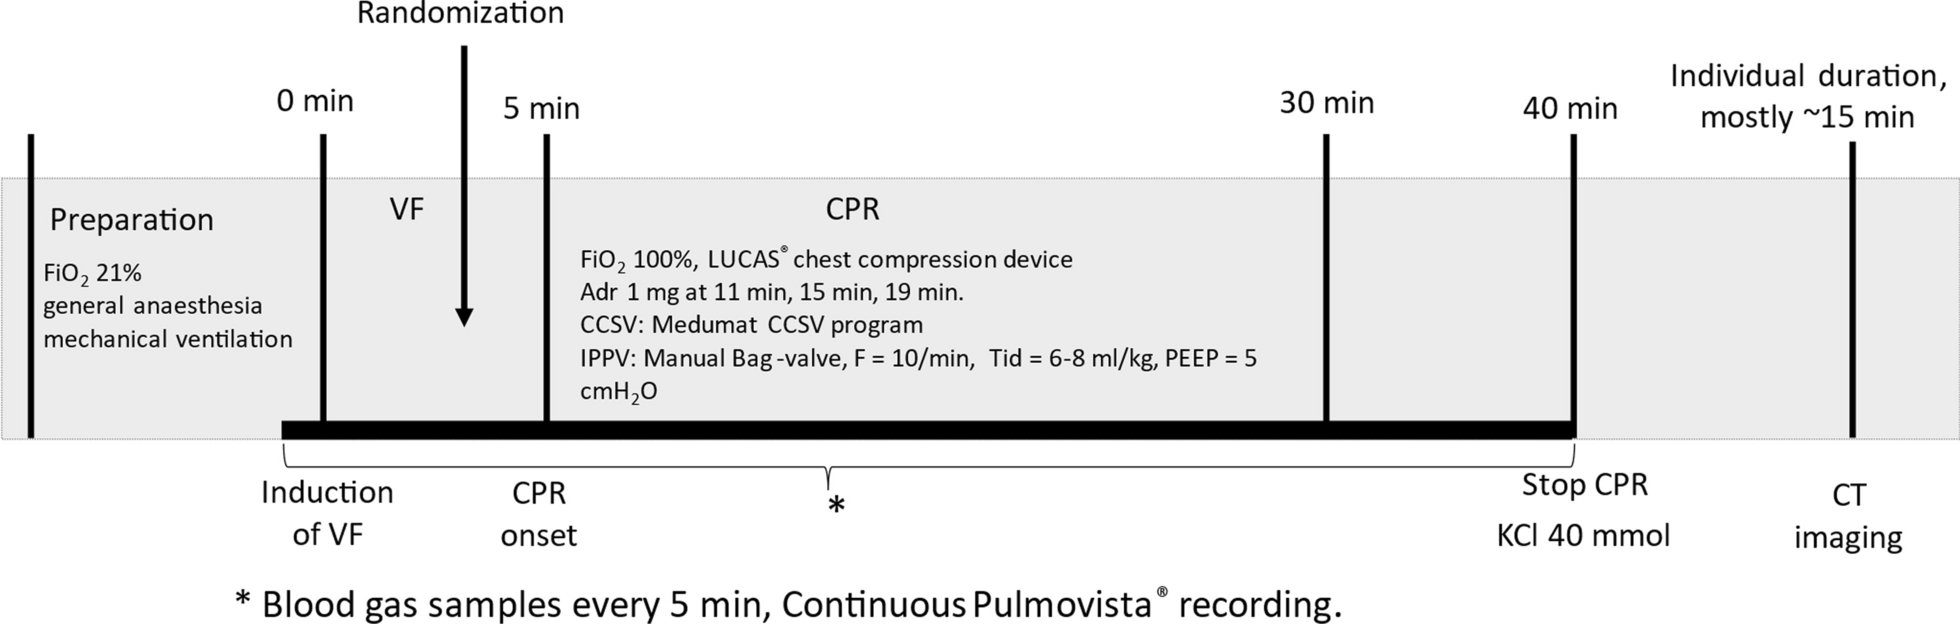
Experimental proceduresFigure 1 presents the experiment timeline. After VF was induced with a 9 V direct current, ventilation and anaesthesia were ceased and the pacing wire was removed. Randomization into the study groups of either CCC or the 30:2 protocol was performed with sealed opaque envelopes during the 5-min hands-off period. In the meantime, a Lucas 2® compression device (Jolife AB, part of Stryker, Lund, Sweden) was set up and the position of the pig was stabilized with a vacuum mattress and a handful of towels within the Lucas 2® arch. Manual bag-valve ventilation (LAERDAL Silicone Resuscitator, Laerdal Medical, Stavanger, Norway) was performed with 100% oxygen, either with a frequency of around 10 min−1 in the CCC group or twice during the compression pause in the 30:2 group, targeting an approximate tidal volume of 500 ml in both groups. The PEEP of 10 cmH2O was adjusted with an Ambu® PEEP valve (Ambu A/S, Ballerup, Denmark). Adrenaline was administered as a 1 mg IV dose at 11-, 15- and 19-min time points. A 20-s recording break from compressions for the EIT was held at the 30-min time point with continuous ventilation in both groups for the duration. Arterial blood samples were collected at 5-min intervals, and a venous sample was also taken at the 30-min time point. Monitoring, NIRS and EIT were recorded continuously through the experiment. The animals were killed with a 40 mmol dose of potassium chloride at the 40-min time point. Simultaneously, the intubation tube was clamped after insufflating the lungs with one full manual ventilation. The post-mortem CT scans were collected in the prone position approximately 15 min after the cessation of CPR.
Fig. 1
Timeline of the experimental protocol. Adr adrenaline, FiO2 fraction of inhaled oxygen, VF ventricular fibrillation, CPR cardiopulmonary resuscitation, KCl potassium chloride, CT computed tomography
Data processingAn illustration of the EIT analysis is provided in Fig. 2. Sections of interest were chosen from the raw recording (baseline, cardiac arrest and 5-min intervals throughout the CPR). The reconstruction settings are provided in Additional file 2. The reconstructed sections were analysed using automated methods provided by the analysis software to create visual slices and quantified data. The global tidal impedance change (dzGlo) was referenced to the 5-min section, except for the 30-min section, which was referenced to the baseline section. The ventral to dorsal (V/D) distribution indices were computed, as illustrated in Fig. 2. A V/D value of 1 represents an equal distribution of ventilation, and a value of 0 means that all tidal change happens dorsally.
Fig. 2
Schematic illustration of the EIT analysis work chart. A The raw dzGlo curve. B The reconstructed sections after filtering. C Visual slices created with the automated analysis scheme from filtered sections. D Visual explanation of the V/D index. BL baseline, dzGlo global impedance change, TID tidal impedance change, CA cardiac arrest, V/D ventral to dorsal
The CT scans were evaluated by a veterinary radiologist (ML) blinded to the intervention group with Osirix MD version 12.5.0 (VetCT, Cambridge, UK). The Hounsfield unit (HU) values were measured from 10 lung slices chosen as described by Reske et al. [18]. The first slice was chosen from the most cranial aspect of the lungs, where both the left and right cranial lobes are visible on the same transverse slice. The most caudal slice was chosen similarly where there was still enough lung on both hemithoraces for segmentation into 2–3 segments, but where the accessory lobe was no longer visible. Eight evenly spaced slices were chosen from between them.
An illustrative figure of HU measurements is provided in Additional file 3. The lung parenchyma was manually delineated separately for the hemithoraces and accessory lobes. The measured mean HU values for each hemithorax, normalized to the area of the delineation, were used to calculate the mean HU of the overall lung. The hemithoraces were also divided into 2–3 ventro-dorsal segments of equal height, and representative HU values of these segments were averaged for the dorsal, middle and ventral HU values without normalization to area. Subjects with more than a mild pneumothorax were excluded from the analysis because of the dislocated anatomy.
Statistical analysis and sample sizeFor the sake of clarity, all variables are reported as medians and interquartile ranges (IQRs), since most variables violated the assumptions of parametric testing. Single comparisons were tested with the Mann–Whitney U test for statistical significance. Comparisons with multiple time point measurements were tested with a linear mixed-effects model and a heterogeneous Toeplitz covariance matrix. The effects of the interventional group, time and interaction between time and the intervention group were included in the model. The values over time were plotted as medians and IQRs.
The sample size was estimated based on arterial blood gas data from Kim et al. [19]. According to their data, a sample size of 30 divided into two equal groups would be sufficient to detect a 20 mmHg difference in PaO2 with a statistical power of 0.80 and an alpha of 0.05.
As an exploratory analysis, we also compared the results of the PEEP zero pigs from our previous study [13] to the PEEP 10 pigs of the current study.
Comments (0)