
Remember me


Two datasets were used in the study. HUP iEEG dataset from the openneuro platform: this dataset contains de-identified patient data from the University of Pennsylvania Hospital, targeting surgical treatments for drug-resistant epilepsy. It included data from 54 subjects who underwent intracranial electroencephalography (iEEG) monitoring using either subdural grids, strips, and depth electrodes (ECoG) or stereotactically placed depth electrodes (SEEG). The electrophysiological data encompassed both the interictal and ictal periods and provided electrode locations in the ICBM152 MNI space. Additionally, the dataset included clinically identified seizure onset channels and channels overlapping with resection/ablation areas determined through meticulous segmentation of the resection cavity. SEEG Dataset from Xuanwu Hospital, Capital Medical University: This dataset consists of SEEG recordings from 29 patients with mesial temporal lobe drug-resistant epilepsy captured during both awake and sleep states following SEEG implantation surgery. This use of these data was approved by the local ethics committee of the Xuanwu Hospital, Capital Medical University, Beijing, China. The ethics committee’s phone, email, and address as follows: 0086-10-83919270, xwkyethics@163.com, and No. 45, Changchun Street, Xicheng District, Beijing 100053, China. All the participants provided written informed consent.
Using the open-source toolkits Brainstorm and EEGLAB, we applied a 0.5–120 Hz bandpass filter and removed 50 Hz and 60 Hz power line interference. We then downsampled the data to 500 Hz (fc = 500 Hz) and performed an interpolation-based reconstruction, reducing the original electrode sampling rate from 2048 to 500 Hz. After feature point calculation, the signal was interpolated and baseline-corrected. Monopolar EEG data were converted to bipolar data, and reference electrodes were removed for global re-referencing to minimize external physical interference affecting the EEG recording accuracy.
Our study filtered HUP iEEG and Xuanwu Hospital SEEG data based on electrode localization and distribution of seizure onset channels. The HUP iEEG dataset was divided into SEEG and ECoG, based on the information provided by the platform. The SEEG data from Xuanwu Hospital were classified based on awake and sleep states and further divided into Generalized tonic–clonic seizures (GtcS) and focal seizures (FS), according to the range and intensity of the seizures. To achieve a comprehensive classification training, multiple data subsets were obtained according to the classification method presented in Table 1. FS (Subset1,2) is the status we focused on, particularly the performance of small-scale focal seizures. GtcS can be included in the SEEG category of the HUP for joint training (Subset3). Finally, all data were normalized and multiple seizure events were concatenated along the same dimension. The SEEG dataset included 64 patients from HUP(35) and Xuanwu Hospital(29), whereas the ECoG dataset comprised 19 patients from HUP. All 29 SEEG cases from Xuanwu Hospital utilized channels containing seizures. In the HUP iEEG dataset, 36 cases included seizure channels, while the remaining 18 cases provided only interictal channel data.
Table 1 Classification of the entire dataset into multiple subsetsThe concatenated EEG data were labeled interictal (0), ictal (1), or pre-ictal (2). All labeled data were saved as single-channel CSV files, with each file containing data from a single channel, including 201 s data points and corresponding feature labels for each point.
Model mechanismFeature vectors and frequency domain analysisThe datasets were sampled at a frequency of 500 Hz with a sequence length of 250, corresponding to a sliding detection window of 0.5 s, with a 50% overlap between each pair of adjacent sequences. The data were reshaped into a three-dimensional feature vector (batchsize, sequencelength, and features) with a potential mapping space. For the EEG data, a single data point had only one possible feature in the epileptic state; therefore, in the initial model input, the feature dimension was set to one.
The additional feature dimensions introduced into subsequent network layers can decompose different signal amplitude components or extract energy from various frequency bands. This enhances the model’s ability to recognize complex dynamic characteristics of epileptic seizures more effectively.
By optimizing the moving-window technique, only half of the spectrum was obtained, and downsampling was performed to reduce the data symmetry. In the actual processing of the network, the frequency-domain distribution of each EEG time series was extracted individually, providing a reliable data source containing more hidden information for high-dimensional analysis in the subsequent convolutional layers (Fig. 2).
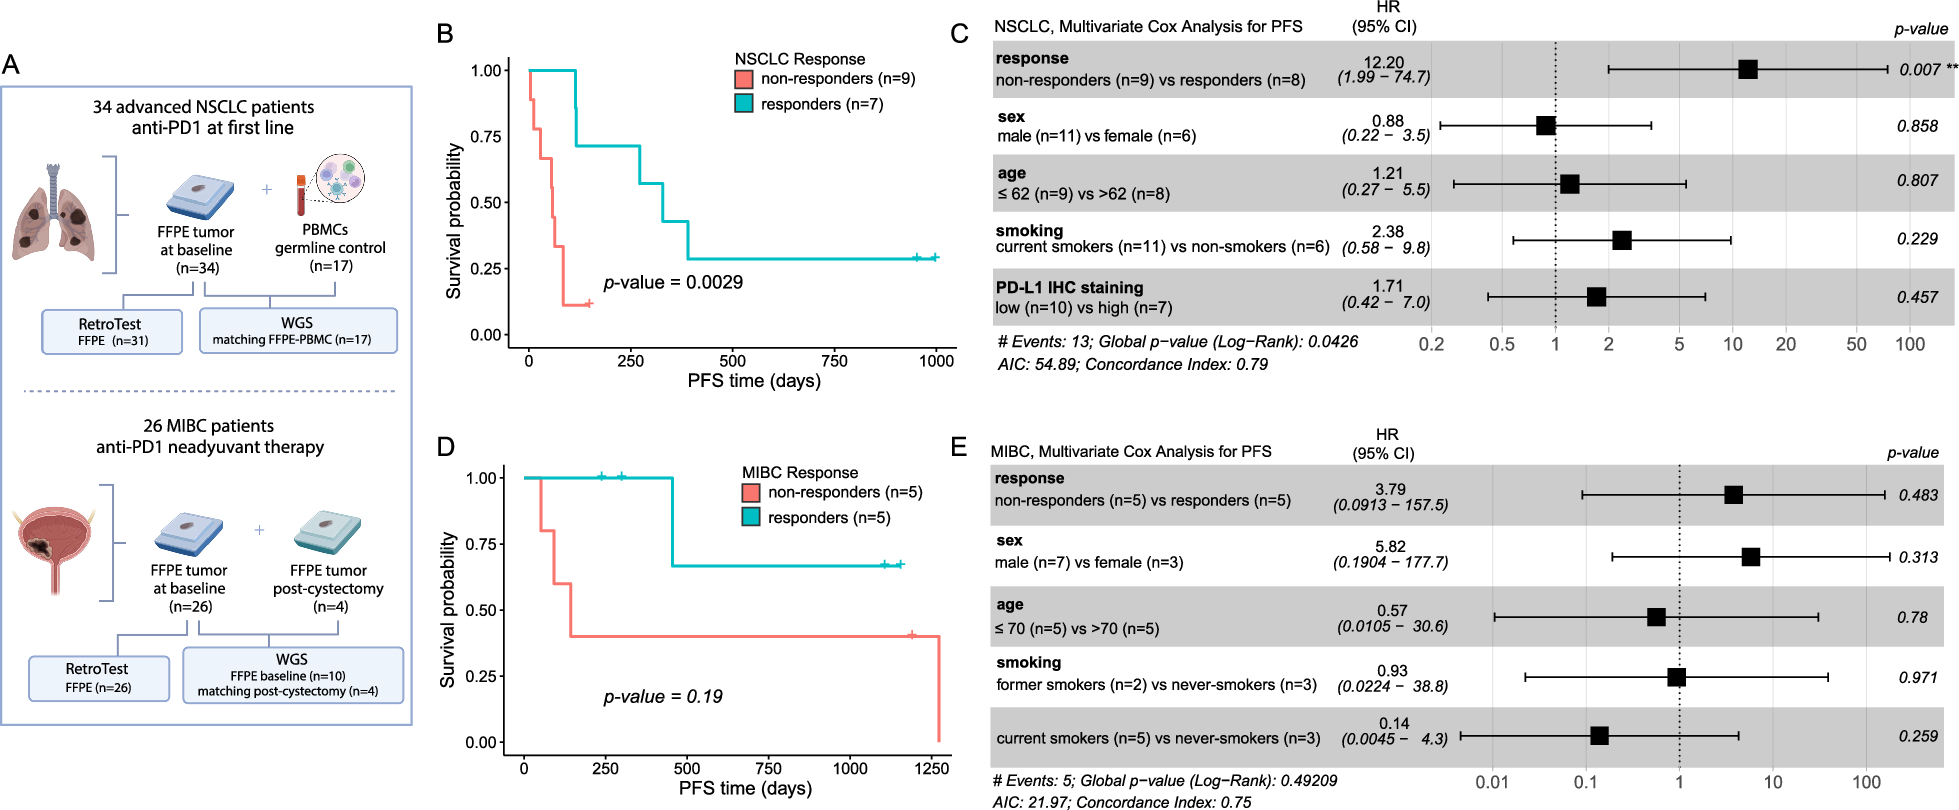
Fig. 2
Time–frequency distribution of 5-s EEG data, corresponding to three different seizure states. Comparative analysis of seizure characteristics between ECoG and SEEG based on time-domain and frequency-domain methodologies. a ECoG amplitude, b SEEG amplitude, c ECoG power spectrum, d SEEG Power Spectrum. As clearly observed from the Fig. 1, there are significant differences in seizure characteristics between SEEG and ECoG data. SEEG seizure characteristics are predominantly distributed in a higher frequency range, and in the pre-seizure state, SEEG exhibits more pronounced fluctuations, with more distinct differences from the interictal state compared to ECoG data. This observation suggests the need for classification-based training on the datasets
Attention-like mechanism in amplitude-aware moduleThe AmplitudeAwareLayer analyzes voltage changes in EEG data points to capture signal amplitude variations by reshaping the data into sequences of a given length. On one hand, this module extracts and calculates the difference between the maximum and minimum values of all EEG data points within each sequence, enabling feature comparison between sequences. At the same time, the module can also learn the differences in amplitude range between FS and GtcS EEG signals at the overall sequence level.
On the other hand, our study introduced a custom ampeak_trough function, designed to capture all local peaks and troughs within each sequence, enabling adaptive selection of key features within the sequence (Fig. 3). First, the irregular raw EEG signal is fitted into a regular pattern by downsampling and then reconstructing it through interpolation as a superposition of cosine functions of varying scales. This process calculates the amplitude differences (diffs) between each pair of adjacent peaks and troughs (based on different predefined parameters) to filter out significant segments with high amplitude (diffs ≥ x \(\upmu\) V) and a duration of at least 50% of the sequence length. The value of x can be arbitrarily set, and when used for feature extraction in the FS, the model can filter locally optimal values for classification based on the overall amplitude information of the EEG time series. Specifically, this method is based on the amplitude of all time points within the EEG sequence. When the value at the upper quartile exceeds 150% of the mean amplitude of the entire sequence, this point is used as a trigger to begin an adaptive local optimization search for the parameter x. Starting from this trigger point, the value of x is adjusted by fluctuating upwards and downwards to determine the local optimal solution that best reflects the key features of the sequence. These high-amplitude and long-duration segments are considered the "key points" of the sequence and are fed back to the amplitude perception module as important features of the sequence. Using GtcS data as the standard, adaptively adjust the coefficients \(_\) and \(_\) for amplitude difference and volatility within the FS dataset. In other words, we can amplify the network’s attention to amplitude features in FS data by adjusting the coefficients accordingly, aiming to achieve the same recognition effectiveness as with GtcS. The specific implementation for finding the optimal solution x is as follows:
$$T\left( x \right) = - \alpha_ \left( \right|}}\mathop \sum \limits_ diffs\left[ i \right] - \frac \right|}}\mathop \sum \limits_ diffs\left[ j \right]} \right) + \alpha_ \left( \left( x \right) + \sigma_ \left( x \right)} \right)$$
(1)
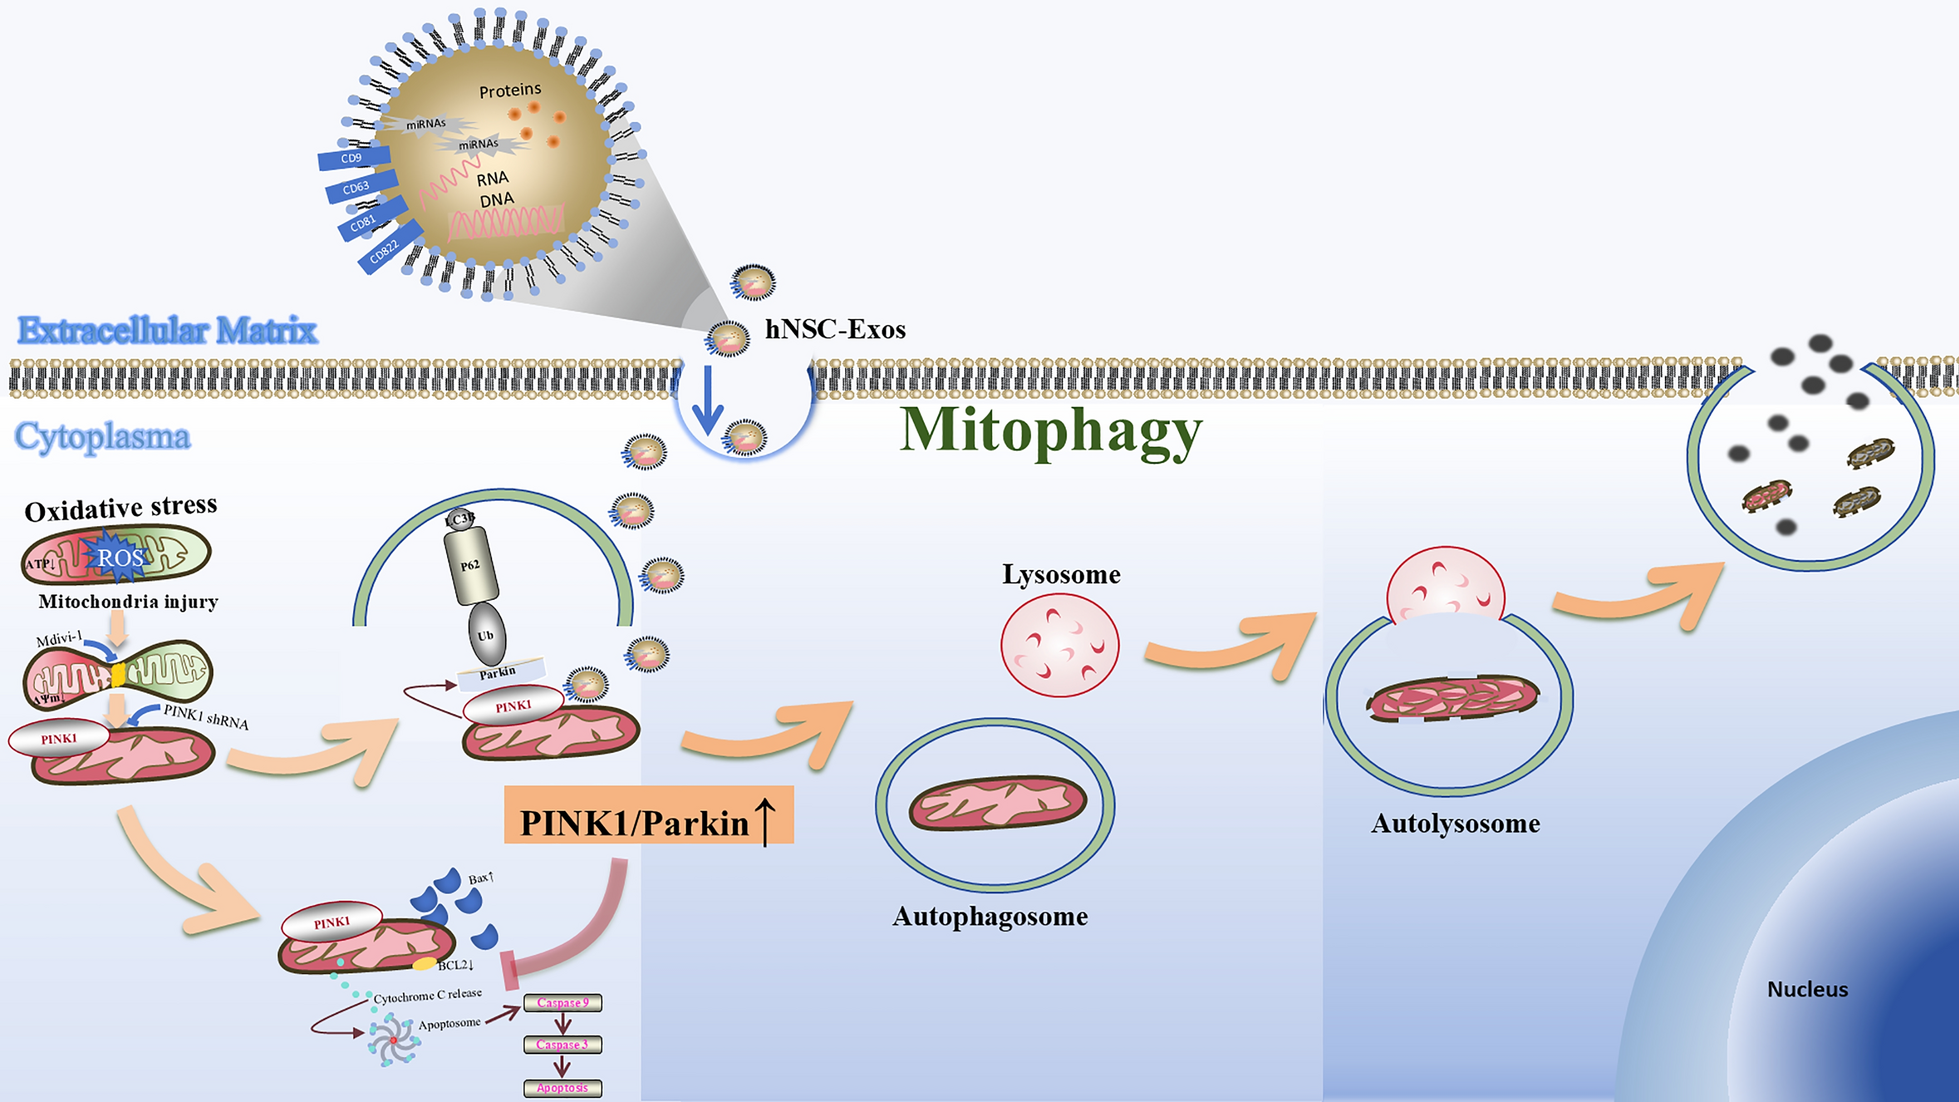
Fig. 3
The calculation and extraction of diffs is based on the difference between the peaks and troughs of a complete waveform. Attention features are added to waveforms that meet specific criteria
Define the objective function \(T(x)\), where \(H(x)\) represents the set of indices for all high-amplitude diffs(\(diffs[i]>x\)), and \(L(x)\) represents the set of indices for all low-amplitude diffs(\(diffs[j]<x\)). \(\left|H(x)\right|\) and \(\left|L(x)\right|\) denote the number of high-amplitude and low-amplitude points, respectively, while \(_(x)\) and \(_(x)\) denote their respective standard deviations. The first term of the polynomial represents the amplitude difference, with \(_\) as its weight coefficient; the second term represents volatility, with \(_\) as its weight coefficient.
$$w_ \left( x \right) = \left\c} & \\ & \\ \end } \right.$$
(2)
An attention mechanism is introduced based on the standard x, assigning weights to the diffs. The upper quartile of the diffs distribution serves as the initial trigger for x. \(_(x)\) represents the weighting function, indicating whether the diffs[i] is classified as a high-amplitude point exceeding the threshold \(x\).
$$\left\l} } = \mathop \limits_ \frac \right) - T\left( x \right)}}} \\ = x_ - \alpha \frac } \right)}}} \\ \end } \right.$$
(3)
\(\frac\) is the gradient of the objective function \(T(x)\), and \(_\) is the threshold value of x at gradient update time step t. Through each update, we can find the optimal x that minimizes the objective function \(T(x)\), which serves as the threshold that most effectively distinguishes between high-amplitude and low-amplitude points.
This mechanism effectively guides the “attention” of the network toward signal segments that exhibit prominent amplitudes and durations, thereby achieving a dynamic focus on key features. Filtering the significant features enhanced the overall perceptual ability of the model.
Additionally, this module uses two fully connected layers to further process the extracted features, capturing complex relationships and high-dimensional information among them. The first layer provides nonlinear transformations to enhance feature representation, while the second layer performs dimensionality reduction and generates the final feature vector for subsequent classification or regression tasks. The fully connected layers use the Adam algorithm for gradient descent and updates of the weight matrix W and deviation vector b according to the model's macro definition. Below are the parameter update equations:
$$\begin g_^ = \nabla_ J\left( } \right) \hfill \\ g_^ = \nabla_ J\left( } \right) \hfill \\ m_ = \beta_ \cdot m_ + (1 - \beta_ ) \cdot g_ \hfill \\ v_ = \beta_ \cdot v_ + (1 - \beta_ ) \cdot g_^ \hfill \\ \widehat_ = \frac }}^ }} \hfill \\ \widehat_ = \frac }}^ }} \hfill \\ W_ = W_ - \frac_ + \epsilon } }} \cdot \widehat_^ \hfill \\ b_ = b_ - \frac_ + \epsilon } }} \cdot \widehat_^ \hfill \\ n = 1,2,3, \ldots \ldots ,511512 = batch\_size \hfill \\ \end$$
(4)
where \(_^\) is the gradient of weights \(_\), and \(_^\) is the gradient of biases. \(_\) is the first moment estimate,\(_\) is the decay factor, and \(_\) is the second moment estimate,\(_\) is the decay factor.\(}_\) and \(}_\) are the bias-corrected moment estimates. \(\eta\) is the learning rate, and \(\epsilon\) prevents division by zero.
Network moduleCNN_RESAfter the introduction of multi-scale CNN, increasing the depth of deep convolutional neural networks did not significantly improve their expressive power and led to vanishing or exploding gradients. Due to the low signal-to-noise ratio and nonlinear nature of EEG signals, layer-by-layer feature extraction can weaken or lose important information related to the original input. In this study, we implemented a CNN-RES module that combines convolutional layers with residual neural networks to enhance the ability to extract high-frequency features from EEG signals, particularly high-frequency spikes and sharp waves, during epileptic seizures (Fig. 4).
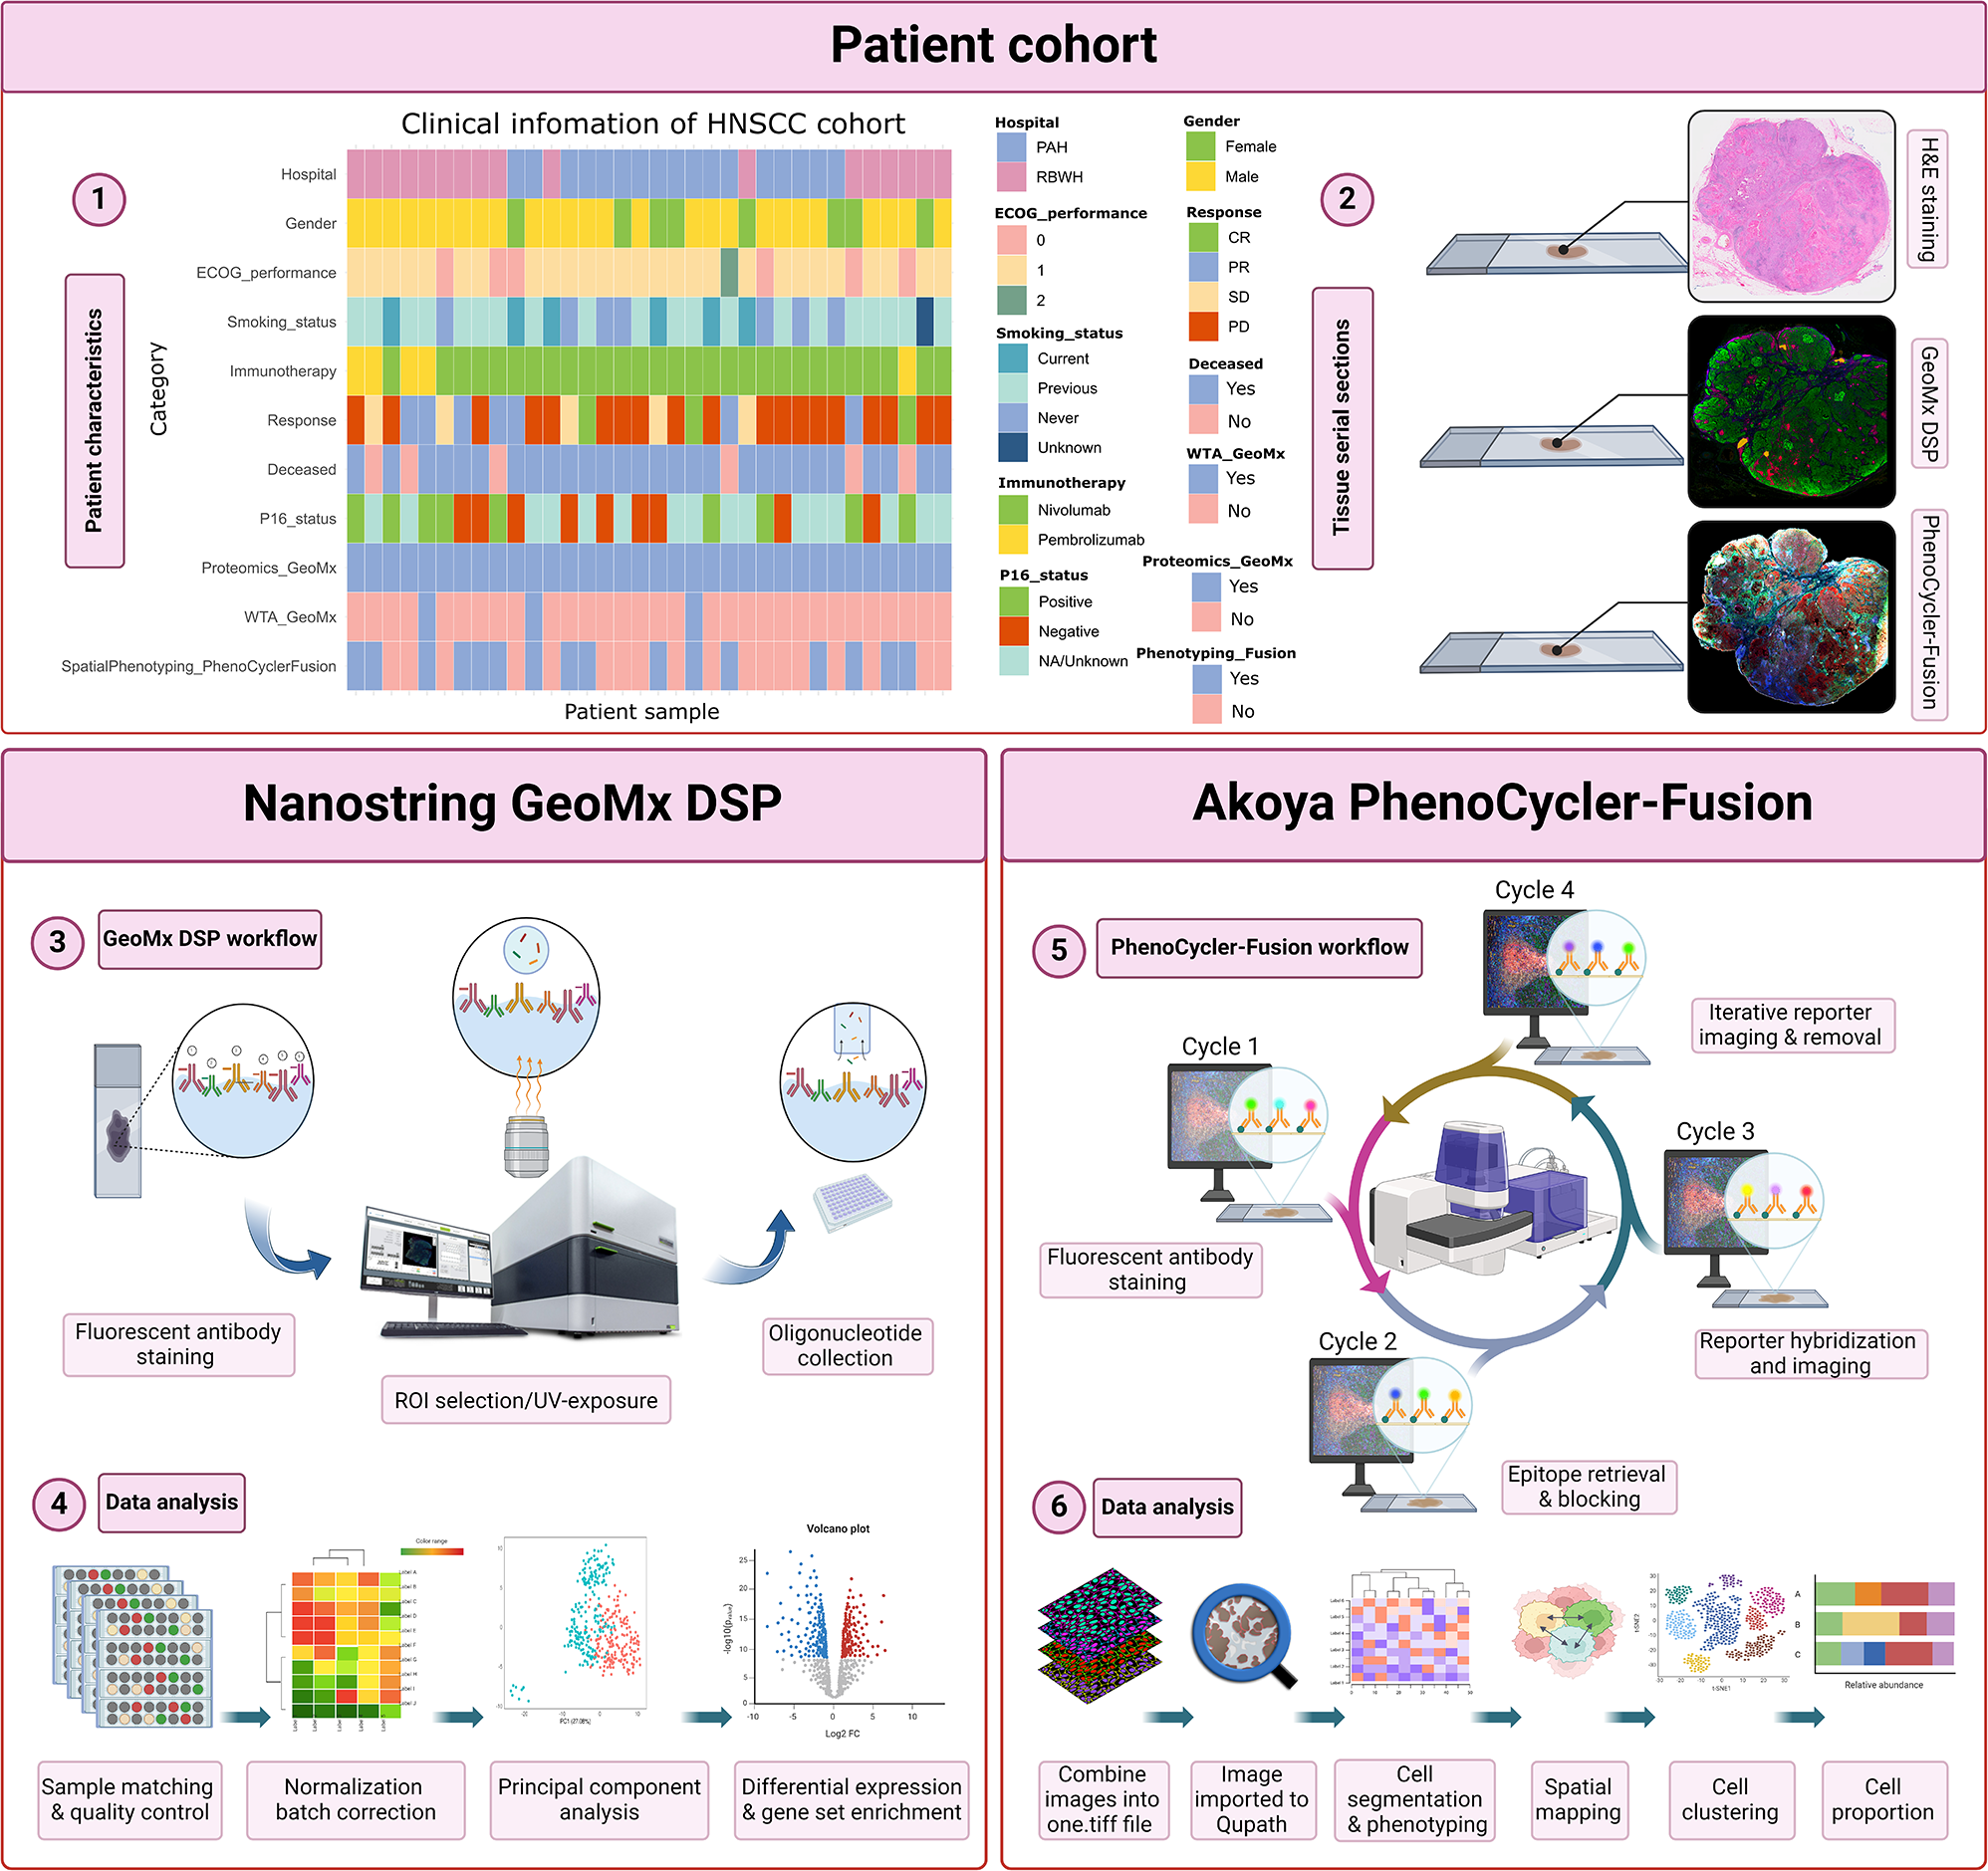
Fig. 4
Construction of the EEG feature sequence, integrated with a CNN-RES network framework flowchart based on outputs from the FFT module
The architecture is designed to process frequency-domain data while maintaining the ability of the model to capture both high-dimensional and subtle features. After the FFT module output, traditional methods using three consecutive convolutional layers with adaptive sizes can capture the EEG frequency-domain information. However, most of these features were concentrated in the lower-frequency steps (the first route in Fig. 5). In other words, the convolutional layers missed important high-frequency dimensions in the EEG, whereas the seizure characteristics were mainly concentrated in spikes and sharp waves above 40 Hz. This results in the model failing to extract useful features for classification with minimal changes compared to the original input data. If the number or size of the convolutional layers is further increased, this would significantly increase the processing time and risk gradient explosion in high-dimensional spaces.
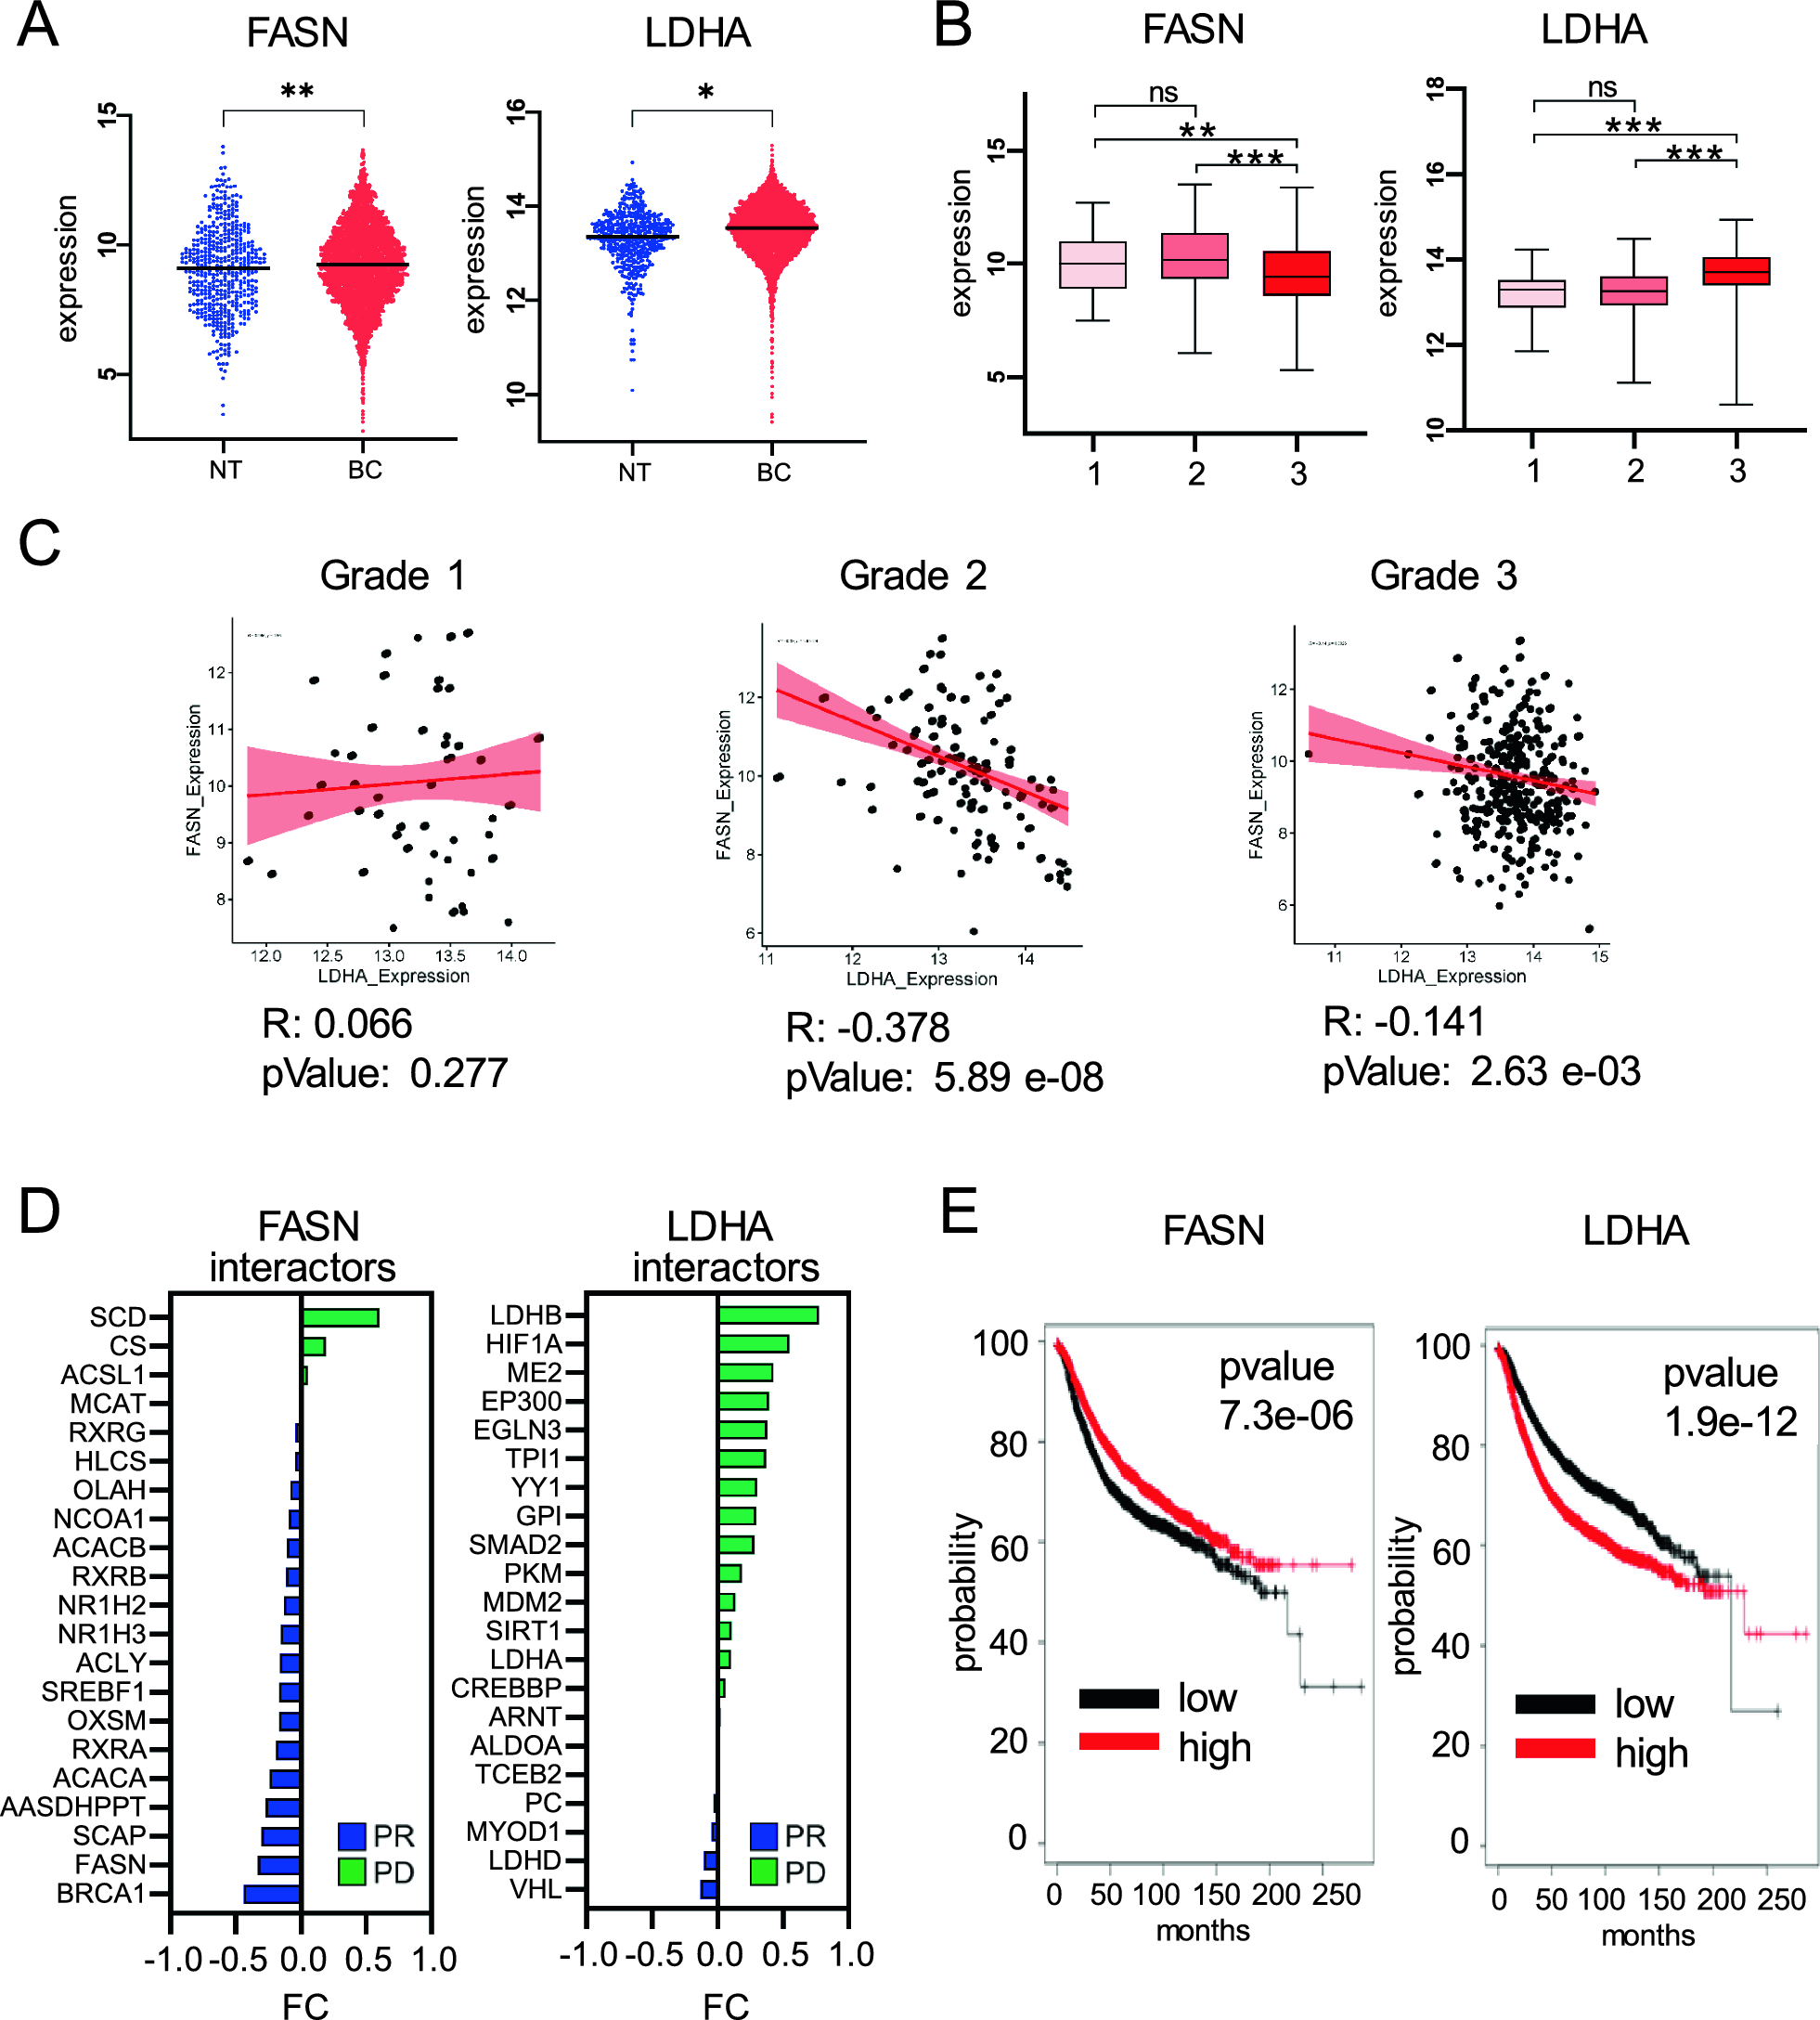
Fig. 5
The three-dimensional feature topography in the convolutional layers is composed of frequency steps, channel counts, and activation values. It encompasses a comparison of the three-layer convolution process and the CNN-RES feature extraction performance. (1) [conv1-conv2-conv3] (2) [conv1-conv2-RES2] (3) [conv1-RES1-RES2]
The CNN-RES module replaces the last two convolutional layers with consecutive residual blocks that fuse at multiple scales. Each residual block consisted of two consecutive 1D convolutional layers with kernel sizes of 3 × 3 and 5 × 5, each with a stride of 1. The first residual block increases the 32 feature dimensions of the frequency-domain EEG data output from the external convolutional layer to 64, whereas the second residual block further increases this to 128. Each convolutional layer was subjected to batch normalization and ReLU activation was applied. To prevent overfitting, a dropout layer with a dropout rate of 0.5 is added after each convolutional layer. In addition, a residual connection is achieved through a 1 × 1 convolution kernel, which adjusts the number of channels when the input and output channels differ, thereby ensuring the correctness of the residual addition. This ensures no loss of the original input data features and improves the potential ability of the module to distinguish high-frequency features from low-frequency ones.
The second and third routes in Fig. 5 represent the process of gradually replacing the convolutional layers with residual blocks. It shows how the feature distribution across different channels affects the module output and final classification performance, and how multiscale fused residual blocks capture high-frequency components in more detail. Res1, serving as an intermediate module, plays a transitional role in skip connections between the original convolutional layer and the residual blocks. The combined output of Conv1 and Res2 is necessary to achieve an optimal classification performance for both low- and high-frequency components. The primary performance improvement of Res2 in the third route is based on the enhancement of Res1, converting the activation values of discrete high-frequency signal components in the second route Res2 into continuous high-frequency regions, which demonstrates their capacity to extract high-frequency information from EEG signals, highlighting the impact of feature distribution across different channels on the output of the module and the final classification performance.
Pre-policy networkA policy network was integrated into the preprocessing architecture before the main model RNN input, enabling time-domain decision-making and analysis of the raw EEG data (Fig. 6). The policy network evaluates each time step in each sequence within a batch using LSTM. The hidden temporal information between time steps is mapped onto 128 related dimensions, and the output is mapped to probabilities, indicating whether to process the input via a linear decoder. These decision probabilities, which act as gating signals, determine whether the input data are forwarded to the main model.
Fig. 6
The pre-policy network architecture enhances data prior to the RNN input gate, integrating loss functions to train using a reward mechanism
A reward mechanism is introduced through a softmax layer that generates the probability of processing at each time step. This mechanism trains the policy network by rewarding improvements in the performance of the main model, converting Boolean masks into integer indices, and calculating the average log probability of the decision outputs as the loss function. This allows the policy network to self-adjust and optimize the overall model performance. Specifically, if skipping certain time steps leads to more accurate predictions or reduced losses, the policy network receives positive feedback. Conversely, if it erroneously skips important time steps, the network is penalized. This feedback-based training method integrates policy loss as a “true reward,” enabling the policy network to self-adjust over time, thereby optimizing the entire model. In addition, if the policy network is disabled, all data are passed to the main RNN without affecting the overall network training or operations.
The LSTM output On is mapped to the probabilities of the two actions \(_\) for each sequence using the decoder, as described by the following equation:
$$\begin O_ = LSTM\left( ,h_ } \right) = \sigma \left( \cdot \left[ ,x_ } \right] + b_ } \right) \hfill \\ P_ = Softmax\left( \cdot O_ + b_ } \right)_ = \frac \cdot O_ + b_ } \right)_ }} }} e^ \cdot O_ + b_ } \right)_ }} }} \hfill \\ \end$$
(5)
\(_\) and \(_\) are the output weights and deviation of the decoder, \(_\) is the hidden state of the previous time step in the same batch, and \(^_\bullet _+_)}_}\) is the exponent of \(_\bullet _+_)}_\), with j iterating overall output class indices.
The loss function used for training the pre-policy network is shown as follows:
$$L\left( \theta \right) = - E\left[ }^ \alpha \cdot R_} \cdot log\pi \left( \left| } ;\theta } \right.} \right) + \beta \cdot R_} \cdot log\pi \left( \left| } ;\theta } \right.} \right)} \right)} \right]$$
(6)
\(\theta\) represents the network parameters, \(_\) and \(_\) represent the performance feedback rewards from the main model on the FS and GtcS data subsets, respectively; \(T\) denotes the sequence length, set to 250; \(\alpha\) and \(\beta\) are the weighting coefficients for the FS and GtcS datasets, assigning different weights to different data subsets; \(log\pi (_\left|_;\theta )\right.\) represents the logarithm of the average decision probability at each time step.
Channel training combined with SVMCompared to CNN ensemble models, which require large amounts of data for training, SVM often perform better on small-sample datasets. Although SVM training can be time consuming, particularly when tuning parameters and applying kernel functions, once trained, SVM offers a considerably fast prediction speed. This is a significant advantage for applications requiring rapid real-time responses that align well with the demands of closed-loop neurostimulation systems.
Based on this, we introduce SVM as a supplemental reinforcement training channel to improve the performance of small-sample data with low classification accuracy (where the single-channel validation accuracy is below 80%). By loading a pretrained feature-extraction model into the SVM network, the features were extracted and stored along with their corresponding labels. A pipeline that included both Standard Scaler and SVC was created, and GridSearchCV was used to determine the optimal SVM parameters. This process was completed by specifying a parameter grid and applying a five-fold cross-validation strategy with defined scoring criteria.
For the parameter grid, c serves as the regularization parameter that controls the penalty strength during model training. The gamma parameter (kernel function parameter) was applied to the radial basis function (RBF) and polynomial (poly) kernels. A smaller gamma value extends the range of influence of each data sample, resulting in a smoother decision boundary. For the SVM network in this study, two parameter options were provided and a one-versus-one decision function was used for the three feature labels, expressed as follows:
$$S^ = \frac\mathop \sum \limits_^ \left[ - \overline} \right]^$$
$$gamma_ = `scale} = \frac \right] \cdot S^ }}$$
$$gamma_ = `auto} = \frac \right]}}$$
$$K\left( \right) = e^ \right\|^ }}$$
$$f\left( x \right) = sgn\left( ^ \alpha_ \cdot Lable\left[ i \right] \cdot K\left( \right) + b} \right)$$
(7)
where \(x\) represents the feature vector input to the SVM (40,000 dimensions corresponding to the output from the fully connected layer of the feature extraction network). The parameters \(_\) and \(b\) are the decision network learned parameters, while \(x[i]\) and \(Lable[i]\) refer to the support feature vectors from the input that influence the SVM decision and their corresponding labels. \(K\) is a kernel function that is crucial in mapping the input data to a higher-dimensional space. This mapping enables the SVM to handle nonlinearly separable datasets effectively, thereby facilitating the search for an optimal hyperplane that maximally separates different classes.
Evaluation metricsConfusion matrixTo evaluate the prediction performance of the model for each label, we calculated a confusion matrix based on the model results for the test set. The confusion matrix derived from the three-class classification results of the model formed a 3 × 3 matrix, as shown below:
$$Confusion\;matrix = \left( c} } & } & } \\ } & } & } \\ } & } & } \\ \end } \right)$$
(8)
where the element \(_\)(True Positives) represents the number of instances correctly predicted as category i. \(_\)(False Positives) represents the number of instances where the actual category is i, but they are incorrectly predicted as j. \(_\)(False Negatives) represents the number of instances where the actual category is j, but they are incorrectly predicted as i.
Deviation rateThe deviation rate is a metric used to measure the overall deviation in the model recognition of seizure state intervals. In this study, when the model predicted five consecutive labels of 2, the pre-seizure state was considered to have begun, and the sequence containing the first label 2 (0–2) was identified as the predicted pre-seizure onset sequence. Similarly, when transitioning from the pre-seizure state to a full seizure (2–1), the sequence containing the last label, 1, was identified as the predicted termination of the pre-seizure state and the onset of the seizure.
$$\begin Deviation_ = \frac - XT_ }} - XT_ }} \times 100\% \hfill \\ Deviation_ = \frac - XT_ }} - XT_ }} \times 100\% \hfill \\ \end$$
(9)
deviation0-2 represents the deviation rate of the pre-seizure onset sequence, where \(_\) indicates the model-predicted position of the pre-seizure onset sequence, and \(_\) represents the actual position of the pre-seizure onset sequence. deviation2-1 refers to the deviation rate of the pre-seizure termination sequence, where \(_\) indicates the model-predicted position of the pre-seizure termination sequence, and \(_\) represents the actual position of the pre-seizure termination sequence.
Comments (0)