Chemicals
Tamoxifen was purchased from Sigma-Aldrich (Schnelldorf, Germany, #T2859), omeprazole from Selleck Chemicals (Houston, TX, USA, #S1389), and oxamate from Selleck Chemicals (#S6871).
Cell culture
MCF-7 (HTB-22),MCF-7 TamR (CRL-3435), MDA-MB-231 (HTB-26), and MCF-10A (CRL-10317) cell lines were purchased from ATCC (Milan, Italy). Both cell lines were grown in DMEM (Euroclone, #ECB7501L), supplemented with 10% heat-inactivated fetal bovine serum (Sigma-Aldrich, #F7524), penicillin–streptomycin mix respectively used at 100 U/mL and 100 μg/mL (Euroclone, #ECB3001D), 250 ng/mL amphotericin B (Euroclone, ECM0009D), and 2 mM l-glutamine (Euroclone, ECB3000D). MCF-7 TamR cells were cultured with the addition of 10–7 M 4-OH Tamoxifen (Sigma-Aldrich, #68,392–35-8). Cultivation parameters were: 37 °C with 5% CO2. Cells analyzed for mycoplasma contamination with EZ-PCR Mycoplasma Test Kit (Biological Industries, #20–700-20).
Cell lysis and Western blot
Firstly, cell pellets extraction was assesed as described in [26]. Then, cell extract (30 μg) was loaded on 8% and 10% polyacrylamide gels for electophoretic separation and then trasferred on nitrocellulose membranes. Immunoreactive signals were detected with horseradish peroxidase-conjugated secondary antibodies (Bio-Rad, anti-rabbit, #1,705,046, anti-mouse, #1,706,516) and chemiluminescence signals were developed upon ECL (Clarity Western ECL Substrate, 500 ml #1,705,061). Primary antibodies: FASN (#C20G5), LDHA (#C4B5), and GAPDH (#D16H11) from Cell Signaling Technology. Tubulin (#sc-5286) from Santa Cruz Biotechnology. Antibodies were used following the data sheet protocol. ImageJ software (version 1.44) was used to conduct semi-quantitative analysis.
Cell viability assay
Cell viability in MCF-7 and MCF-7-TamR cell lines was assessed using thiazolyl blue tetrazolium bromide (MTT; Sigma-Aldrich, #57,360–69-7) according to the manufacturer’s instructions. Cells seeded at a density of 4 × 10³ cells/well in a 96-well plate. The following day, they were treated with omeprazole and oxamate. Omeprazole was used at final concentrations of 1–5-10–25-50 μM for 24, 48, and 72 h. Oxamate was used at final concentrations of 0.5–1-5–10 mM for 24, 48, and 72 h. In MDA MB-231 and MCF-10A omeprazole and oxamate were tested respectively to 50 μM and 5 mM for 24, 48, and 72 h. Experiments were performed in triplicate and repeated three times. Absorbance values were measured at a wavelength of 570 nm using a Infinite M-plex (Tecan, 30,190,085).
Cell cycle analysis
2 × 10⁵ cells/mL of MCF-7 and MCF-7 TamR cells were treated with omeprazole 50 μM and oxamate at 5 mM for 24 h and then collected, washed with PBS, and suspended in 500 μL of hypotonic solution (1X PBS, 0.1% sodium citrate, 0.1% NP-40, RNAase A 0.1 mg/ml, and 50 mg/mL PI). The percentage of cell cycle stages were acquired using a BD FACS Celesta Flow Cytometer (BD Biosciences) and analysed for Diva Software. Experiments were performed in triplicate.
Cell death analysis
MCF-7 and MCF-7 TamR plated at a density of 2 × 10⁵ cells/mL and then treated with omeprazole 50 μM and oxamate at 5 mM for 24 h. After the treatment, cells were collected, washed two times with PBS, and resuspended in PI buffer (0.2 μg/μL PI, PBS 1X). Cell death analysis was assessed by examining the hypodiploid sub-G1 peak and assessing PI incorporation in live cells to determine DNA fragmentation as an early apoptotic event and membrane permeabilization of dead cells as a late apoptotic event, respectively by using FACS Celesta flow cytometer (BD Biosciences). Experiments were performed in triplicate.
Colony formation assay
MCF-7, MCF-7 TamR, MDA MB-231 cells plated at a density of 1 × 10³ cells/well in a 6-well plate. The next day cells were treated with omeprazole and oxamate at 50 μΜ and 5 mM, respectively, for 96 h. Subsequently, cells were cultured for a time over 7 days in a drug-free medium. Then crystal violet was used to stain colonies, and quantification was carried out by dissolving crystal violet with 10% acetic acid. Absorbance values were read at 595 nm (n° replicates = 4) using Infinite M-plex (Tecan, 30,190,085). Statistical significance calculated using the unpaired t- test.
Trans-well assay
MCF-7 and MCF-7 TamR cells plated at a density of 2 × 10⁴ cells per well in a 24-well plate. The following day, the cells were treated with omeprazole and oxamate at concentrations of 50 μΜ and 5 mM, respectively, for 48 h. After treatment, cells have been collected, counted and seeded (1 × 10⁴ cells) in transwell cell plate as described in [27]. Migrated cells in the lower surface of the membranes were fixed and stained with crystal violet. Then migrated cells have been visualized under microscope at 20× magnification and pictures acquired for rapresentative images.
Cellular mitochondrial stress and glycolytic rate assay
Metabolic status was investigated on a Seahorse XF96 Analyzer (Agilent Technologies, Santa Clara, CA, USA). Mito Stress Test Kit (Agilent Technologies, #103,015) was used as previously reported in [26] and Glycolytic rate assay kit (Agilent Technologies, #103,344–100) was according to the Agilent protocol. Briefly, 8 × 10³ cells were plated 24 h prior to analysis and then treated with omeprazole at 50 μM and 5 mM oxamate for 6 h. The steps for incubation, medium replacement and loading into XF96 Analyzer and injection were performed according to protocol. For Glycolytic rate assay the injection sequence was programmed as reported in the Agilent detailed protocol. Data were analyzed with Wave software version 2.2.0 (Seahorse Bioscience, Agilent Technologies). Experiments were performed in triplicates. Statistical significance was calculated using the unpaired t-test and reported as p-value. Standard deviations reported as error bars.
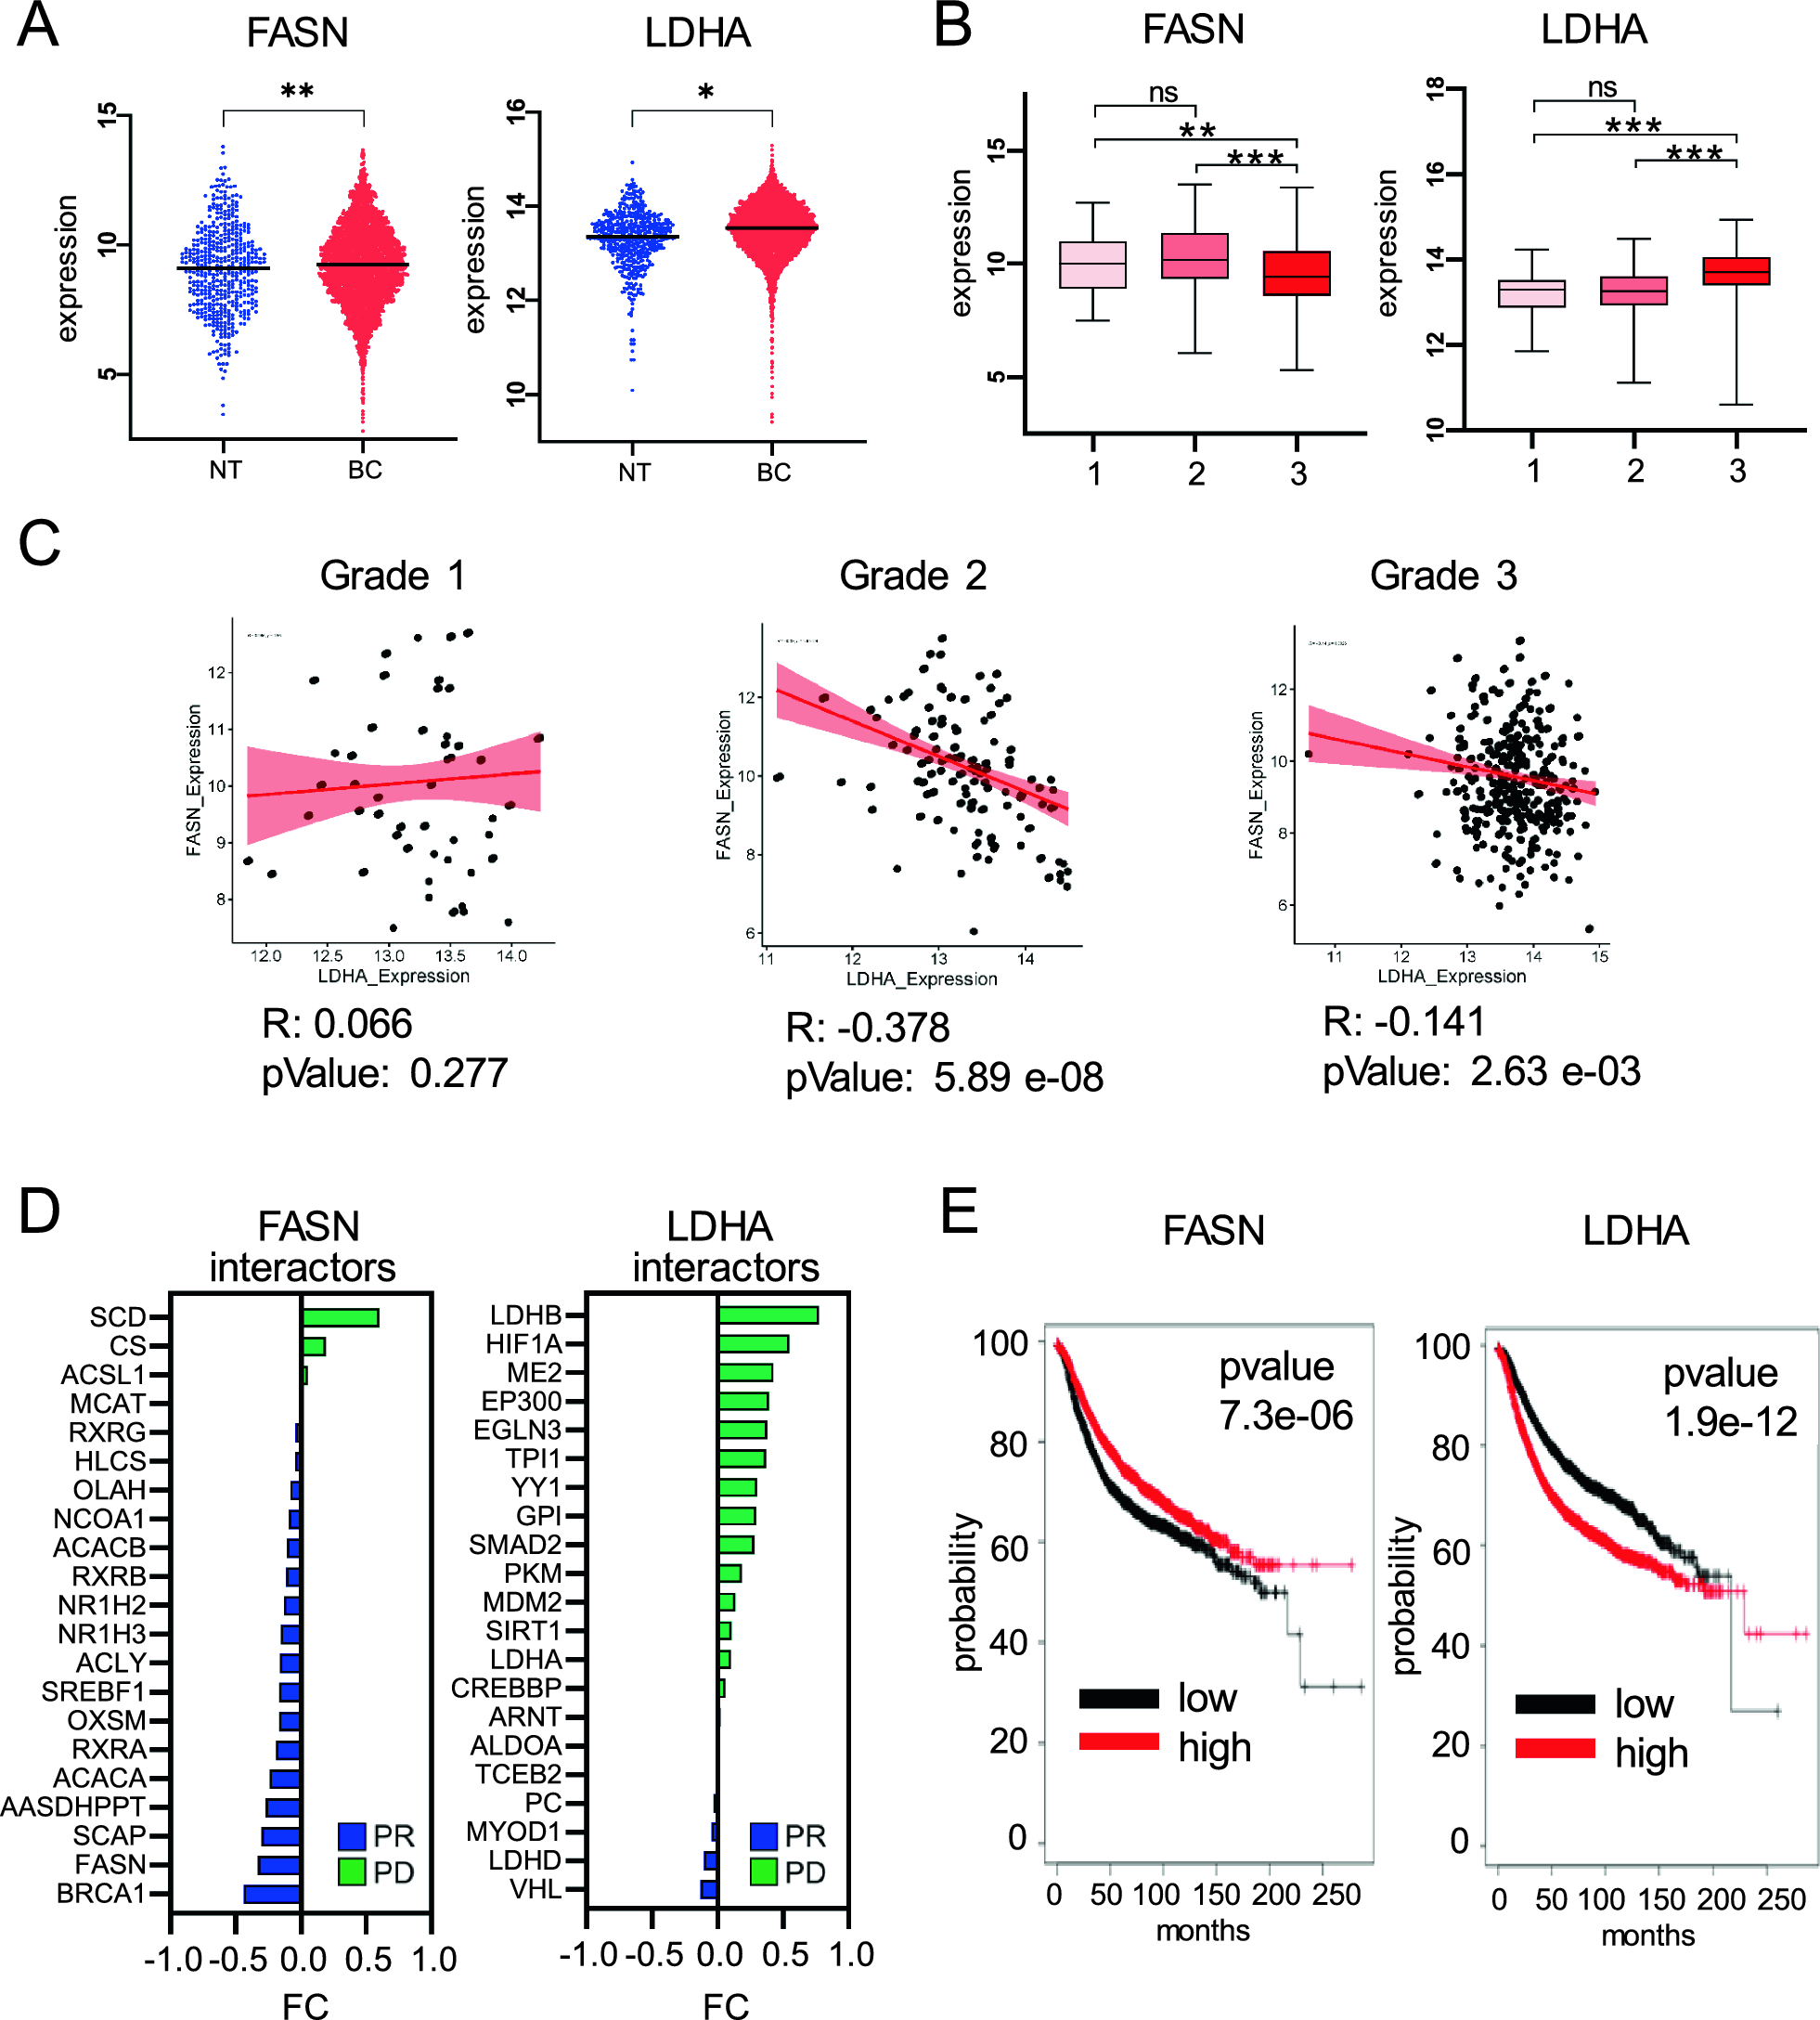
Exploration of FASN and LDHA gene expression in normal and BC tissues
Microarray gene expression across normal tissue (NT) and BC downloaded from NCBI (https://www.ncbi.nlm.nih.gov/ by using GEOquery version 2.70.0 [28] as R package in Rstudio version 4.3.3 (http://www.rstudio.com/). Statistical significance calculated using the unpaired t- test. Full list of GSE datasets and samples used in the analysis are provided in Supplementary Table 1. Normalized expression was used to evaluate FASN and LDHA expression in NT and BC condition. Then FASN and LDHA expression was associated to tumor grading. The comprehensive list of GSE datasets and corresponding samples, which report tumor grade and were utilized in the analysis, is provided in Supplementary Table 2.
Identification of mutations and predictive score
cBioPortal [29] was used to explore SNP mutations, structural variant, amplification, deletion, allele frequency of FASN and LDHA using the search term FASN/LDHA in BC from TCGA PanCancer Atlas Studies. PolyPhen-2 (http://genetics.bwh.harvard.edu/pph2/index.shtml) is a web-accessible resource used for prediction of functional effects of human SNPs. Full list of data are provided in Supplementary Table 3.
Survival analysis
The association between FASN and LDHA expression, and patients survival was conducted utilizing the Kaplan–Meier Plotter [30]. FASN and LDHA expression was used to divide BC patients in quartiles. The high group comprises samples with gene expression values equal to or greater than the 75th percentile value, while the low group with less than the 75th percentile value. Full list of GSE datasets used as input for the analysis are provided in Supplementary Table 4.
FASN and LDHA expression in sensitive and insensitive condition.
RNA-seq and microarray transcriptomic analysis downloaded from NCBI (https://www.ncbi.nlm.nih.gov/) by using GEOquery [28]. GSE111151, GSE131276, GSE125738, GSE106681, GSE115737 datasets were used to evalute normalized expression for FASN and LDHA, and their correlation upon sensitive and insensitive condition to tamoxifen.
FASN and LDHA in positive and negative outcome of BC patients
Expression of FASN, LDHA, and their interactors in partial remission (PR) and progressive disease (PD) condition, respectively as positive and negative outcome was provided from microarray dataset GSE82172. Differential expression analysis was estimated comparing PD against PR group and showed as foldchange. Data have been analyzed with GEOquery [28] and limma version 3.42.2 10 [31] as R package. For RNA-seq data, DESeq2 [32] using R was used to compare gene expression across sample subgroups, we employed the DESeq2 package, utilizing a negative binomial model for detecting differentially expressed genes (DEG) from count data.
Analysis of protein–protein interactions and functional protein partners
STRING (https://string-db.org/) was used for protein–protein interaction analysis and to determine the top20 functional protein partners of FASN and LDHA, ranked for score. Full list of FASN-LDHA interactors are provided in Supplementary Table 5.
Correlation analysis
Pearson correlation was evaluated using GraphPad Prism version 8.3.0.
Patients’ enrolment, ethics approval and consent to participate
The study encompassed a cohort of 104 patients diagnosed with BC. Formalin-fixed, paraffin-embedded tissue blocks from surgical cases between 2014 and 2022 were chosen from Pathology Laboratory. The cohort includes 52 luminal cases, 10 of them exhibiting HER2 overexpression, and 42 categorized as triple negative. The patients’ characteristics are reported in Supplementary Table 6. The study received approval by the Ethics Committee of University of Campania “Luigi Vanvitelli” (protocol 384/2019) and of IRCCS Pascale (Protocol 57/2021) before the beginning of the study, in accordance with the code of Ethics of the Declaration of Helsinki.
Tissue array
Haematoxylin and Eosin (H-E) stained slides were prepared from original paraffin blocks and analysed for BC diagnosis. The Tissue Microarray (TMA) was designed by selecting the most representative areas, as determined by the pathologist. For each block, two tumor cores and one healthy tissue core, each measuring 1.00 mm, were precisely positioned in a donor block using the GALILEO TMA CK2500 semi-automated instrument.
Immunohistochemistry
The tissue array was prepared using the following steps: deparaffinization in xylene, hydration in graded alcohol, and antigen retrieval in retrieval buffer containing EDTA (pH 8.0) at 100 °C. This was followed by a 15-min incubation with 5% H2O2. A 5-min protein block was then performed using 5% BSA in 1 × PBS. Subsequently, the slides were incubated for 1 h with rabbit monoclonal anti-human antibody FASN (dilution 1:200) and mouse monoclonal anti-human antibody LDHA (dilution 1:650). The corresponding horseradish peroxidase (HRP)-conjugated secondary antibodies were then incubated for 40 min at room temperature, followed by visualization with diaminobenzidine (DAB) reagent. Tissue array slides were subsequently stained with haematoxylin and coverslipped for microscopic evaluation. To validate the array results, staining was replicated on a cohort of 38 whole-section blocks. The density of FASN and LDHA staining was assessed both by an experienced pathologist and through digital image analysis. Immunostaining values were reported as the percentage of positive cells. The percentage of positive cancer cells in each sample was determined by counting the number of positive cells over the total number of cancer cells in ten non-overlapping fields at 40 × magnification. Slides were scanned and photographed using the Aperio Scanscope CS (Aperio Technologies®, USA). Statistical significance calculated using the unpaired t- test.
Metabolites and lipids extraction
For metabolites and lipids extraction 1 × 10⁶ cells were plated in 6-well plates,and then treated for 24 h with omeprazole 50 μM and oxamate 5 mM for 24 h. Cells were washed twice with 1 mL of ice-cold PBS per well. Then, 500 μL of cold cell extraction solution (80% methanol/20% water, v/v) was added to each well. The cells were scraped off using a cell scraper, snap-frozen in pre-chilled tubes, and stored in a − 80 °C freezer. For metabolome and lipidome extraction, 225 µL of ice cold MeOH containing a mixture of deuterated standards were added to cell pellets (1 × 10⁶ cells) and incubated at − 30 °C for 1 min and, subsequently, put in a sonic bath for 10 min. After adding 750 µL of ice-cold MTBE, samples were re-incubated in a Thermomixer (Eppendorf) for 1 h × 4 °C × 550 rpm. Afterward, 188 µL of H2O was added to the samples. Following centrifugation at 4 °C and 14,680 rpm, the lower and upper phases were separately collected and dried using a SpeedVac (Savant, Thermo Fisher Scientific).
Metabolomics and lipidomics analysis
Metabolomics analyses were conducted using a Vanquish Flex UHPLC coupled online to a Exploris 120 hybrid quadrupole Orbitrap mass spectrometer (Thermo Fisher Scientific) equipped with a heated electrospray ionization probe (HESI II). Ultimate RS 3000 UHPLC (Thermo Fisher Scientific), coupled online to a TimsTOF Pro Quadrupole Time of Flight (Q-TOF) (Bruker Daltonics) equipped with an Apollo II electrospray ionization (ESI) probe was to perform lipidome analysis. Lipid separation was performed as previously described in [33]. MS acquisition was performed in DDA PASEF mode. Metabolome separation was carried out with a Sequant ZIC-HILIC (100 × 2.1 mm; 3 μm) protected with a precolumn (5 × 21 mm; 3 μm) (Supelco). MS acquisition was performed in DDA mode. Detailed LC and MS conditions and pre-processing steps (alignment, filtering, normalization and annotation) are reported in [33], [34]. Quality control check was assessed injecting in randomically order the samples and blank to exclude background signal. Following data pre-processing, statistical analysis was performed by Metaboanalyst 5.0.
Enrichment analysis
Metabolite enrichment and network pathway analysis was performed to directly investigate significantly enriched group with functionally related metabolites using MetaboAnalystR package [35]. Compound lists used as input file returned statistically enrichments for each matching dataset.
Quantification of lipid accumulation with Red Oil staining
MCF-7 and MCF-7 TamR cells were plated at a density of 5 × 10⁴ cells/well in a 12-well plate. The following day, the cells were treated with omeprazole 50 µM for 24 h. Then, 4% formaldehyde in PBS was added for 1 h followed by wash step with distilled water and cells fixed with 60% isopropyl alcohol for 5 min. Further, the cells were stained for 15 min at room temperature with a solution of 0.3% Oil Red O in 60% isopropyl alcohol, followed by wash step with distilled water. Lipid amount was defined dissolving samples in isopropanol for 15 min measuring absorbance with Infinite M-plex (Tecan, 30,190,085) at 540 nm.
Lactate assay measurement
MCF-7 and MCF-7 TamR cells were plated at a density of 4 × 10³ cells per well in a 96-well plate. The following day, the cells were treated with oxamate 5 mM for 48 h. Total and intracellular lactate levels, with and without LDHA inhibition, were measured with Pierce LDH Cytotoxicity Assay Kit (ThermoFisher Scientific, 88,953) following the manufacturer's instructions. Absorbance values were recorded in the range of 490–680 nm using a Infinite M-plex (Tecan, 30,190,085). The extracellular lactate level was determined by subtracting the intracellular lactate absorbance from the total lactate absorbance.


Comments (0)