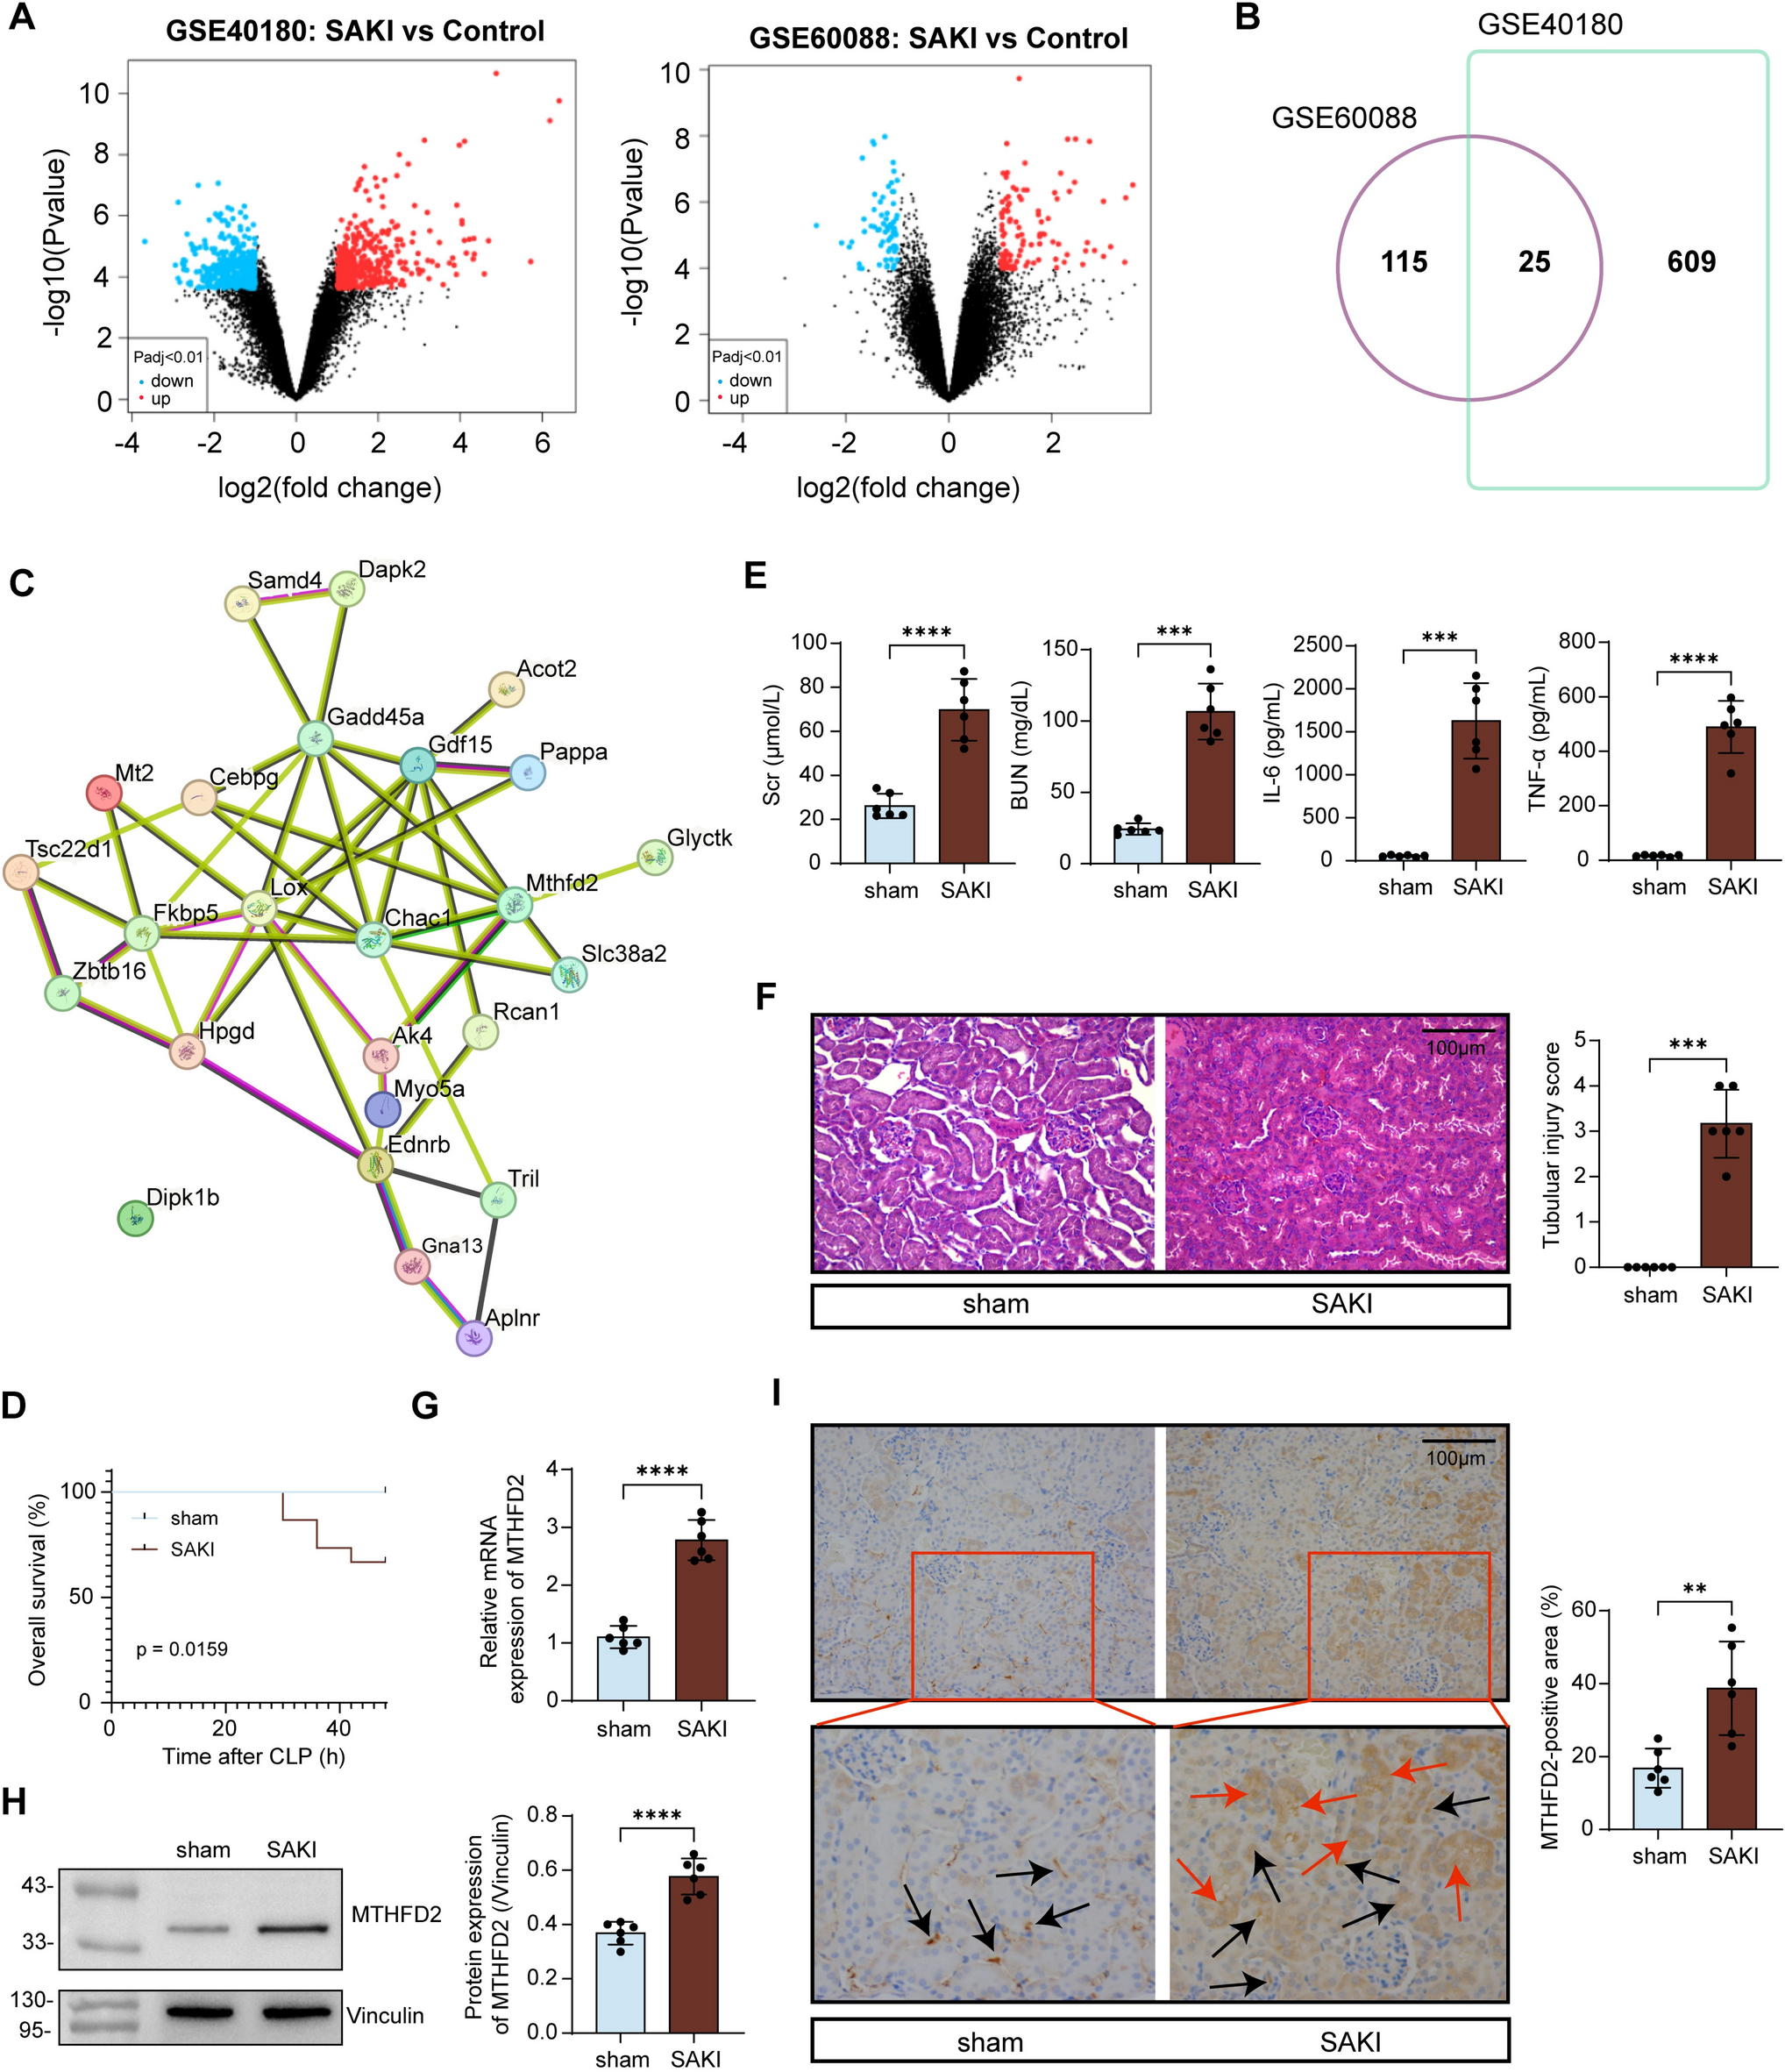
Liver biopsy specimens and histological quantification
Liver biopsy specimens were collected in accordance with guidelines established by the local research and ethics committee. Archived, formalin-fixed, paraffin-embedded needle biopsies from 15 patients with cirrhosis and hepatocellular carcinoma (HCC) were selected as case samples. These biopsies were taken from background liver tissue, distant from the HCC lesions. Archived, formalin-fixed paraffin-embedded biopsies from 45 etiology-matched patients with cirrhosis but without HCC served as controls.
Sections were stained for p16 (Roche, 1:200 concentration; heat-induced epitope retrieval (HIER) in Tris-based CC1 buffer, pH 8–8.5, at 95 °C for 64 min), a well-established marker of permanent cell cycle arrest and senescence [23]. This was used to assess the association between HCC and the burden of senescent hepatocytes. The proportion of senescent hepatocytes was quantified objectively by identifying p16-positive hepatocytes using FIJI software [24]. Whole-slide scans were captured using a NanoZoomer (Hamamatsu Photonics). Scripts from NDPItools [25] were employed to randomly extract three fields at 20× magnification from each slide. Extracted images were then deconvoluted using FIJI’s H-DAB setting, and nuclei were selected by thresholding on the blue channel, corresponding to the hematoxylin counterstain. p16-negative cells were counted automatically using the ‘analyze particles’ function, while p16-positive cells were manually counted and expressed as a percentage of the total cell population.
STAM™ metabolic dysfunction-associated steatotic liver disease mouse model
Pathogen-free 14 day-pregnant C57BL/6 mice were obtained from Japan SLC, Inc. (Japan). The STAM™ model of metabolic dysfunction-associated steatotic liver disease (MASLD) was established in male mice through a single subcutaneous injection of 200 µg streptozotocin (Sigma, USA) administered 2 days post-birth, followed by ad libitum feeding of a high-fat diet (HFD; CLEA Japan Inc., Japan) starting at 4 weeks of age (day 28 ± 2). Mice were randomized into 3 groups of 5 at 4 weeks of age (day 28 ± 2), the day before the start of treatment. Placebo Group (STAM™ + Vehicle): 5 STAM™ mice were administered vehicle intraperitoneally in a volume of 5 ml/kg thrice weekly from 4 to 18 weeks of age. Early Sirolimus Group (STAM™ + Sirolimus): 5 STAM™ mice received intraperitoneal administration of vehicle supplemented with sirolimus at a dose of 1.5 mg/kg, three times per week, starting from 4 to 18 weeks of age. Late Sirolimus Group (STAM™ + Vehicle/Sirolimus): 5 STAM™ mice received intraperitoneal injections of vehicle at a volume of 5 ml/kg three times per week from 4 to 12 weeks of age, followed by intraperitoneal administration of vehicle supplemented with sirolimus at a dose of 1.5 mg/kg, also given three times weekly, from 12 to 18 weeks of age.
The treatment duration was determined based on the timeframe required for 100% of STAM mice to develop HCC, typically between 16 and 20 weeks of age [26]. The dose and the route of sirolimus administration were based on a prior study exploring sirolimus regimens in mice fed a high-fat diet. This study demonstrated the systemic effects of sirolimus in high-fat-fed mice without inducing significant metabolic abnormalities, using a dosage of 1.5 mg/kg administered intraperitoneally three times per week [27].
The in-life phase of the animal study was conducted at SMC Laboratories, Inc. Tokyo, Japan, a contract research organization. SMC Laboratories operates under the oversight of the Ministry of Education, Science and Technology, Japan, is regularly audited on animal welfare standards by global pharmaceutical companies, and possesses the necessary ethical approvals to conduct animal research (SLMN009-1704-0). All mice were kept in a specific pathogen-free environment within TPX™ cages (CLEA, Japan), where conditions were carefully regulated, including temperature (23 ± 2 °C), humidity (45 ± 10%), and a 12-h light/dark cycle (lights on from 08:00 to 20:00). The facility also maintained controlled air exchange and negative pressure in the experimental room to prevent contamination. Sterilized solid HFD was provided ad libitum, placed in a metal lid on top of the cage. Fresh water was freely available via a water bottle fitted with a rubber stopper and a sipper tube. The water bottles were replaced weekly, cleaned, sterilized in an autoclave, and reused. Sterilized Paper-Clean (Japan SLC) was used as bedding and was changed once a week. Viability, clinical signs, and behavior of the mice were monitored daily. Body weight was measured prior to treatment. Following each administration, the mice were observed for 60 min to check for signs of toxicity, moribundity, and mortality.
All mice were sacrificed at 18 weeks of age by exsanguination through direct cardiac puncture under isoflurane anesthesia (Pfizer Inc.). The extirpated livers were examined macroscopically for the presence of gross swelling tumor nodules and tumor nodules > 2 mm in diameter were counted. Two sections from the left lateral lobe, as well as from the left and right medial and caudate lobes, were snap-frozen in liquid nitrogen and stored at − 80 °C. The remaining portions were fixed in Bouin’s solution, embedded in paraffin, and kept at room temperature. Sections from paraffin blocks of liver tissue were cut for hematoxylin and eosin staining to assess MASLD activity score and picrosirius red staining to assess fibrosis. Fibrosis area was quantitatively assessed by capturing bright-field images of picrosirius red-stained sections around the central vein with a digital camera (DFC295; Leica, Germany) at 200× magnification. The positive areas in five fields per section were measured using ImageJ software (National Institute of Health, USA). All slides were reviewed by an independent liver histopathologist (PK).
Non-fasting blood samples were collected in separate serum tubes (BD, USA) without anticoagulant and centrifuged at 15,000×g for 2 min at 4 °C. The supernatant was then collected and stored at − 80 °C. Serum alanine aminotransferase (ALT) levels were measured using the FUJI DRI-CHEM 7000 (Fujifilm Corporation, Japan). Total lipid extracts from the liver were obtained using Folch’s method [28]. Liver samples were homogenized in chloroform–methanol (2:1 V/V) and incubated overnight at room temperature. After washing with chloroform–methanol–water (8:4:3 V/V/V), the extracts were evaporated to dryness and dissolved in isopropanol. Liver triglyceride content was determined using the Triglyceride E-Test (Wako Pure Chemical Industries Ltd., Japan).
Liver tissue preparation and quantification of SASP factors
Frozen liver lobes from STAM™ mice were pulverized using a Cryo-Cup Grinder (Biospec, USA) following manufacturer’s instructions. Tissue lysis was conducted by re-suspending pulverized tissue in ice-cold T-PER tissue protein extraction reagent (Thermo Fisher Scientific) containing protease inhibitor cocktail (working dilution 1:1000; Roche), at a final concentration of 100 mg/ml. Following sonication on ice (80 s total time; pulse ON for 10 s; pulse OFF for 30 s; amplitude 40%), samples were centrifuged at 10,000 rpm for 5 min at 4 °C. The protein concentration of each sample in the supernatant was measured using a Coomassie (Bradford; Bio-Rad) protein assay. Supernatants were then analyzed for the presence of the following SASP factors: TNF-α, IL-1β, and IL-6 by enzyme-linked immunosorbent assay (ELISA) following manufacturer’s instructions (R&D Systems). A microplate reader (BioTek Synergy HTX) read the absorbance at 450 nm and analyzed using the four parameter logistic (4PL) regression model.
For western blotting analysis, liver protein extracts were separated on 14% SDS-PAGE gels, and proteins were transferred to nitrocellulose membranes. The membranes were blocked in 5% bovine serum albumin (BSA, Merck) in tris-buffered saline (TBS) containing 0.1% Tween 20 (TBST) and were sequentially incubated with antibodies against mouse CXCL15 (bs-2554R; Bioss Antibodies), IL-2 (MAB402; R&D Systems), α-tubulin (ab52866; Abcam), and β-actin (4970S; Cell Signaling Technology). Both α-tubulin and β-actin were used as housekeeping proteins in the western blot experiments as their expression is not affected by sirolimus [29,30,31]. Blots were stripped of antibody between analyses with ReBlot Plus Strong Antibody Stripping Solution (Merck Millipore) and blocked again in 5% BSA-TBST. Densitometric analysis of bands was performed with Fiji, and the results are presented as relative band volumes.
RNA extraction and QT-PCR
RNA was extracted from mouse livers using phenol/chloroform separation and the Qiagen RNeasy Mini Kit (#74104). Extracted RNA was quantified using a Nanodrop before normalization to 500 ng total RNA and reverse transcription using the High-Capacity RNA to cDNA kit (Thermo Fisher #4387406). TaqMan probes were used for qPCR (TaqMan Fast Advanced Master Mix, Thermo Fisher #4444964). The expression of all genes was adjusted to that of GAPDH, and their relative expression calculated using the 2ΔΔCt method. Probes used and Thermo Fisher assay IDs are as follows: GAPDH (Mm99999915_g1); TNFα (Mm00443258_m1); IL1β (Mm00434228_m1); and IL-6 (Mm00446190_m1).
Statistical analysis
Statistical analysis was undertaken using GraphPad prism 10 and SPSS (version 28). p < 0.05 was considered significant. Results were expressed as mean with standard deviation (SD) or median with interquartile range (IQR) or number with percentage unless otherwise stated. All statistical analyses were performed using either GraphPad prism 10 (San Diego, CA) or SPSS for Windows v28 (IBM Corp, Armonk, NY, USA). Clinical parameters at biopsy were analyzed for association with the development of HCC using the Mann–Whitney U test or 1-way ANOVA (Kruskal–Wallis test) as appropriate. A multivariable binary logistic regression model was employed to identify independent associations with the development of HCC, by including variables that had a p value of < 0.10 in univariate analysis. Variables were only considered to have independent association if the p value reached Bonferroni-corrected level of significance.


Comments (0)