
Remember me


The analysis relied on data extracted from the Colorado Department of Health Care Policy & Financing (HCPF) database, specifically focusing on Medicaid-enrolled patients with diagnosed SCD based on ICD-10-CM codes (see Online Resource 1 in the electronic supplementary material [ESM]). The data encompassed the period from 2018 to 2023 and provided detailed information on healthcare utilization and associated costs. Key elements extracted from the dataset included demographic details (age, sex), diagnosis codes indicating clinical events with corresponding dates, treatments along with their dates, care settings (inpatient, outpatient, emergency department), and the total payment amounts made by Medicaid for each patient's healthcare services.
2.1.2 Patient Selection and Cost Analysis MethodTo identify patients whose mean costs represent the SoC costs for the target group for gene therapies, an index date was established for each patient, and follow-up continued throughout the study period to estimate their costs. Multiple approaches were used to define severe SCD based on claims in the Medicaid database. In the base case, severe SCD was defined similarly to other recent claims analyses using specific criteria applied in the literature [15,16,17,18]. These criteria included a diagnosis code for SCD of D57, excluding D57.3 for sickle-cell trait, and patients had to be at least 12 years of age. Additionally, the patient with SCD must have experienced at least four vaso-occlusive episodes (VOEs) within the past 2 years, or at least two acute chest syndrome diagnoses within the past 2 years, or a diagnosis of stroke (see Online Resource 1 in the ESM). These criteria were aligned with those used in clinical trials such as CLIMB SCD-121 (ClinicalTrials.gov identifier: NCT03745287) and HGB-206 (NCT02140554). Annual costs were calculated for each year of follow-up separately and then averaged to estimate the mean annual cost per patient.
The standard of care (SoC) cohort consisted of patients who received supportive care, hydroxyurea, blood transfusions, and newer therapies like voxelotor and crizanlizumab. However, the costs and potential impacts of these newer therapies were not analyzed separately. Instead, their contributions are included within the overall SoC estimates.
Beyond the base case, we examined the relationship between a higher number of VOEs (stricter eligibility criteria) and the number of patients meeting the criteria and their mean annual costs. The setting for treating VOEs, such as inpatient, outpatient, or emergency department (ED), might also be associated with disease severity [19]. Therefore, we developed scenarios based on where the VOE was treated.
Individuals with SCD undergoing regular red blood cell transfusions are more likely to avoid VOEs [20]. Due to the potential reduction in VOEs from transfusions, they might not meet eligibility criteria based on VOEs, even though they likely have a more severe form of SCD. As the potential benefits of gene therapy for these patients require more complex consideration, we excluded transfused patients who did not meet any of the other eligibility criteria (VOE, acute chest syndrome, stroke) from the overall cohort of potentially eligible patients and reported their costs separately.
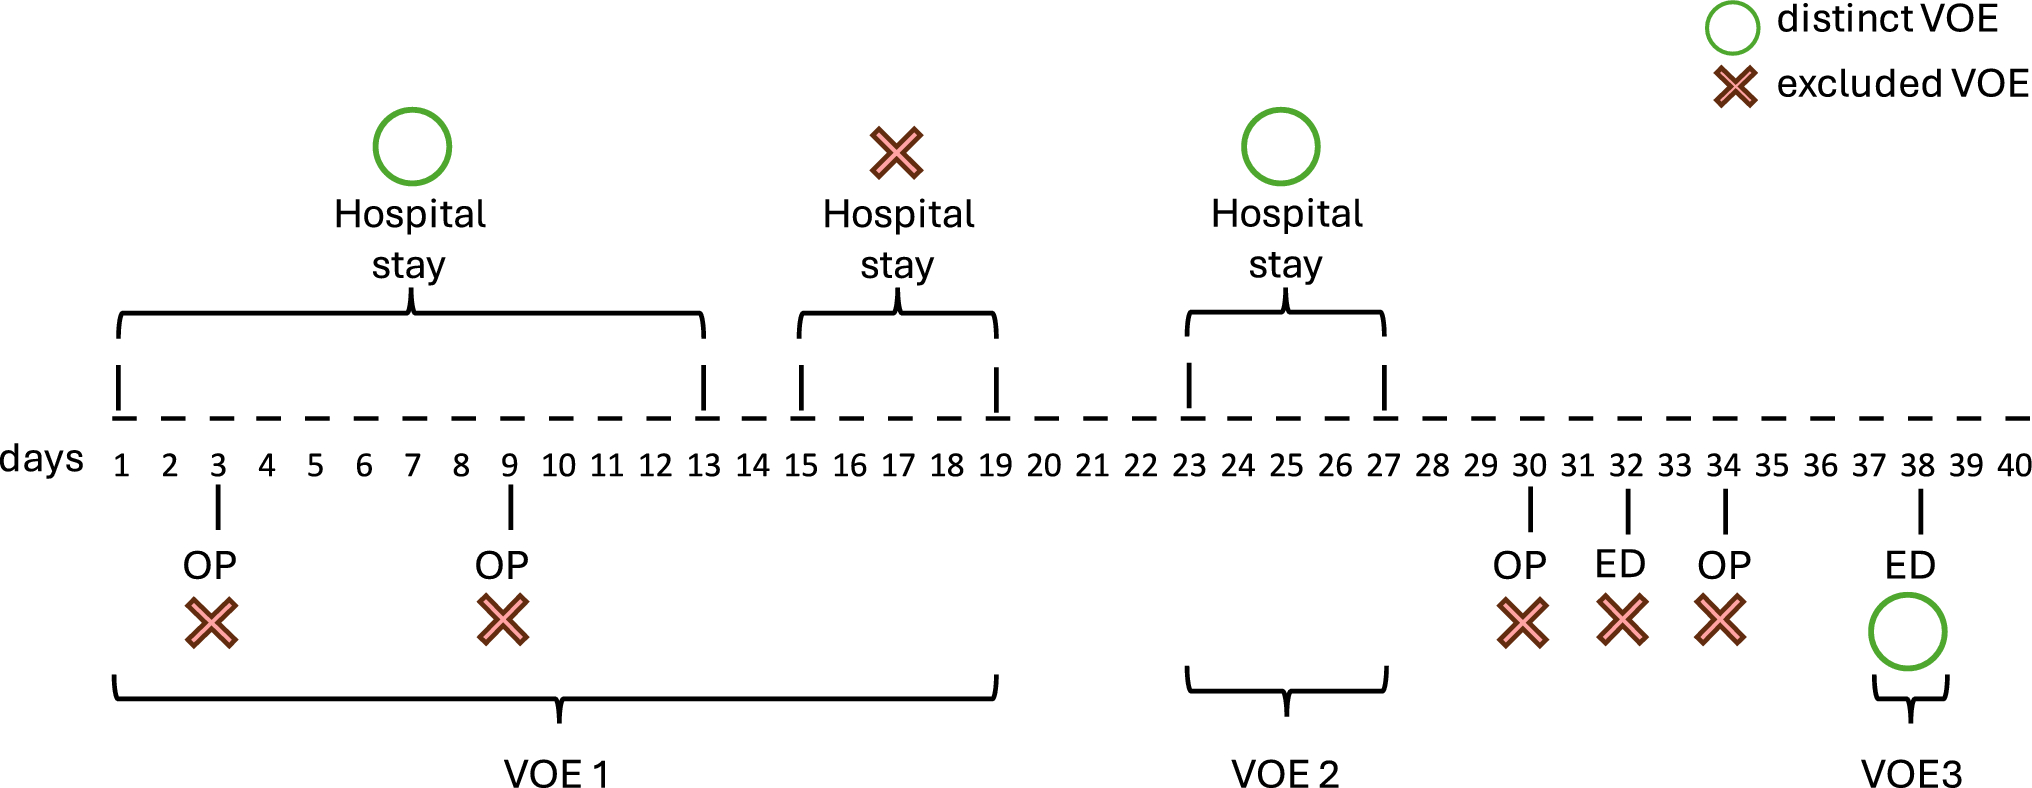
VOEs were treated as distinct events if they occurred at least 3 days apart. Therefore, multiple visits within a span of < 3 days were considered a single VOE event. Overlapping inpatient, outpatient, and ED visits were also treated as a single event. Figure 1 illustrates the approach used to determine whether multiple healthcare visits are treated as separate or single VOEs. We excluded zero-cost claims for dual-eligible Medicare–Medicaid patients. Patients who met the criteria in any given year were retained throughout the observation period. The total cost was considered as the all-cause costs (beyond SCD) paid by Medicaid, which does not include any rebates. All costs were reported in 2023 US dollars.
Fig. 1
Visualization of the method of identifying discrete VOEs. OP outpatient, ED Emergency department, VOE vaso-occlusive events
A control group to separate SCD-specific from non-SCD-related healthcare costs could not be identified because of limitations in the claims dataset, including insufficient patient characteristics such as the absence of socioeconomic status or comorbidity profiles. An additional scenario analysis was conducted using the all-cause costs of a subgroup of patients with less severe SCD as a proxy to address this. This subgroup included newly diagnosed patients with minimal disease burden and no severe complications or transfusions. Non-SCD-specific costs from this subgroup were assigned to the no-SCD health states in both arms, and SCD-specific costs were calculated by subtracting these costs from overall all-cause costs. This approach provided an alternative perspective on cost estimates.
2.2 Comparison of All-Cause Costs with Standard-of-Care and Gene TherapiesThree-state Markov models (SCD, stable, and dead) were constructed to simulate the costs associated with SoC and gene therapies (exa-cel and lovo-cel), with results presented over a 6-year time frame. The SCD state refers to a health condition characterized by complications from the disease, like vaso-occlusive crises, requiring medical intervention. In contrast, the stable state describes a health condition where symptoms are controlled with no significant disease-related complications. Gene therapy treatment success, defined as freedom from severe VOEs, was estimated at 92% based on recent clinical data [21]. For the base case, the probability of reversion from the stable state to the SCD state was modeled using data from Frangoul et al. [22, 23], where one of 29 evaluable patients experienced a VOC. A 6-month cycle probability of 0.00688 was derived from these observed outcomes. This reversion rate was then applied both during the initial 30.5 months and extrapolated beyond that period due to limited long-term follow-up data. Sensitivity analyses tested the assumption of one out of 29 patients experiencing a VOC by applying this rate across different time horizons (e.g., 5 years, 10 years, 15 years, and 20 years).
Mortality was modeled using age-adjusted rates for SCD patients, with general population mortality rates multiplied by standardized mortality ratios (SMRs) based on age groups, following the approach applied by ICER’s SCD gene therapy review [5]: ages 12–18 years (SMR = 40.07), ages 19–35 years (SMR = 24.24), and ages 35+ years (SMR = 17.48). For patients achieving a stable state (no VOEs) after gene therapy, mortality hazard ratios were adjusted based on estimates from the ICER review [5].
It is acknowledged that the modeling simplifies the disease's complex and heterogeneous course. More detailed analyses focused on gene therapy value have already been developed [5, 24,25,26]. Given the scope of this analysis and the 6-year time horizon, a generalized model was used to capture the broad cost trends associated with SCD. To address heterogeneity, the model integrates cost data from Medicaid claims for actual SCD patients across different levels of VOE, thereby capturing the variation in standard-of-care costs. Furthermore, the model explicitly considers uncertainty in two significant areas: 1) uncertainty around the ‘durability’ of the effectiveness of a cell and gene therapy at a population level; and 2) uncertainty around eligibility and payment approaches.
One author (RBM), who was not directly involved in the model's development, conducted a thorough review of the model. Key assumptions for the cost simulation model are presented in Table 1, while the inputs used in the model are listed in Table 2. The model estimated the cost of the gene therapies (1) without OBA and (2) with OBA, which includes paybacks in the event of gene therapy failure. Payback amounts (rebates) for a 6-year contract were estimated based on a proportionately declining percentage of the gene therapies' upfront cost over the contract duration. Payback rates for the gene therapies are presented in Online Resource 2 (see ESM).
Table 1 Key model assumptionsTo determine the uncertainty interval of the financial balance with gene therapies at 6 years, a Monte Carlo simulation with 1000 trials was run, employing the probabilistic value of the standardized mortality ratio, the treatment effectiveness on mortality, response rate, durability of effectiveness, gene therapy administration and monitoring costs, and SoC costs.
2.3 Assessing the Impacts of Payment ModelsThe financial implications of various payment models proposed by CMMI’s Cell and Gene Therapy Access Model were evaluated, focusing on OBAs, volume-based rebates, and guaranteed rebates. The analysis was conducted over a 6-year contract period, the maximum duration proposed by CMMI. It assessed the impact of gene therapy effectiveness duration, patient eligibility criteria, and rebate structures. For OBAs, financial impacts for Medicaid were estimated under different scenarios of response rate, gene therapy effectiveness durability, and across varying contract time horizons. Volume-based rebates were analyzed in relation to patient eligibility criteria, with hypothetical tiered rebates assigned based on varying thresholds for VOEs experienced in the 2 years prior to gene therapy qualification. These thresholds ranged from patients with ≥ 4 VOEs to those with ≥ 15 VOEs over the preceding 2 years. Guaranteed rebates were calculated based on hypothetical offsets of Medicaid costs over different time horizons, reflecting various SoC cost scenarios. These models aimed to explore potential financial savings and mitigate the budgetary impact on Medicaid while maintaining patient access to gene therapies.
Comments (0)