
Remember me


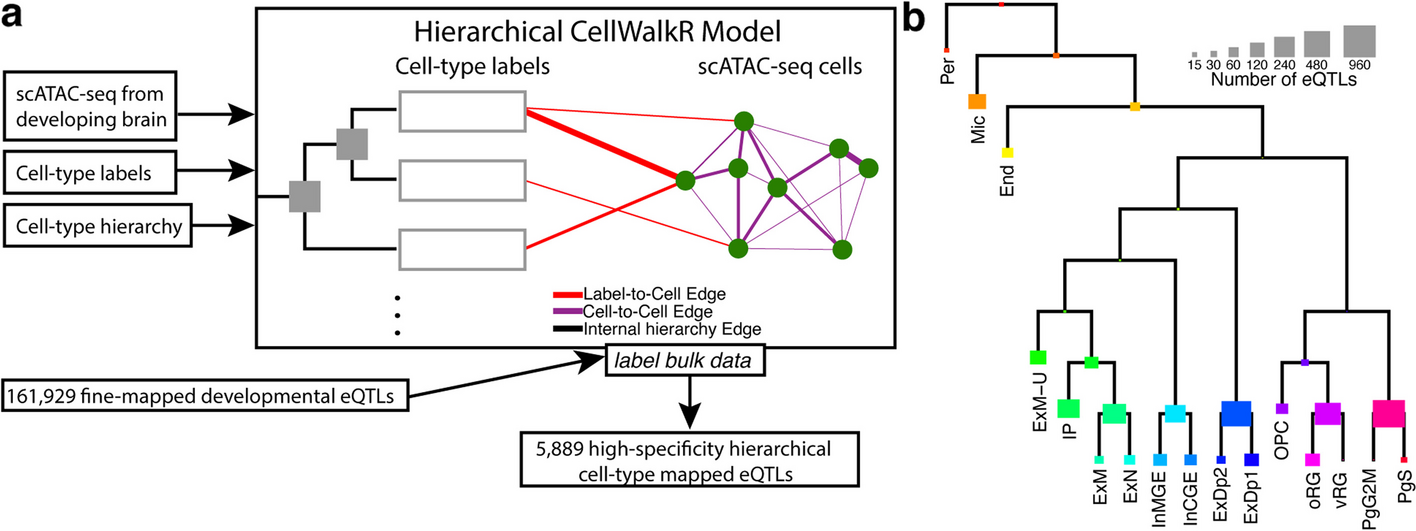

We developed H-eQTL, a network-based hierarchical model to identify cell type-specific eQTLs in complex tissues with closely related and nested cell types (Fig. 1a). Our model extends the existing CellWalkR model [18] to take a cell type hierarchy as input in addition to cell type labels and scATAC-seq data. Briefly, the cell type hierarchy is taken as prior knowledge, and it is implemented as edges between leaf nodes that represent specific cell types and internal nodes that represent broader cell types higher in the hierarchy. The cell type nodes are then connected to nodes representing cells based on how well marker genes correspond to each cell’s chromatin accessibility, and cells are connected to each other based on the similarity of their genome-wide chromatin accessibility. A random walk with random restarts model of network diffusion is then run on this network to calculate how much information flows from each node to each other node. In particular, this includes the probability that a walk starting at each cell node ends at each cell type node as well as each internal node representing portions of the cell type hierarchy.
Fig. 1
Hierarchical cell type mapping by H-eQTL. a The H-eQTL workflow: the hierarchical model extends CellWalkR to take a cell type hierarchy as an input in addition to scATAC-seq data and cell type labels. The hierarchy is used to create internal nodes in the model that correspond to cell types higher in the hierarchy. This hierarchical model was used to label a large set of fine-mapped developmental brain eQTLs with high specificity. b Count of how many developmental brain eQTLs are mapped to each hierarchical cell type
Next, given a set of bulk-derived eQTLs, each eQTL is mapped to hierarchical cell types using the calculated flow of information and the chromatin accessibility of individual cells. For each eQTL, the location of the eSNP is intersected with the accessibility of each cell, and then the normalized cumulative flow from those cells is used to score each hierarchical cell type. This results in a label z-score for each hierarchical cell type for each eSNP. In this way, eQTLs from bulk data can be mapped to a cell type tree. The cell type with the highest score can be used as a discrete labeling of the eQTL, or the scores across all cell types can be treated as a fuzzy (i.e., probabilistic) labeling.
Annotation of eQTLs in the developing brainWe next applied this hierarchical model to label bulk eQTLs from the developing brain [9] using scATAC-seq data from the mid-gestation telencephalon [19] combined with a transcriptomics-based cell type hierarchy derived from similar samples [15]. Our model was able to label 5889 eQTLs to hierarchical cell types with high specificity (z-score greater than 2, see the “Methods” section for details). These eQTLs mapped to a large variety of hierarchical cell types (Fig. 1b, see Additional file 2: Table S1 for full names of cell types), including both specific cell types (e.g., outer vs ventral radial glia) as well as higher level annotations (e.g., broadly neuronal). A full list of cell type annotations for eQTLs is provided in Additional file 3: Table S2.
For comparison, we annotated eQTLs with a non-hierarchical version of the same model. We found that without hierarchical cell types, while the model was still able to label highly distinct cell types such as endothelial cells and microglia, it was unable to label similar or nested cell types such as different radial glia (Fig. 2a, Additional file 1: Fig. S1a and b). Only 1252 eQTLs could be mapped to non-hierarchical cell types with high specificity, indicating a fivefold loss in annotation compared to using the cell type tree (Fig. 2b). Of those that could be annotated by the non-hierarchical model, 81.4% received the same annotation from the hierarchical model, within a level of the hierarchy (direct parents or siblings). A less stringent threshold for specificity (z-score greater than 1) annotates more eQTLs but maps multiple non-hierarchical cell types to each eQTL (Additional file 1: Fig. S1c), likely due to related cell types having highly correlated scores (Additional file 1: Fig. S2). This indicates that a major advantage of using a cell type tree is its ability to account for highly correlated cell types.
Fig. 2
Hierarchical cell types provide improved labeling. a Non-hierarchical high-specificity cell type mapped eQTLs generally map to a single cell type, but they are biased towards very distinct or common cell types. b Many eQTLs that could not be mapped to a specific cell type in the non-hierarchical model (“Broad,” shown in gray) receive hierarchical cell type labels (shown on x-axis). c UMAP embedding of eQTLs labeled by non-hierarchical cell type (left) and hierarchical cell type (right) shows that a diverse set of previously unlabeled eQTLs can now be labeled. Due to this increased label diversity, we can observe that some eQTLs for the same gene (e.g., FABP7 and ICA1L) map to vastly different cell types
As an orthogonal comparison, we overlapped eSNPs with annotated broad cell type-specific peaks and enhancers [19] and compared these annotations to our hierarchical and non-hierarchical eQTL cell type labels. Overall, we observed that our labels are consistent with these two sources of regulatory element annotation (Additional file 1: Fig. S3). For example, we found that 93% of our hierarchically labeled eQTLs have eSNPs that overlap cell type-specific peaks. Non-hierarchical eQTL labels were also generally consistent with the annotations, but fewer of them overlapped cell type-specific peaks and enhancers compared to hierarchical labeling. Together, these analyses validate our cell type labels and underscore the extra sensitivity provided by the cell type tree.
Using the label scores we calculated for each hierarchical cell type for each eQTL, we embedded the eQTLs into two-dimensional UMAP space (Fig. 2c). Consistent with the previous results, we observed a large increase in the coverage and diversity of hierarchical annotations of eQTLs as compared to non-hierarchical annotations. Hierarchically related cell types are located near each other, reflecting their relationships being modeled in the eQTL labeling process. Furthermore, eQTLs tend to cluster by cell type, rather than by the eGene each eSNP is linked to (p-value < 0.05 using a two-tailed Wilcoxon rank-sum test for distances between pairs of eSNPs assigned to the same gene versus to the same hierarchical cell type). For example, the four eQTLs for the gene FABP7 are annotated to three different hierarchical cell types, and the six eQTLs for ICA1L are annotated to four different hierarchical cell types. These multi-cell type annotations were not detected with the non-hierarchical model or by overlapping with cell type-specific peaks, emphasizing the need for hierarchical cell type annotation.
Identification of cell type-divergent eQTLsGiven the hierarchical model’s increased ability to assign multiple distinct cell types to different eSNPs linked to the same eGene, we sought to identify all such genes. For each eGene, we considered it to have cell type-divergent eQTLs if at least two eSNPs linked to that eGene were not the same cell type nor were they ancestors of each other in the original cell type hierarchy. We also required that the full label scores for the eSNPs were not similar to each other (see the “Methods” section for details). We identified 613 eGenes with cell type-divergent eQTLs, the majority of which were linked to two distinct cell types though a few had three or more cell type annotations (Fig. 3a). For comparison, only 88 eGenes with cell type-divergent eQTLs could be identified using the non-hierarchical model, only 320 using any overlaps with annotated cell type-specific peaks, and only 33 using overlaps with cell type-specific enhancers (Additional file 1: Fig. S4). Thus, the higher sensitivity of our hierarchical model revealed a greater frequency of genes with eSNPs that function in distinct cell types.
Fig. 3
Cell type-divergent eQTLs. a While only 66 eGenes have at least two eQTLs with distinct non-hierarchical cell types, the larger number of annotations we can make with the hierarchical model results in 613 eGenes having at least two distinct hierarchical cell types. b An upset plot showing the most common divergent hierarchical cell types for eQTLs across eGenes. c For highly expressed genes with cell type-divergent eQTLs, the gene is differentially expressed in cells where the first eSNP is accessible (x-axis) as well as in cells where the second eSNP is accessible (y-axis), as observed in jointly profiled multiome scRNA/ATAC data. The split colors of each point indicate the divergent hierarchical cell types following the key from panel b. d For highly expressed genes with divergent radial glia (oRG/vRG, shown in magenta) and interneuron (InMGE/InCGE, shown in teal) eQTLs, cells in which the respective eSNP is accessible are enriched for the matching cell type in the labeled scRNA-seq portion of jointly profiled multiome scRNA/ATAC data
Taking a closer look at eGenes with cell type-divergent eQTLs, we find eGenes with eSNPs corresponding to diverse combinations of cell types such as deep layer plus maturing excitatory neurons (21 eGenes) and interneurons plus radial glia (21 eGenes) (Fig. 3b). For comparison, the non-hierarchical model almost exclusively identified cell type-divergent eGenes with eSNPs involving microglia and endothelial cells, two particularly distinct cell types, and generally failed to identify divergent eQTLs annotated to different types of neurons (Additional file 1: Fig. S5). Additionally, we observed that the more cell type-specific eSNPs an eGene has, the higher its expression entropy across cell types in scRNA-seq [16] (Additional file 1: Fig. S6). This indicates that the more different cell type-specific eSNPs an eGene has, the more diverse the expression of that eGene across cell types, consistent with these eQTLs providing cell type-specific regulation and making the gene more pleiotropic.
Genes with cell type-divergent eQTLs exhibit cell type-specific regulationIn order to determine if cell type-divergent eQTLs directly contribute to cell type-specific expression, we looked at multiome measurements of scRNA-seq and scATAC-seq in the same cells in the developing brain [16]. Given the sparse nature of multiome data, only 356 eGenes with cell type-divergent eQTLs could be tested in the multiome data. For each of these eGenes and each of their eSNPs, we tested whether cells in which the eSNP was uniquely accessible (i.e., no other eSNP was accessible for that eGene) the eGene was differentially expressed relative to cells in which the eSNP was not accessible. We observed significant differential expression across multiple eQTLs for 30 of these eGenes (false discovery rate < 0.05, Additional file 1: Fig. S7 and S8). Sixteen of these differentially expressed eGenes were highly expressed (Fig. 3c). Since accessibility and expression were determined using very sparse data per cell, we posit that the lack of significant differential expression for most eQTLs is influenced by low power. Overall, we observe that changes in accessibility in cell type-divergent eQTLs lead to changes in expression in those same cells.
Next, we considered the previously determined cell type annotations of the scRNA-seq portion of the multiome data in order to determine if predicted cell type-divergent eQTLs had eSNPs with cell type-specific accessibility. While these multiome cell type annotations do not directly match the labels used in our cell type hierarchy, we observe that generally they are enriched in the predicted cell type when the corresponding eSNP is accessible (Additional file 1: Fig. S9). Furthermore, for highly expressed eGenes with cell type-divergent eQTLs, we detected an enrichment for corresponding cell types when each eSNP was uniquely accessible (Additional file 1: Fig. S10). For example, looking at eGenes that have divergent eQTLs for radial glia and interneurons, we see that the eSNP is always more enriched in the predicted cell type when the corresponding variant is accessible (Fig. 3d).
Finally, we looked for mechanisms of action for the change in expression. We found that of the 613 eGenes with cell type-divergent eQTLs, 222 had eSNPs that disrupted binding sites of at least two different transcription factors (TFs) that are expressed in the corresponding cell type. Among these TFs, some are very specific to a single hierarchical cell type (e.g., FOSB and JUND for cycling PgG2M/PgS progenitor cells, FOXP2 for newborn and maturing ExM/ExN/IP excitatory neurons), while some are disrupted in many cell types (Additional file 1: Fig. S11). Furthermore, some TFs frequently co-occur as disrupted by cell type-divergent eQTLs (Additional file 1: Fig. S12). For example, 13 genes have both an eSNP predicted to disrupt SMAD2 binding in newborn and maturing excitatory neurons (ExM/ExN/IP) and an eSNP predicted to disrupt JUND binding in cycling progenitor cells. This supports the idea that one mechanism of gene pleiotropy is cell type-specific transcription factor binding.
Cell type-divergent regulation of FABP7 and ICA1LThe brain-related genes FABP7 and ICA1L are both expressed in multiple cell types in the developing brain (Fig. 4a). FABP7, which plays a role in the establishment of radial glial fiber [20], has four eQTLs that we mapped to hierarchical cell types. Of the three eSNPs that overlapped peaks in multiome scRNA/ATAC data, each was enriched for the corresponding scRNA-seq cell type annotation when the variant was accessible (Fig. 4b, top). Furthermore, two eSNPs overlapped known enhancers, two overlapped predicted cell type-specific regulatory elements, and three disrupted different TFs that were expressed in the corresponding cell types, indicating a possible mechanism of action (Additional file 1: Fig. S13). Taken together, this suggests that the expression of FABP7 in different cell types may be driven by cis regulatory elements overlapping eSNPs as annotated by our hierarchical model.
Fig. 4
FABP7 and ICA1L exhibit cell type-specific regulation. a FABP7 (middle) and ICA1L (right) are expressed in many cell types in the developing brain (cell type labels shown on left). b For each eQTL associated with FABP7 (top) and ICA1L (bottom) cells in which the respective eSNP is accessible are enriched for the matching cell type in the labeled scRNA-seq portion of jointly profiled multiome scRNA/ATAC data. c MPRA data from brain organoid (left) and primary cells (right) that overlapped ICA1L eSNPs all showed RNA/DNA ratio at or above the median of positive controls (black dashed line) and above the median for negative controls (red dashed line) indicating that these variants occur in functional regulatory regions. d For one ICA1L eSNP, both the reference (red) and alternative (blue) alleles were tested in an MPRA finding a significant difference in RNA/DNA ratio. e A machine learning model predicts that the ratio between alternative and reference alleles of RNA/DNA ratio for genes with cell type-divergent eQTLs is often independently changed by both eSNPs
A similar enrichment for corresponding cell types was observed for ICA1L eQTLs, four of which could be tested using multiome data (Fig. 4b, bottom). For three of these eSNPs, the variant site in question had previously been tested in an MPRA experiment conducted in cortical organoids and primary cortical cells [17]. In all three, the MPRA activity (RNA/DNA ratio) was greater than or equal to positive controls, and always higher than negative controls (Fig. 4c), indicating that these are functional variants. Furthermore, for one variant, both the reference and alternative allele were tested in the MPRA, and there was a significant difference in the RNA/DNA ratio between alleles (Fig. 4d). This data validates our prediction of cell type-specific regulatory variants for ICA1L.
In order to estimate the impact of the change from the reference allele to the variant allele for each eQTL, we expanded our analysis using a machine learning model trained on MPRA data [17]. While this model is not able to make cell type-specific predictions, it helps determine if a specific eQTL may be functional. We predicted RNA/DNA ratios for both the reference allele and alternative allele for the eSNP for each eQTL and found that among eGenes with cell type-divergent eQTLs, 23% had an eSNP that was predicted to be functional (defined as an absolute log-fold change in the ratio between alleles greater than 0.2, the threshold for significance at a false discovery rate < 0.1 in the original MPRA study). Of these, 16% had a second eSNP that was annotated to a different hierarchical cell type and was also predicted to be functional (Fig. 4e). Thus, machine learning provides further support for the presence of many eGenes with cell type-divergent eQTLs regulating different components of their expression across the developing brain.
Comments (0)