Materials
20 weight% HSA solution and PEG-(SS)2 was purchased from Yahui Biotechnology (Hangzhou, China); Copper (II) sulfate (CuSO4), Trypsin, Phosphate-buffered saline (PBS), Dulbecco’s modified Eagle’s medium high-glucose (DMEM), Fetal bovine serum (FBS), Penicillin and streptomycin were all purchased from Sigma-Aldrich unless specified otherwise.
Preparation and characterization of CuHP NSs
To synthesize CuHP NSs, 0.768 g of anhydrous CuSO4 was initially dissolved in 10 mL H2O. This solution was then added to a 0.02 M PBS solution with a total volume of 500 mL. Subsequently, the solution was put on shaker for 2 h to mix evenly (120 rpm/minute). The synthesized CuHP particles were collected and centrifuged. Next, 500 mg of CuHP particles were uniformly dispersed in 1000 mL of deionized (DI) water and subjected to ultrasonication at a power of 1000 W for 24 h while being placed in an ice bath (0–20 ℃). The resulting CuHP NSs were purified through centrifugation at speeds ranging from 2000 to 65,000 rpm for 20 min and were subsequently stored for future applications.
Scanning electron microscopy (SEM, SU8010, HITACHI, Japan) was employed for microstructure observation [26], while X-ray diffraction (XRD, D8 ADVANCE, Bruker, Germany) was utilized to analyze the crystallography of CuHP NSs. Atomic force microscopy (AFM) images were acquired using Dimension ICON (Bruker, USA) [27]. Subsequently, a Zetasizer Nano-ZS90 (Malvern, England) was utilized to measure the size distribution and zeta potential of CuHP NSs.
To detect hydroxyl radicals (·OH), CuHP NSs solutions at various concentrations (0, 0.2, 0.5, and 1 mg/mL) were introduced into a 0.015% methylene blue (MB) solution. The resulting mixture was stirred for 20 min prior to the addition of 1% Hydrogen peroxide (H2O2). Simultaneously, a CuHP NSs mixed solution at a concentration of 0.5 mg/mL was stirred for varying durations (0, 5, 10, and 20 min). UV-visible-near infrared (UV-vis-NIR) spectrophotometry was utilized to evaluate ·OH by measuring the absorbance change at 660 nm. To further investigate ·OH generation at different pH levels (pH = 6.0, pH = 7.4, and pH = 8.4), a mixed solution of 0.2 mg/mL CuHP NSs was exposed to these pH conditions for 30 s. The ability to generate ·OH was determined by monitoring the absorbance change at 660 nm using the aforementioned method.
Preparation and characterization of CuHP/PH composite hydrogel
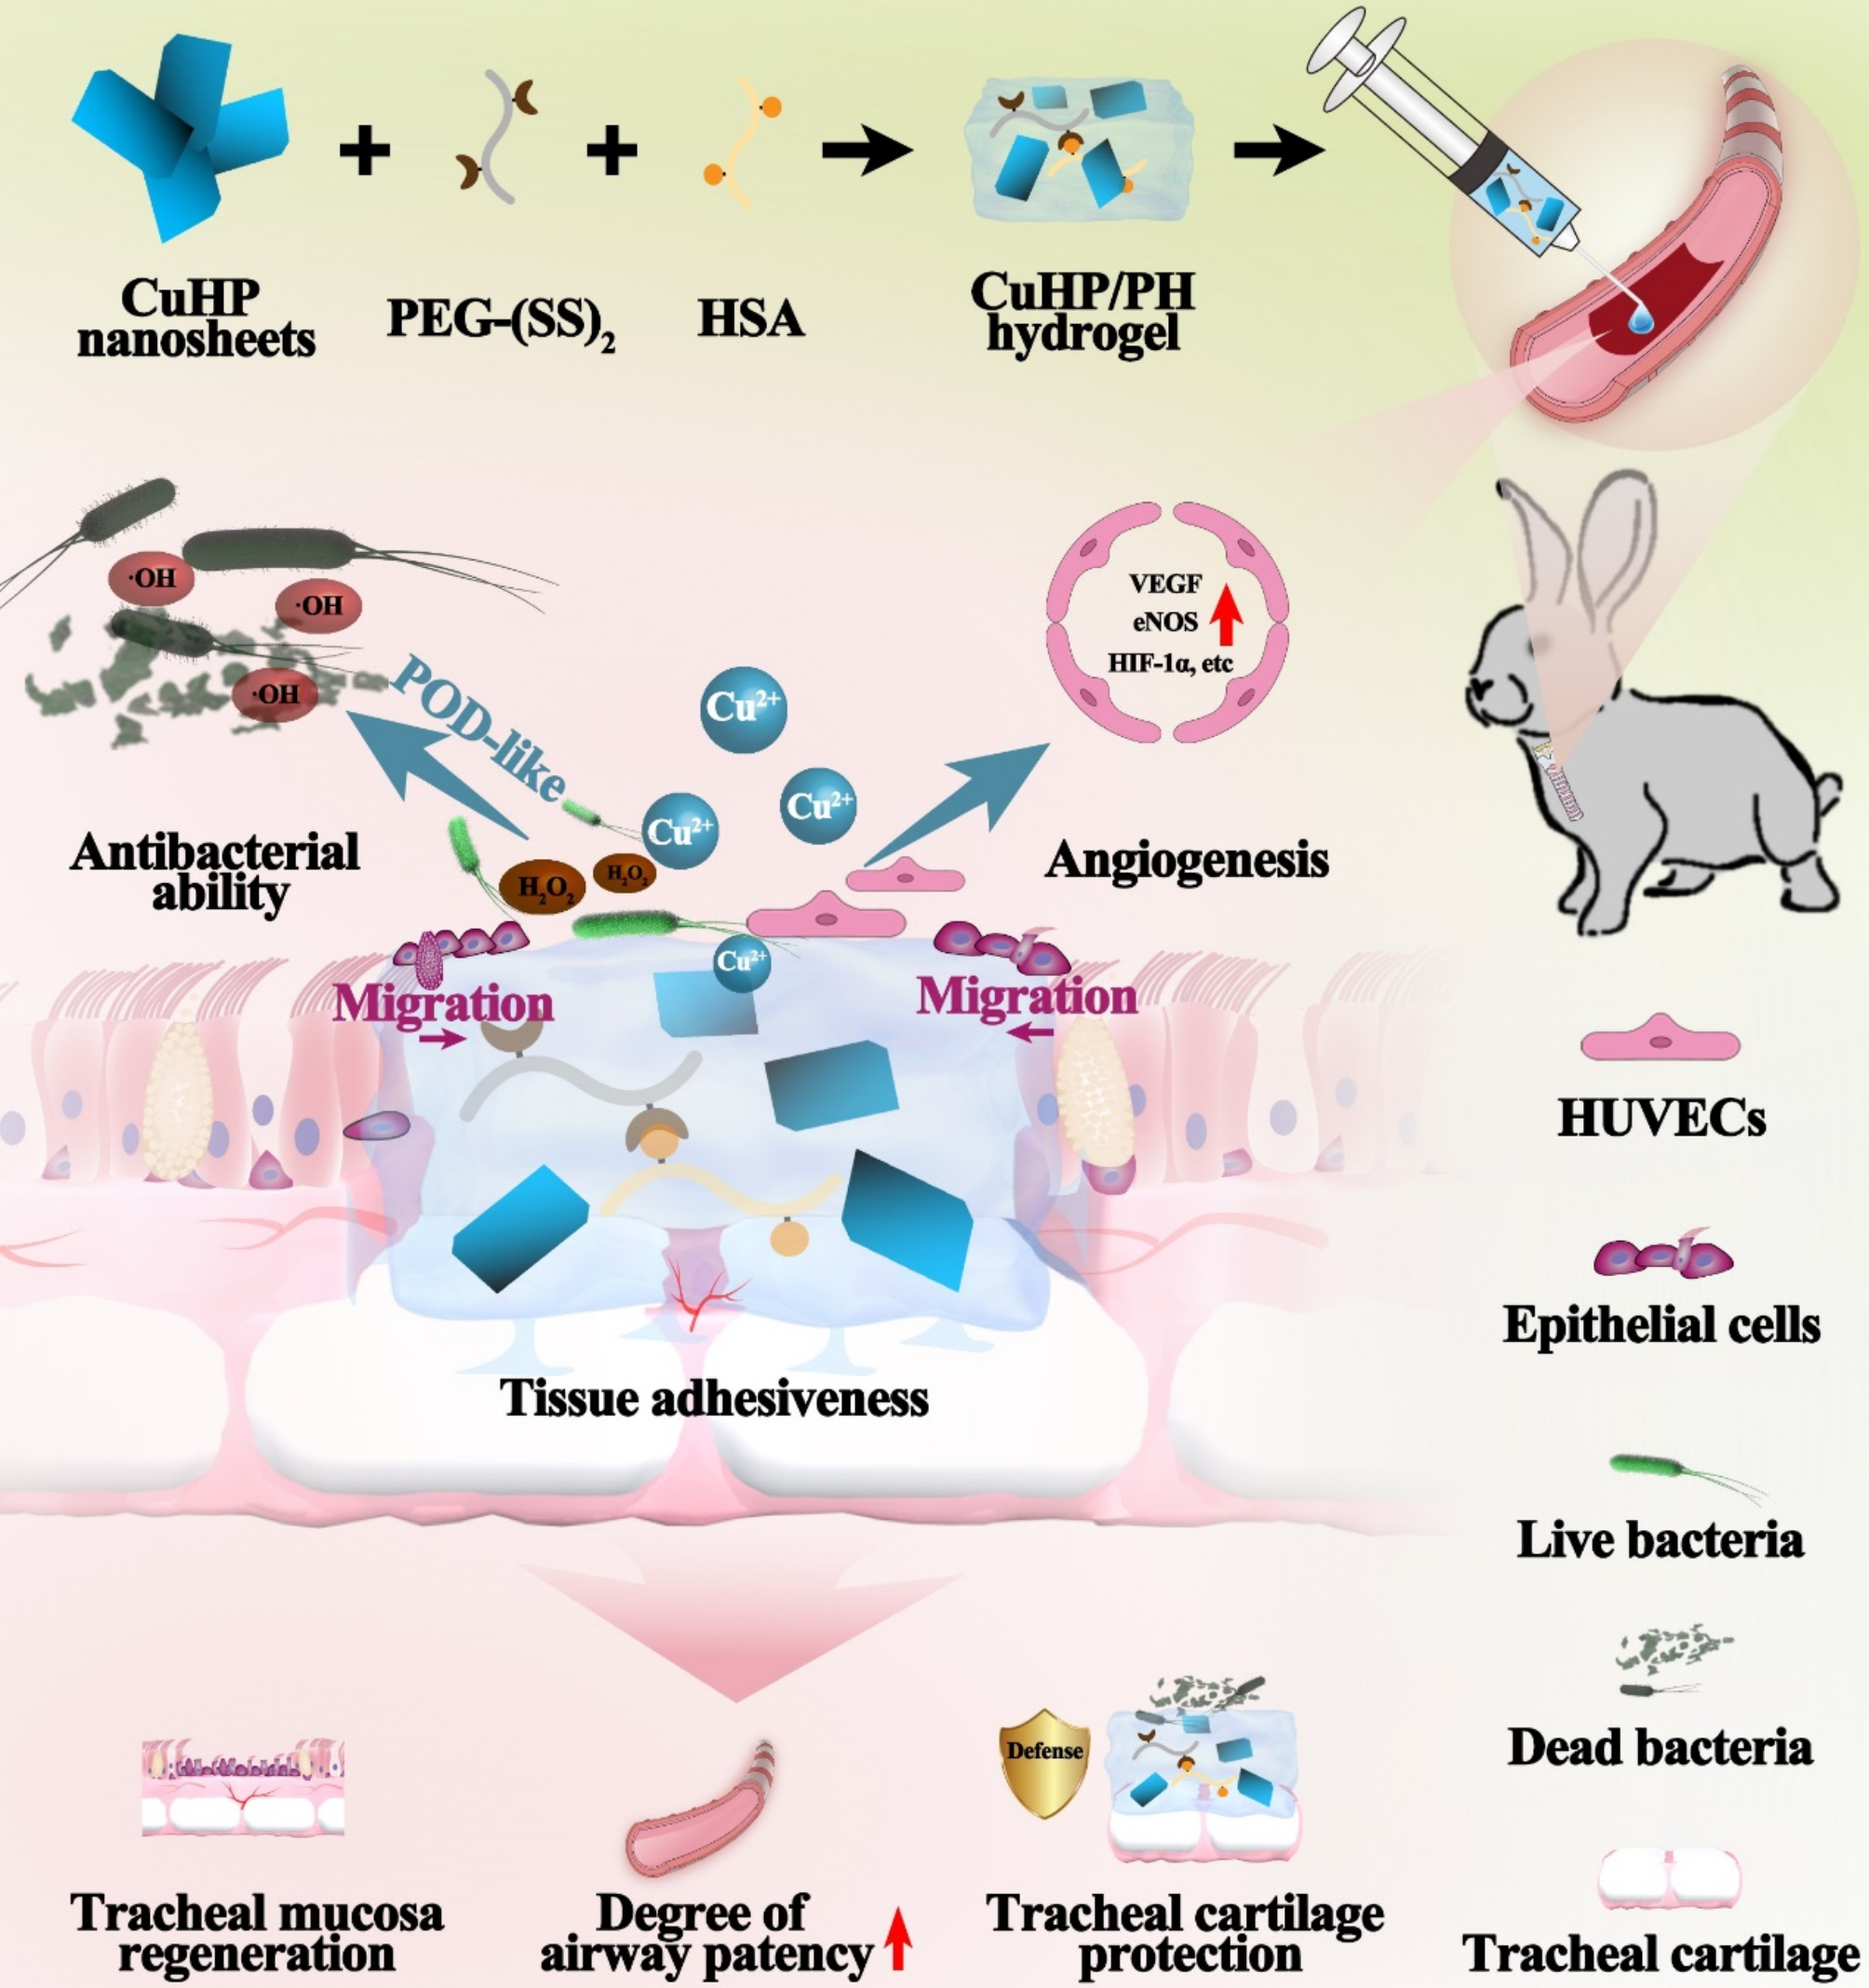
CuHP/PH composite hydrogel was prepared as previously described [17]. Briefly, different weight ratio (0.25 wt%, 0.5 wt%, 1 wt%) of CuHP NSs were first dispersed in 1 mL HSA solution and then mixed with 1 mL PEG-(SS)2 solution (10 wt%, dissolved in PBS) to form different CuHP/PH hydrogel, which were designated as 0.25CuHP/PH, 0.5CuHP/PH and 1CuHP/PH, respectively. PH hydrogel was prepared using the same procedure without adding CuHP NSs. The gelation and adhesive behavior of the hydrogel were evaluated using gross view, in vitro gelation, and adhesion tests. Additionally, in situ adhesion and bursting tests were conducted. Specifically, after stabilizing various shapes of PH and CuHP/PH hydrogel, a 1 × 1 cm paper was used to assess the adhesive ability of PH and CuHP/PH. Subsequently, 50 µL of hydrogel was injected in situ on the surface of the tracheal mucosa. After hydrogel stabilization, the trachea was repeatedly twisted, extruded, and bent to observe the adhesion of the hydrogel to the trachea. Furthermore, scanning electron microscopy (SEM, SU8010, HITACHI, Japan) was employed to observe the morphological characteristics of pure PH hydrogel and CuHP/PH composite hydrogel. For in vitro degradation analysis, CuHP/PH composite hydrogels (0.5CuHP/PH was taken as the representative) were immersed in phosphate buffer saline (PBS) solution with different pH conditions (pH = 7.4 and pH = 6) at 37 ℃ in a shaking bath. The residual hydrogels were photographed, and the mass of each hydrogel was weighted on days 0, 5, and 10, respectively. The degradation productions during the process were collected for further biological assay. Specifically, the released components in PBS with pH = 7.4 were collected for angiogenic assay, while the released components in PBS with pH = 6 were collected for antibacterial assay.
Bioactivity of CuHP/PH hydrogel on human umbilical vein endothelial cells (HUVECs) and tracheal epithelial cells (TECs)
100 µL CuHP/PH composite hydrogel were first injected into 96 well plates. After these hydrogel precursors gelled, 5 × 10³ cells/well HUVECs and TECs were seeded and cultured in an incubator (5% CO2) at 37 °C for 72 h with different hydrogel. Cell Counting Kit-8 (CCK-8) assay was used to determine the cellular viability by measuring the absorbance at 450 nm through the microplate reader at 24, 48 and 72 h (EPOCH2NS, BioTek, USA) [28].
To evaluate the viability of HUVECs and TECs after co-cultured with different hydrogel, the live/dead staining examined using a confocal microscope (Leica, TCS SP8 STED 3X) at 24, 48, and 72 h. F-actin and nuclei were stained with phalloidin (Yeasen) and DAPI to observe cell spreading at 48 h after cultured with PH and CuHP/PH hydrogel. Thereafter, the samples were observed and photographed using a confocal microscope (Leica, TCS SP8 STED 3X). To detect the reactive oxygen species (ROS) level in cells, ROS Kit purchased from Beyotime Biotechnology (Shanghai, China) was applied following the instruction manual. Furthermore, to evaluate the effect of different hydrogel on cell migration ability of HUVECs and TECs, 500 µL hydrogel was injected into 6 well plates to form a thin film to cover the bottom. Then, 5 × 10⁵ cells/well of HUVECs and TECs were seeded on the hydrogel. After incubating at 37 °C for 24 h, a line was scratched using a 10 µL pipet tip. The floating or dead cells were washed with PBS. The cells were then cultured with different hydrogels for an additional 24 h. The cell migration activity was determined using ImageJ software. An average migration rate was calculated by using the following formula:
$$\text =\left(\mathrm_0-\mathrm_1\right) / \mathrm_0 \times \%$$
where R0 is an initial scratch area and R1 is still the unhealed scratch area.
To analyze the gene expression levels of VEGF, Hypoxia-inducible factors-1α (HIF-1α), Endothelial NOS (eNOS) and Fibroblast growth factor 2 (FGF2), real-time polymerase chain reaction (RT-PCR) was carried out. HUVECs (2 × 10⁴ cells/well) were seeded in a 48-well plate for 24 h. Then, the cells were treated with different hydrogel for 48 h. A MolPure cell/tissue miRNA kit was used to extract total RNA of HUVECs. Then the RNA was reverse transcribed into cDNA using Hifair II 1st Strand cDNA Synthesis SuperMix (Yeasen Biotechnology, China). The mRNA levels for VEGF, HIF-1α, eNOS and FGF2 in various samples were determined by RT-PCR. The relative primers are listed in Table 1. The 2−△△Ct method was used to calculate the relative mRNA level of each gene, and GADPH was used as a reference gene.
Moreover, an in vitro vessel formation assay was performed using a Matrigel-coated plate. HUVECs were cocultured with different hydrogel for 6 h into a 48-well plate (5 × 10⁴ cells/well), and the formed tubes were observed and calculated by a microscope and the ImageJ software, respectively. Specifically, Angiogenesis Analyzer was utilized in ImageJ to quantify the number of branch points within the vascular network and determine capillary length within the vascular network.
In vitro antibacterial activity
To assess the in vitro antibacterial efficacy of 0.5CuHP/PH hydrogel against Escherichia coli (E. coli) and Staphylococcus aureus (S. aureus) bacteria, 200 µL different hydrogel samples were mixed with 1000 µL of bacterial solution (1 × 10⁶ cfu/mL) in sterile Eppendorf tubes. After incubation at 37 °C for 24 h in a shaker (120 rpm/minute), the bacterial suspensions from the three groups were cultured with SYTO-9 and propidium iodide (PI) at 4 ℃ for 20 min. Subsequently, 10 µL bacterial suspension was placed on a glass slide and overlaid with a coverslip. The fluorescent spots were visualized using a confocal microscope (Leica, TCS SP8 STED 3X).
In addition, samples from different groups were diluted 100-fold and plated for colony growth observation. Bacterial viability was calculated using the formula:
$$\text =\alpha / \beta \times \%$$
where α is the number of colonies with the treatment of PH and 0.5CuHP/PH hydrogel and β is the number of colonies in a blank solution, ImageJ was utilized for counting bacterial colonies.
Simultaneously, 200 µL of bacterial suspension from each group was added to a 24-well plate. Then, 1 mL of broth was added, and the mixture was incubated for 48 h. The resulting biofilm was washed twice with PBS, followed by staining with 100 µL of crystal violet for 10 min. After two additional PBS washes, the biofilm was documented through photography. Finally, the biofilm was dissolved in 200 µL of 95% ethanol, and the absorbance at 570 nm was measured using a microplate reader to evaluate the formed biofilm (EPOCH2NS, BioTek, USA) [29].
Establishment of rabbit tracheal mucosal injury model
24 male New Zealand White rabbits weighing 1.5–2.0 kg were obtained from Shanghai Jiagan Experimental Animal Raising Farm (Shanghai, China). All animal experiments were approved by the Shanghai Pulmonary Hospital Ethics Committee (K19-080Y). A total of 24 rabbits were randomly divided into three groups: Blank (Sample 1 to 8 for Blank group), PH (Sample 9 to 16 for Blank group), and 0.5CuHP/PH (Sample 17 to 24 for Blank group), with 8 rabbits in each group. To establish an experimental rabbit model for assessing tracheal mucosa regeneration, a modified surgery was performed based on previously described [30].
Briefly, a 2 cm incision was made along the center after sterilizing the rabbit’s neck skin. The inner muscle tissue was carefully dissected layer-by-layer. Subsequently, a partial transection of the trachea was performed at a gap approximately 1.5 cm above and below the exposed area, serving as a sham surgery group. The mucosal layer was delicately separated along both sides of the tracheal lumen using a surgical blade. The loose mucosa was then gently lifted with tweezers to create an epithelial defect of approximately 1.5 cm in length and 50% of the trachea’s circumference in width. The cut ends of the normal tracheal ring were connected for end-to-end anastomosis. 50 µL PH or 0.5CuHP/PH hydrogel were injected onto the site of tracheal mucosal injury. All rabbits received a course of penicillin for 7 days to prevent infection and were euthanized for analyses at 10 and 20 days post-operation. The survival rate was monitored over the 20-day period. Concurrently, fiberoptic bronchoscopic examinations and gross observations were conducted to assess intraluminal infection and stenosis in the experimental rabbits at 10 and 20 days.
Evaluation of tracheal mucosal regeneration and cartilage development in vivo circumstance
To assess mucosal regeneration and tracheal lumen status following treatment with various hydrogel for 10 and 20 days, collected samples at these time points were initially fixed in buffered 10% formalin in PBS for 72 h, followed by embedding in paraffin and sectioning into 5-mm sections. Masson’s Trichrome staining was employed to visualize collagen fibers. Mucosal regeneration and airway patency (mucosal injured areas compared to natural areas) were quantified separately and calculated by averaging 5 measurements on each sample. Specifically, samples collected at 10 and 20 days were cross-sectioned at the site of mucosal injury and in the natural area. Subsequently, the luminal diameters of the mucosal injury site and the natural area were measured. The degree of airway patency was calculated by using the following formula:
where D0 is inner diameter of natural areas and D1 is inner diameter of mucosal injury area.
After Masson’s staining, the thickness of the tracheal mucosa at the site of injury and in the natural mucosa was observed and measured under a microscope. The degree of mucosal regeneration was calculated by using the following formula:
where T0 is mucosal layer thickness of natural areas and T1 is mucosal layer thickness of mucosal injury area.
Hematoxylin and eosin (HE), Safranin-O, and Masson’s Trichrome staining were utilized to evaluate tracheal structure, cartilage, and fibrous extracellular matrix (ECM) deposition. Collagen II expression was assessed via immunostaining using a rabbit polyclonal antibody targeting collagen II (ab34712, 1:100, Abcam, Cambridge, UK), followed by incubation with a horseradish peroxidase-conjugated anti-rabbit antibody (1:100, Dako, Denmark). Both antibodies were diluted in PBS and visualized using diaminobenzidine tetrahydrochloride (DAB, Dako). Biochemical evaluations related to cartilage, such as glycosaminoglycan (GAG) and total collagen contents, were performed using the dimethylmethylene blue assay (Sigma-Aldrich) and enzyme-linked immunosorbent assay, respectively.
Mechanical test
The adhesive properties of PH and CuHP/PH hydrogels were evaluated using a biomechanical analyzer (Instron-5542; Canton, USA). PH and CuHP/PH hydrogels were applied to two pieces of porcine skin tissue measuring 3 × 1 cm each, with an overlapping length of 1 × 1 cm between the two tissue pieces. After allowing for a 10-minute static period, a tensile test was performed at a rate of 2 mm/min with a 10 N load, extending to a length of 10 mm, and force-displacement data were recorded.
Following the collection of samples at 10 and 20 days, the surrounding soft tissues were carefully removed to isolate pure cartilage tissue. Subsequently, cartilage specimens from both the mucosal injury and natural areas were cut into rectangular shapes measuring 2 × 2 mm. After measuring the height of these cubes, a compression test was conducted using a biomechanical analyzer (Instron-5542; Canton, USA) equipped with a 10 N load cell, at a constant cross-head speed of 2 mm/min. The compression depth was set to 50% of the initial height of the samples. The biomechanical analyzer recorded the force-displacement curves in real time. Compressive Young’s modulus was calculated according to the force-displacement curves for statistical analysis [31].
Evaluation of epithelial regeneration, revascularization, infection, and inflammatory reactions
To further evaluate in vivo epithelial regeneration, revascularization, infection, and inflammatory reactions following treatment with different hydrogel for 10 and 20 days, histological slides were subjected to dewaxing, followed by antigen retrieval using citrate buffer. Immunofluorescence staining for Cytokeratin (Servicebio, GB122053) was utilized to assess regenerated epithelium. Immunohistochemical staining for CD31 (Servicebio, S1002) was performed to observe blood vessels. Blood vessels were counted under a 200× magnification field, with at least five random fields counted.
The mRNA levels for VEGF, eNOS and FGF2 in various samples were determined by RT-PCR according to the standard protocol as mentioned above. Fluorescence in situ hybridization (Servicebio, Eub338) staining was employed to evaluate bacterial distribution. Furthermore, to assess the inflammatory reaction, immunofluorescence staining for Tumour Necrosis Factor-α (TNF-α, Servicebio, GB11188) and Interleukin-1β (IL-1β, Servicebio, GB11113) was conducted. Random images of at least five fields were captured at 200× magnification, and the percentage of positive area relative to the total image area was calculated using ImageJ.
Statistical analysis
The mean ± standard deviation was employed to present all quantitative data (n ≥ 3). Statistical analyses were carried out using GraphPad Prism 8.0 software (USA). The mean values of the study parameters were compared using analysis of variance (ANOVA). A statistical significance level of p < 0.05 was considered significant, denoted by * in the figures.


Comments (0)