
Remember me
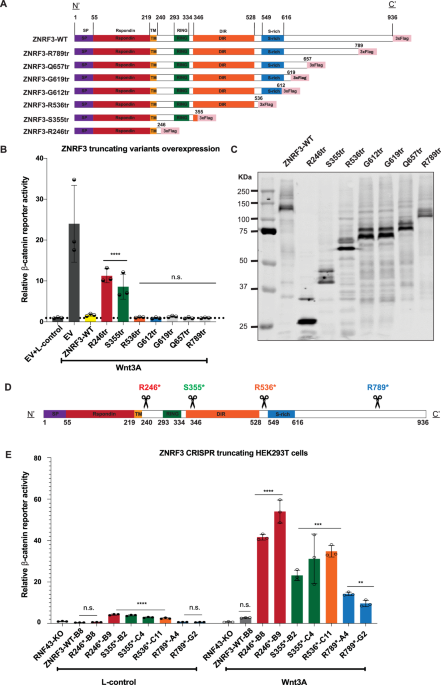
ERBB3 has a somatic mutation frequency of 2.1% in pan-cancer analysis with relatively high frequencies observed e.g. in urothelial (7.3–9.8%), endometrial (8.2–12.8%), lung (1.4–8.8%), and colorectal (5.4–6.2%) cancer (cbioportal.org) [23, 24]. Among the 821 observed unique genetic ERBB3 alterations, the cBioPortal database lists only eight missense mutations as oncogenic and 41 variants affecting 11 additional amino acid residues as likely oncogenic (Supplementary Fig. 1).
Modified cell model for screening of activating variants of the ERBB3 pseudokinaseMurine lymphoid Ba/F3 cells were selected as the cellular background for screening activating ERBB3 mutations as we have previously used the model to screen for activating EGFR [25] and ERBB4 [26] variants. The fact that the Ba/F3 cells are critically dependent on exogenous IL-3 for survival and that this dependency can be substituted by ectopic expression of an active RTK [27], allows the use of the cells for a functional readout of RTK-driven growth. However, overexpression of even the well-characterized oncogenic E928G variant of ERBB3 was not sufficient to promote IL-3-independent Ba/F3 cell growth (Fig. 1A), as expected for a pseudokinase in the context devoid of endogenously expressed heterodimeric partners. These observations indicated that Ba/F3 background could not be used to address differential transforming potential of ERBB3 variants in the absence of a kinase-competent partner to heterodimerize with ERBB3.
Fig. 1: A Ba/F3 cell-based model sensitive to the transactivation potency of ERBB3 variants.
A, B Ba/F3 cells expressing the indicated ERBB3 variants (A) or co-expressing the activator-incompetent ERBB2 V956R together with the indicated ERBB3 variants (B) were cultured in the presence or absence of IL-3 or the ERBB3 ligand NRG-1. Cell viability was assessed from quadruplicate samples with MTT assay. Mean and SD from an experiment representing one of three independent analyses is shown. C Schematic illustration of the constructs used for the analyses. The ERBB2 V956R variant (mutation indicated with a red star) cannot serve as the activator kinase and therefore is not capable of stimulating downstream signaling when present as an ERBB2 V956R homodimer. Wild-type (wt) and mutant ERBB3 variants, however, can serve as the activator kinase for ERBB2 V956R – the potency putatively depending on the nature of the mutation – when stimulated by the NRG-1 ligand. ERBB3 homodimers, in contrast, are all expected to be inactive due to their inherently impaired kinase activity.
To modify the model with simultaneous co-expression of ERBB2, but to limit the role of ERBB2 to only serve as the receiver kinase in the ERBB3/ERBB2 dimer, a ERBB2 V956R mutant variant [28,29,30] was introduced to the Ba/F3 cells (Fig. 1B, C; Supplementary Fig. 2A, B). We had previously demonstrated that co-expression of wild-type ERBB2 together with wild-type ERBB3 in the same model was sufficient to readily promote IL-3-independent growth [31], precluding the use of wild-type ERBB2 as the heterodimer partner. The V956R variant with a valine-to-arginine mutation in the C-lobe of the ERBB2 kinase domain disrupts the capability of the receptor to serve as an activator but does not interfere with its function as a receiver in the transactivation process between two ERBB kinases (Fig. 1C). The “activator-incompetent” V956R was therefore also expected to be incapable of transactivating ERBB2 in a homodimeric ERBB2/ERBB2 complex. Consistent with reduced potential of the ERBB2 V956R mutant in transforming the Ba/F3 cells, it did not promote IL-3-independent growth even in the context of co-expression with wild-type ERBB3 when the complex was not activated by the NRG-1 ligand (Fig. 1B). However, indicating a window for a functional read-out, introducing the oncogenic mutant ERBB3 E928G together with the activator-incompetent ERBB2 V956R did result in IL-3-independent growth (Fig. 1B). The approach also seemed to differentiate between ERBB3 variants with variable transactivation potencies, as the other known oncogenic variants G284R and V104M were clearly less potent as compared to E928G in promoting growth and ERBB3 phosphorylation (Supplementary Fig. 2A, B).
An expression library of randomly mutated ERBB3 variantsTo perform an unbiased screen to study thousands of ERBB3 mutations in a high-throughput assay, a randomly mutated ERBB3 cDNA library was created with error-prone PCR, as previously described for the iSCREAM pipeline [25, 26]. As a result, the average mutation frequency in the cDNA library (pDONR221-ERBB3 library) was estimated to be 1.3 mutations per a 4 029 bp ERBB3 cDNA insert by Sanger sequencing. The cDNA library was subsequently cloned into a pBABE-gateway retroviral mammalian expression vector. To characterize the distribution of ERBB3 variants in the library, the ERBB3 insert from the pBABE-puro-gateway-ERBB3 library was PCR amplified and deep sequenced using Illumina NovaSeq6000 platform. The analysis indicated that the library was comprised of 9 013 unique ERBB3 single nucleotide variants out of the 12 088 theoretically possible (74.6%). The resulting amino acid alterations indicated the presence of 8 055 out of the 8 276 theoretically possible amino acid changes (derived by altering a single nucleotide in a codon), resulting in the coverage of 97.3% of all possible ERBB3 missense or nonsense mutations. Specific missense or nonsense mutation distribution and different transition and transversion mutation distributions are shown in Supplementary Fig. 3.
Functional genetics screen with the modified iSCREAM pipelineThe ERBB3 mutation library was transduced into Ba/F3 cells expressing ERBB2 V956R. Cells expressing the mutant expression library or wild-type ERBB3 were cultured in the presence or absence of IL-3, in the presence of 20 ng/ml of the ERBB3 ligand NRG-1 without IL-3, or in the presence of 20 ng/ml of NRG-1 without IL-3 for 48 h prior to complete depletion of both IL-3 and NRG-1 from the culture medium. Pre-incubation for 48 h with NRG-1 was carried out to up-regulate ERBB3 expression and activity in the infected cells (Supplementary Fig. 4) [32]. The cells expressing the ERBB3 mutation library were able to survive in the complete absence of both IL-3 and NRG-1, while all cells expressing wild-type ERBB3 died (Supplementary Fig. 5). These observations indicated that the ERBB3 cDNA library included variants that promoted Ba/F3 cell growth by transactivating ERBB2 V956R.
To identify ERBB3 variants enabling Ba/F3 cell transformation, genomic DNA was extracted from the surviving cell populations and the ERBB3 cDNA inserts were PCR amplified and deep sequenced (>1,300,000×) on Illumina NovaSeq6000 platform. The read counts specific for each ERBB3 coding sequence variant (normalized to total number of reads at each ERBB3 locus) in the surviving cell populations were compared to the original transduced IL-3-dependent cell populations, and the enrichment of each specific mutation (fold change) as well as the relative variant frequency of each mutation in the surviving cell pool was estimated (Supplementary Information).
ERBB3 variants promoting Ba/F3 cell transformationThe combined results from three independent samples demonstrated that cDNAs encoding 18 ERBB3 missense variants were enriched by at least 25-fold in the Ba/F3 cell populations surviving in the absence of all exogenous ligands (Fig. 2). Seven of the mutations (P212L, Y265C, L361P, L482P, A676T, D797V, and E928G) were enriched by over >100 fold (Fig. 2). The known oncogenic variant E928G was one of the main hits in the screen, validating the approach. In addition, the 18 enriched variants included the missense mutations K329R and E332K annotated as likely oncogenic by cBioPortal (Supplementary Fig. 1).
Fig. 2: In vitro screen of activating mutations (iSCREAM) of ERBB3.
The enrichment of specific ERBB3 mutations in the Ba/F3 cell model is demonstrated as a scatter plot. Ba/F3 cells were transduced with constructs encoding 8 055 different missense or nonsense mutations of ERBB3 together with the activator-incompetent ERBB2 V956R. Observed fold change in the variant frequency of a mutation in the surviving cell pool when compared to the variant frequency of the same mutation in the IL-3-dependent population is shown on the y-axis. The position of the mutated residue on the ERBB3 primary sequence is shown on the x-axis. Variant frequency of the mutation in the final surviving cell pool is depicted with the size of the dot as well as with the intensity of its red color. The dashed horizontal line indicates the fold change level of 25. A pooled analysis of three different experiments is shown. In the independent analyses, the cells were first cultured in the absence of IL-3 with or without 20 ng/ml NRG-1 for two days and subsequently for 15–48 days in the absence of both IL-3 and NRG-1.
To validate the hits, 14 individual ERBB3 mutations, each reaching the enrichment level of at least 25 fold, were selected and transduced into Ba/F3 cells either alone or together with ERBB2 V956R. The 14 variants included all seven with enrichment of over 100 fold, as well as seven others from the group of 11 reaching the enrichment level of 25–100-fold.
When expressed in Ba/F3 cells alone, none of the 14 mutants was able to promote IL-3-independent growth (Supplementary Fig. 6A, B), consistent with the lack of dimerization partner to serve as target for transactivation by ERBB3. However, when co-expressed with the activator-incompetent ERBB2 construct (Supplementary Fig. 6B), expression of E332K, A676T, or E928G induced emergence of IL-3-independent clones (Fig. 3A). When ERBB3 expression was first boosted by a 48-h incubation in the presence of 20 ng/ml of NRG-1 (Supplementary Fig. 4), three additional ERBB3 mutants, K279N, N353T, and D797V, reproducibly also promoted IL-3-independence (Fig. 3A). Importantly, however, in none of the experimental repeats did an IL-3-independent clone emerge from vector- or wild-type ERBB3-transduced clones, regardless of the presence or absence of the heterodimerizing partner ERBB2 V956R.
Fig. 3: Validation of growth-promoting activity of ERBB3 variants.
A Ba/F3 cells expressing the indicated ERBB3 variants in the presence of the activator-incompetent ERBB2 V956R were cultured in the presence of IL-3 or 20 ng/ml NRG-1, or in the absence of both (no ligand). The rightmost panel demonstrates an experiment in which the ERBB3 expression was first boosted by NRG-1 stimulation in the absence of IL-3 for two days followed by maintenance in the absence of both ligands. Cell viability was assessed from quadruplicate samples with MTT assay. Mean and SD from an experiment representing one of four independent analyses is shown. B MCF-10A cells expressing the same heterodimeric receptor complexes as in A, were cultured in the absence of serum and in the presence or absence of 50 ng/ml NRG-1 for 0, 2, 4, or 6 days. Cell viability was assessed from quadruplicate samples with the MTT assay. Mean and SD from an experiment representing one of three independent analyses is shown. *P < 0.05; **P < 0.01; ***P < 0.001; unpaired two-sample t-test. C Focus formation analysis of NIH 3T3 cells expressing the same heterodimeric receptor complexes as in (A). The cells were cultured on 6-well plates for 2 weeks and stained with crystal violet. D Quantification of the focus formation data, such as shown in (C). The area covered by foci was analyzed with ImageJ plugin ColonyArea. Mean and SD from four independent experiments are shown. *P < 0.05; **P < 0.01; ***P < 0.001; unpaired two-sample t-test.
The L361P mutant seemed to have a slightly aberrant molecular weight in western analyses (Supplementary Fig. 6B), and flow cytometry using an antibody against the extracellular domain of ERBB3 demonstrated lack of the epitope at the cell surface (Supplementary Fig. 6C), consistent with defective maturation and translocation of the variant to the cell surface. All the other ERBB3 mutants were present at the cell surface at similar levels when analyzed by flow cytometry (Supplementary Fig. 7).
Functional validation of the ERBB3 variants in MCF-10A and NIH 3T3 cellsThe 14 ERBB3 mutations selected for further functional characterization were also tested for activity in human MCF-10A mammary epithelial cells and mouse NIH 3T3 fibroblasts. Again, when expressed alone, none of the variants were able to promote survival of serum-starved MCF-10A cells (Supplementary Fig. 8A, B). However, when analyzed in MCF-10A cells co-expressing ERBB2 V956R (Supplementary Fig. 8C), the presence of 50 ng/ml of NRG-1 significantly enhanced the survival and proliferation of cells expressing the ERBB3 variants K279N, E332K, N353T, L482P, A676T, and E928G (Fig. 3B). No significant ligand-independent growth advantage was observed for any of the ERBB3 variants in MCF-10A background (Fig. 3B).
To address the ability of the ERBB3 variants to promote focus formation in NIH 3T3 fibroblasts, the cells infected with retroviruses encoding the different ERBB proteins were seeded in 6-well plates and cultured in 3% serum for two weeks. When expressed alone, the ERBB3 variants K279N, E332K, H584L, and D797V were able to promote formation of foci that covered significantly more area than foci formed by cells expressing wild-type ERBB3 (Supplementary Fig. 9A–C). However, more potent focus formation was observed when ERBB3 variants were analyzed in cells co-expressing ERBB2 V956R (Fig. 3C, D; Supplementary Fig. 9D), and a greater number of ERBB3 variants demonstrated activity. Indeed, 11 out of the 14 hits selected for validation showed transforming activity in the focus formation assay, including P212L, Y265C, K279N, K329R, E332K, N353T, L482P, H584L, A676T, E928G, and C1241R (Fig. 3D).
ERBB3 mutations demonstrating activity across different cell backgroundsStatistical analysis of the growth assays repeated for 3 to 8 times demonstrated that five of the 14 hit variants consistently promoted growth when co-expressed with ERBB2 V956R in all the three cell backgrounds studied (Fig. 4). These were K279N, E332K, N353T, A676T, and E928G. The ERBB3 variant L482P also showed enhanced growth compared to the wild-type cell line in MCF-10A and NIH 3T3 cells but promoted emergence of an IL-3-independent Ba/F3 clone in only one out of eight experiments, not reaching statistical significance. In addition, six variants, P212L, Y265C, K329R, H584L, D797V, and C1241R promoted some activity in two cell backgrounds but reached significance only in one. Only the ERBB3 variants L361P and D1259Y were unable to stimulate growth across all the three cell line models. The mutations were relatively ineffective when expressed alone, with the exception of K279N, E332K, H584L, and D797V that induced statistically more colony formation in NIH 3T3 cells also without concomitant ERBB2 V956R overexpression (Supplementary Fig. 9A, B), suggesting that ERBB3 pseudokinase mutants can harbor gain-of-function properties in cells that, unlike the Ba/F3 cells, express other ERBBs endogenously.
Fig. 4: Summary of growth-promoting activity of ERBB3 variants.
A heat map presentation of growth promoted by ERBB3 variants when expressed alone (top half) or together with the activator-incompetent ERBB2 V956R (bottom half) in Ba/F3, MCF-10A or NIH 3T3 cells. Ba/F3 cell growth data was normalized from 8 independent MTT experiments in which cells were cultured in the absence of IL-3 after NRG-1 priming, MCF-10A data from 3 independent MTT experiments (+NRG-1), and NIH 3T3 data from 4 independent focus formation experiments. The Ba/F3 data were analyzed as binary – growth or no growth – with white color in the heat map indicating growth in 0/0 experiments and red growth in 8/8 experiments (*P < 0.05; Wilcoxon rank sum test). MCF-10A and NIH 3T3 data are presented as continuous with white color indicating minimal and red maximal growth (*P < 0.05; two-sample t test).
Long-read sequencing identifies co-occurring mutationsAs the mutation frequency in the mutation library was higher than 1 change per ERBB3 cDNA (i.e. 1.3), the clonal evolution of Ba/F3 cells could favor enrichment of cDNAs that harbor multiple ERBB3 mutations in cis. Relatively weak mutations could also function synergistically to achieve transforming activities. To address whether composite ERBB3 mutations occurred in cis during the clonal evolution in the Ba/F3 screen, the samples analyzed with Illumina NGS – producing reads with the length of approximately 100 bp – were reanalyzed with PacBio High-Fidelity Circular Consensus Sequencing [33] producing reads covering the whole ERBB3 inserts.
Indeed, when sequencing reads coding for any of the 18 variants enriched by ≥25-fold in the Ba/F3 screen were analyzed, only 28.0% of the full-length reads included only a single ERBB3 mutation (Fig. 5A; Supplementary Information). Instead, 40.0% of the samples included another missense ERBB3 mutation, and 32.0% three or more co-occurring mutations. This distribution of single vs. multiple mutations was significantly different from those ERBB3 mutations that were only enriched by 1–25 fold in the Illumina NGS analysis (P = 0.015; Pearson’s Chi-squared test) that more frequently occurred alone (Fig. 5A). Of the 14 variants that were functionally validated, only ERBB3 K279N, N353T, and E928G were predominantly found to be present alone, suggesting that the activity of these mutations did not benefit from additional mutations (Fig. 5B, C). Interestingly, these three mutations composed three out of the five mutations with most consistent functional activity in the validation analyses carried out by expression constructs verified to include only single ERBB3 mutations (Fig. 4). The rest of the mutations co-occurred along with one or several other ERBB3 mutations in cis in the same sequencing reads (Fig. 5B, C).
Fig. 5: Co-occurring ERBB3 mutations.
The samples analyzed with an Illumina NGS platform were re-analyzed with PacBio sequencing producing reads covering the whole ERBB3 inserts. A The genotypes of full-length sequencing reads including any one of the 18 ERBB3 mutations that were enriched by ≥25-fold in the iSCREAM by Illumina NGS (Fig. 2) were compared with the full-length reads including any of the 155 mutations that were enriched by values between 1 and 25 and had a variant frequency of >1 in Illumina data. The percentages of mutations occurring either alone, in cis with one other ERBB3 mutation, or in cis with two or more other ERBB3 mutations is indicated. B The 14 ERBB3 mutations that were selected for functional analyses were analyzed for mutations co-occurring in cis within the same ERBB3 reads. Observed maximal fold change enrichment in the IL3-independent population is shown on the y-axis (log10) for mutations occurring alone, in cis with one other ERBB3 mutation, or in cis with two or more other ERBB3 mutations. The cut-off of fold change value of 25 is depicted with the dotted line. C Table listing the co-mutational context and numeric fold change enrichment of the 14 ERBB3 mutations depicted in panel B.
Functional significance of mutation co-occurrenceTo test the hypothesis that some of the ERBB3 variants with weak individual transforming potential functioned synergistically with another alteration to gain activity, the following co-occurring mutations were selected for further analysis: P212L + Y265C + A676T, P212L + Y265C + D797V, P212L + Y265C, L361P + L482P, K329R + E332K + C1241R, K329R + C1241R, K329R + E332K, E332K + H584L, and H584L + D1259Y (Fig. 5B, C). To express the double mutations in cis in the same receptor, the mutations were cloned into the same cDNA molecules. The activity of the double or triple mutations in promoting cell survival and growth was then analyzed in Ba/F3 cells as above and compared to the respective single mutations. In Ba/F3 cells, four sets of co-occurring mutations demonstrated significantly enhanced growth as compared to cells expressing the mutants alone (Fig. 6; Supplementary Fig. 10A). These included K329R + E332K, E332K + H584L, K329R + C1241R, and K329R + E332K + C1241R, suggesting that co-mutations complementing K329R or E332K promoted additional activity. However, none of the compound mutations including P212L or Y265C supported growth significantly better than A676T alone, indicating that A676T was not functionally substantiated by additional mutations. Similar to the analyses of single mutants, the activity was restricted to the context of simultaneous overexpression of ERBB2 V956R (Supplementary Fig. 10B). No enhanced growth was observed with cells expressing the double mutant L361P + L482P that, resembling the cells expressing the single mutant ERBB3 L361P, seemed to possess less transforming activity as compared to cells expressing L482P alone (Fig. 6). The L361P + L482P double mutant also phenocopied L361P alone in aberrant migration of the ERBB3 band in western analyses and low or no ligand-stimulated ERBB3 phosphorylation (Supplementary Fig. 6B, Supplementary Fig. 8B, C, Supplementary Fig. 9C-D, Supplementary Fig. 10A), consistent with lack of L361P cell surface expression (Supplementary Fig. 6C).
Fig. 6: Growth promoted by multiple mutations of ERBB3.
A Ba/F3 cells expressing the indicated ERBB3 variants in the presence of the activator-incompetent ERBB2 V956R were cultured in the presence of IL-3 or 20 ng/ml NRG-1, or in the absence of both (no ligand). The rightmost panel demonstrates an experiment in which the ERBB3 expression was first boosted by NRG-1 stimulation in the absence of IL-3 for two days followed by maintenance in the absence of both ligands. Cell viability was assessed from quadruplicate samples with MTT assay. Mean and SD from an experiment representing one of four independent analyses is shown. In panel A, the symbols are colored based on the ERBB3 variant, in B based on the number of mutations in the ERBB3 insert. C Statistical analysis of eight independent analyses carried out as in A. Data are presented as violin plots. Cell clones that did not demonstrate growth within 100 days were all given the value 100 for “Days to proliferation”. *P < 0.05; **P < 0.01; ***P < 0.001; Wilcoxon rank sum test.
Transforming ERBB3 variants facilitate receptor dimerizationThe 14 ERBB3 mutations identified in our screen were mainly clustered in the extracellular domain and kinase regions (Fig. 7). For example, based on the recent cryo-EM ectodomain structures of ERBB2-ERBB3 [34], K279 is located in domain II of ERBB3 just after the dimerization arm, at the beginning of module 5, a module in direct contact with the dimerization arm of ERBB2, thereby potentially affecting dimer formation and stability; it is known that modules 2–7 of domain II are sensitive to alterations as demonstrated by the oncogenic mutation S310F of ERBB2 that directly stabilizes the dimerization arm of ERBB3 [34]. Between the TM helices and kinase domains, the A676T variant may favor the asymmetric, active conformation of the kinase domain through increasing the stability of the JM region. Improved hydrogen bonding is possible based on e.g., the analysis of an Alpha fold model (AF-P21860-F1): an intrasubunit hydrogen bond may form between the side-chain oxygen atom of A676T and both the side-chain nitrogen of R679, conserved in all ERRB receptors, and the main-chain oxygen atom of Q672. The E928G has been previously described as an activating mutation elsewhere [35, 36]. The possible functional consequences of all the missense mutations as analyzed by molecular modeling are listed in the Supplementary Information.
Fig. 7: Structural modeling of ERBB3 mutants.
The overall composite model was derived using the experimental ERBB2:ERBB3 ectodomain with bound neuregulin-1 (NRG-1) cryoEM structure (PDB:7MN5), TM (transmembrane)-helix NMR structure (ERBB3:ERBB3; PDB:2L9U) and the asymmetric kinase domain X-ray structure (EGFR:ERBB3; PDB:4RIW). For the intrinsically disordered/missing regions (A676T, C1241R and D1259Y), the figure is based on an AlphaFold model (PDB:AF_AFP21860F1). Y265C (zoomed view) was prepared using the dimerization arm stabilizing mutant structure of ERBB2:ERBB3 (PDB:7MN6). ERBB3 domains I-IV are labeled. Residue numbering is based on the full-length sequence of ERBB3 (Uniprot: P21860). The ERBB3 mutations were created using Pymol (The PyMOL Molecular Graphics System, Version 2.4 Schrödinger, LLC.); the rotamers were chosen based on visual inspection.
To experimentally address whether the three variants K279N, A676T, and E928G promoted receptor dimerization, NIH 3T3 cells overexpressing the ERBB3 variants alone or together with the ERBB2 V956R variant, were treated for ten minutes with or without 10 ng/ml NRG-1 and subjected to cross-linking with the membrane impermeable compound BS3. Subsequent western analyses demonstrated that all three variants significantly enhanced formation of readily phosphorylated receptor dimers including ERBB3 (Supplementary Fig. 11), consistent with the transforming mutations promoting ERBB3 heterodimerization.
Sensitivity of mutant ERBB3 transactivation to ERBB inhibitorsThe potential to pharmacologically target the identified ERBB3 variants and to use them as predictive biomarkers for ERBB inhibitors was assessed using the Ba/F3 cell model. As ERBB3 variants alone did not promote ERBB3-dependent growth, and as there are no clinically approved drugs available that would directly block ERBB3, the analyses were carried out in cells co-expressing ERBB2 V956R. In accordance with this approach, the ERBB2/ERBB3 heterodimer has been shown to be an actionable target for ERBB2 antibodies [14, 17, 37, 38]. The cells were cultured for 72 h in the presence of different concentrations of the ERBB2 antibodies trastuzumab or pertuzumab, or the second-generation ERBB tyrosine kinase inhibitor neratinib. The two antibodies did not show an effect for any of the cell lines regardless of the ERBB3 variant expressed when the cells were stimulated with 20 ng/ml NRG-1 for the duration of the experiment (Fig. 8A, B; Supplementary Fig. 12A). This was demonstrated by IC50 values remaining at the >10 µg/ml level, similar to treatment of cells without any ERBB3 expression (vector control) that were cultured in the presence of IL-3, consistent with the well-documented role of NRG-1 in promoting resistance to ERBB inhibitor drugs [19, 39,40,41]. When the cells were cultured in the absence of NRG-1, significantly lower IC50’s were observed (in the 1–100 ng/ml range) but the sensitivity was similar between all ERBB3 variants (Fig. 8A, B; Supplementary Fig. 12B).
Fig. 8: Sensitivity of the ERBB3 variants to ERBB inhibitors.
Ba/F3 cells expressing the indicated ERBB3 variants in the presence of the activator-incompetent ERBB2 V956R were cultured in the presence or absence of 20 ng/ml NRG-1 (without IL-3) and treated with trastuzumab (A), pertuzumab (B), or neratinib (C) for 72 h. Cells transduced with an empty vector and cultured in the presence of IL-3 served as a control for off-target toxicity. Cell viability was assessed from triplicate samples with MTT assay. The dots indicate mean IC50 values calculated from three independent experiments. In the absence of NRG-1, all treatments resulted in significantly (P < 0.05 with unpaired two-sample t test) reduced IC50’s when compared to cells expressing wild-type ERBB3 and stimulated with NRG-1, with the exceptions indicated by red circles. In the presence of NRG-1, all cell lines were resistant to all drugs (P ≥ 0.05 for IC50 compared to wild-type ERBB3 + NRG-1) with the exception indicated with blue dots. No lines surviving the absence of NRG-1 and IL-3 could be established from cell populations expressing wild-type ERBB3, or the L361P, H584L, C1241R, D1259Y or H584L/D1259Y mutation. *P < 0.05 for comparison of IC50 to all single mutations included in the triple mutant variant.
However, when the cells were treated with the TKI neratinib, two of the single ERBB3 mutations, P212L and L482P, as well as the two double mutants P212L + Y265C and L361P + L482P, were resistant even in the absence of NRG-1 (Fig. 8C; Supplementary Fig. 12). The P212L and L482P mutations are located respectively on domains II and III, on either side of the NRG-1 binding site, and hence may result in a receptor conformation mimicking the NRG-1 bound state and leading to resistance to neratinib even in the absence of NRG-1. Cells expressing either of the two double mutations L361P + L482P and H584L + D1259Y were also outliers as they demonstrated moderate, but statistically significant, sensitivity to neratinib also in the presence of NRG-1.
To study the drug responses at the molecular level, phospho-western analyses were also conducted for most of the transforming ERBB3 variants using the Ba/F3 model (Supplementary Fig. 13). As expected, no significant differences were observed between the variants while all displayed suppressed ERBB and AKT phosphorylation in response to the treatments. Taken together, these observations suggest that all the ERBB3 variants can be targeted in ERBB3/ERBB2 heterodimeric complexes with anti-ERBB antibodies or TKI’s but that the sensitivity may depend on the availability of activating ligands in the tumor microenvironment.
Comments (0)