Cell culture and reagents
Human prostate cancer (PCa) PC-3, DU145, LNCaP, and prostate stromal cell line (CRL-3290™ hTERT PF179T, PrSC) were purchased from the American Type Culture Collection (ATCC, Manassas, VA). Normal prostate stromal cells (nPrSC) and optimized culture media (Clonetics™ SCGM™ Stromal Cell Growth Medium) were purchased from Lonza (Walkersville, MD). Luciferase-expressing PC-3 M-luc-C6 cell line was purchased from PerkinElmer (Waltham, MA, USA). Recombinant human IGFBP2 (rIGFBP2), recombinant human transforming growth factor β (rTGF-β) and recombinant human IGF1 (rIGF1) were purchased from R&D Systems (Minneapolis, MN, USA). TGF-β inhibitor Pirfenidone was purchased from Selleck (Kanagawa, Japan).
SiRNA constructs
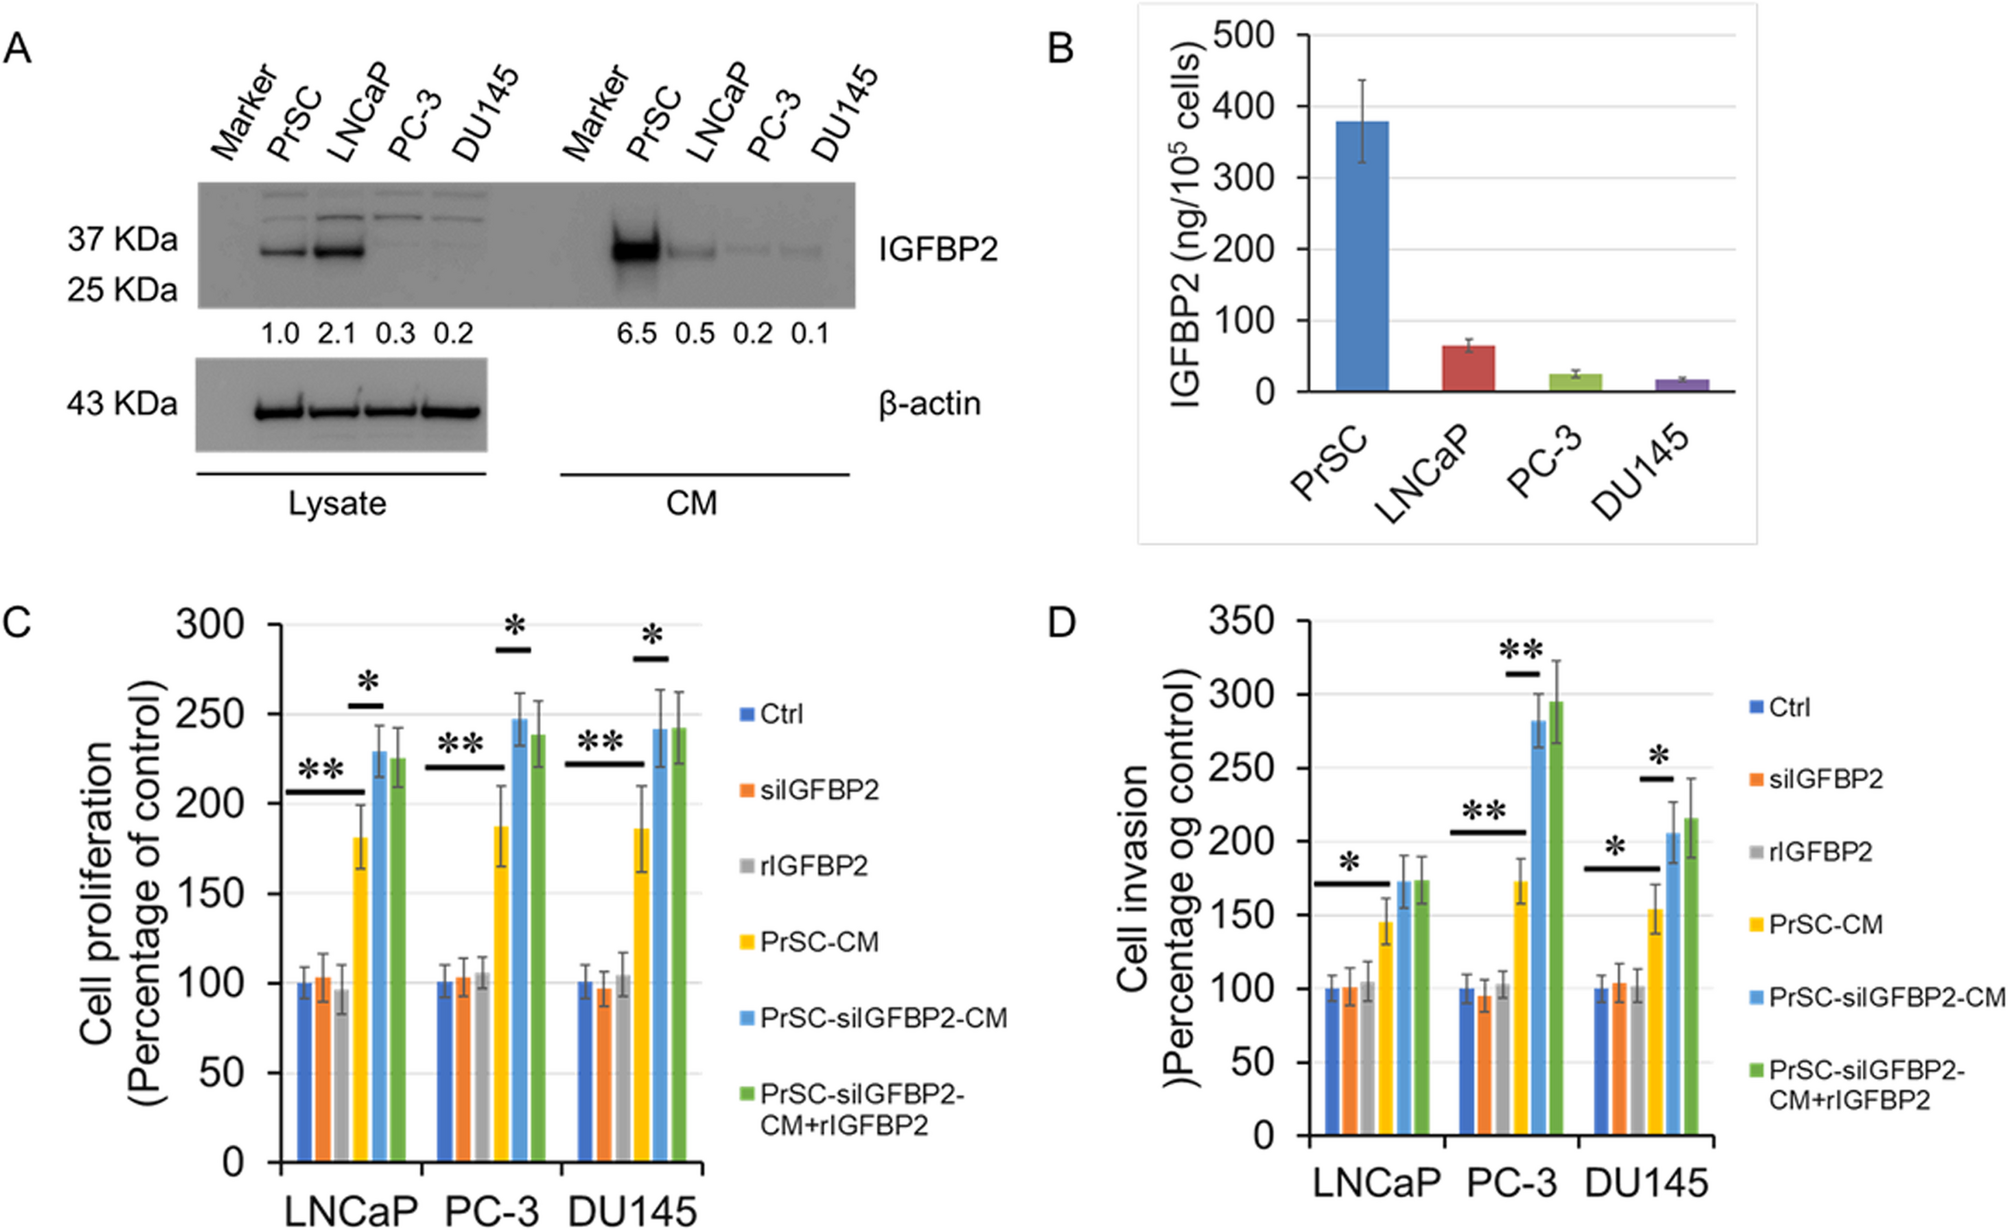
IGFBP2 siRNA-A (HSS142627), siRNA-B (HSS142629), siRNA-C (HSS179811), and luciferase siRNA (SI03650353) were purchased from Qiagen (Valencia, CA, USA). Luciferase siRNA was used as a control. Transfection of siRNAs was done using Lipofectamine 2000 (Invitrogen). The cells were cultured in a 35-mm dish and treated with 100 nM siRNA in Dulbecco’s modified Eagle’s medium (DMEM) containing 2% fetal bovine serum (FBS). IGFBP2 knockdown was assessed by western blot analysis.
Cell proliferation assay
A total of 1 × 10⁴ PCa cells were seeded into 96-well plates and cultured in DMEM containing 2% FBS without antibiotics. The cells were then treated with or without 100 nM siRNAs, 100 ng/ml rIGFBP2, or culture in the conditioned medium of prostate stromal cells (PrSC CM or nPrSC CM) for 24 h. In some experiments, the prostate stromal cells were pretreated with or without 100 nM siIGFBP2 for 24 h. Cell proliferation was assessed using a nonradioactive 3-(4,5-dimethylthiazol-2-yl)−2,5-diphenyltetrazolium bromide (MTT)-based cell proliferation assay kit (Roche, Basel, Switzerland). Briefly, 10 µl of MTT (5 mg/ml) was added to each well and incubated for 4 h at 37 °C. Next, 100 µl of sodium dodecyl sulfate was added to each well and incubated for 24 h at 37 °C. The absorbance was measured at 570 nm using an ELISA reader (Bio-Rad, Tokyo, Japan). Trypan blue staining assay was used for the direct assessment of the PCa cell viability. A total of 4 × 10⁴ cells were seeded in 24-well plates and cultured with DMEM containing 2% FBS without antibiotics. Cells were then treated with 100 nM siRNAs, 100 ng/ml rIGFBP2, or were cultured in the PrSC CM for 24 h. After harvesting, the cells were stained with trypan blue solution (Sigma-Aldrich). A TC20 automated cell counter (Bio-Rad) was used for counting the viable cells. All experiments were performed in triplicates.
Matrigel invasion assay
The in vitro invasion assay was performed in triplicate using Growth Factor Reduced BD BioCoat Matrigel Invasion Chambers (BD Biosciences), based on the manufacturer’s instructions. Briefly, 5 × 10⁴ cells were seeded in the upper compartment with medium containing 2% FBS with or without 100 nM IGFBP2 siRNAs (siIGFBP2), or 100 ng/ml rIGFBP2, PrSC (or nPrSC) CM. For some experiments, the PrSC (or nPrSC) cells were pretreated with or without 100 nM siIGFBP2 for 24 h. Subsequently, 20% FBS DMEM was placed in the lower compartment and cultured for 24 h. The non-invading cells were removed, and the membranes were stained with a Diff–Quik cell-staining kit (Sysmex, Kobe, Japan) to count the invading cells. The experiments were performed in triplicate.
Quantitative RT-PCR
Total RNA was extracted from cultured cells using TRIzol® reagent (Invitrogen). The following RT-PCR primers were used:
IGFBP2, forward 5’- AGGGCACTTGTGAGAAGCG − 3’, reverse 5’-GTTCATGGTGCTGTCCACGT-3’; interleukin-8 (IL-8), forward 5’-ATGACTTCAAGCTGGCCGTGG-3’, reverse 5’-CATAATTTCTGTTTGGCGCA-3′; IL-6, forward 5’-GCTTTAAGGAGTTCCTGC-3’, reverse 5’-GGTAAGCCTACACTTTCCA-3’; and β-actin, forward 5’-ATCTGGCACCACACCTTCTA-3’, reverse 5’-CGTCATACTCCTGCTTGCTGA-3’. The experiments were performed in triplicate.
Western blot analysis
Proteins were isolated from culture cells and supernatants. Equal amounts of protein or culture medium were separated by SDS–PAGE and transferred to PVDF membranes (ATTO Instruments, Tokyo, Japan). The membranes were blocked for 1 h at RT with 1% nonfat dry milk in PBS containing 0.1% Tween 20, and were subsequently incubated for 1 h at RT using anti-IGFBP2, anti-αSMA, anti-TGF-β, or anti-β-actin (Cell Signaling Technology, Beverly, MA) antibodies, diluted 1:1000 in blocking buffer. The membranes were washed and incubated with goat anti-rabbit IgG coupled to horseradish peroxidase (1:2000, Santa Cruz Biotechnologies). Proteins were visualized using an ECL system (Amersham Biosciences) and quantified by densitometry. The bands were quantified using CS Analyzer (2.0) software (ATTO).
Proteome profiler human cytokine array
The proteome profiler human cytokine array kit was purchased from R&D Systems, Inc. (Minneapolis, MN, USA), and consists of 36 different antibodies against each cytokine spotted in duplicate onto membranes for semi-quantitative detection. The experiments were performed according to the manufacturer’s instructions. Briefly, array membranes were incubated for 1 h in a blocking buffer and incubated with 1.0 ml of conditioned medium collected from PrSC cells treated with siIGFBP2 or control siRNA (siCtrl) for 24 h. The membranes were washed and incubated with biotinylated antibodies for 1 h at RT. The membranes were washed and detected by incubation with a peroxidase-labeled streptavidin solution diluted to 1:1,000 for 30 min. The protein signals were captured using a CCD camera system AE-9300 Ez-Capture MG (ATTO Instruments, Tokyo, Japan)., and the signal intensity was quantified and scored using Densitograph software (ATTO). Fold-changes between the samples were calculated and analyzed using the method provided by R&D Systems Proteome Profiler Array Analysis.
IGFBP2 levels in the serum and conditioned medium
The Institutional Review Board of the Akita University School of Medicine approved all experiments, and samples were obtained after written informed consent. Human serum samples were obtained from 168 PCa patients and 40 healthy controls. The mean age and BMI levels of the PCa patients were 67. 9 ± 5.5 years, 24.1 ± 2.2 kg/m2, respectively, while those of the healthy controls were 61.1 ± 14.8 years and 22.6 ± 3.1 kg m2, respectively. The serum samples were obtained from the patients before they underwent anticancer therapy. IGFBP2 levels in the serum and conditioned medium of PrSC and tumor cells were measured using a sandwich ELISA (R&D Systems), based on the manufacturer’s instructions.
Histopathological analysis
Slides containing tissue samples from the radical prostatectomy specimens were obtained from Akita University Hospital. Immunohistochemical expression of IGFBP2 and αSMA in human PCa tissues were evaluated using a rabbit anti-human IGFBP2 polyclonal antibody (1:50, Cell Signaling) and rabbit anti-αSMA (1:100, Abcam), as previously described [17]. The expression levels were scored by investigators (MH and HN) who were blinded to the patients’ background and clinicopathological information. IGFBP2 staining intensities in the cancer and stromal cells were scored on a semiquantitative scale as follows: 1, low; 2, medium; and 3, high. The percentage of αSMA-positive cells in the stroma was evaluated and divided into low (⩽ 5%), medium (5–20%), and high (> 20%) groups based on the proportion of positive cells.
Animal study
All animal experiments were approved by the Institutional review board of the Akita University School of Medicine. Eight-week-old male Balb/c nu/nu mice (Japan SLC, Tokyo, Japan) were used for the in vivo experiments. Using a 27-gauge needle, 5 × 10⁶ PC-3 M-luc-C6 cells were intraperitoneally injected with 5 × 10⁵ of PrSCs that had been pretreated with 100 nM of siCtrl or siIGFBP2 for 24 h. After the intraperitoneal injection of luciferin (200 µl at 15 mg/ml in PBS), the tumor cell expansion was evaluated using bioluminescence. Xenogen IVIS™ imaging system was used to measure the reflective luciferase activity (60-s exposure) on the 12th day following inoculation of the cells. The mice were subsequently sacrificed, followed by the excision of the xenograft tumors for histopathological analysis (three mice per group).
Statistical analyses
All statistical analyses were performed using the SPSS version 12 software. The data were presented as the mean ± SD. Statistical significance was evaluated by an unpaired Student’s t-test for comparisons between two or three means in each experiment. Differences among three or more groups were determined using a one-way ANOVA or the Kruskal–Wallis test for continuous variables. Differences were considered statistically significant at P < 0.05.


Comments (0)