
Remember me
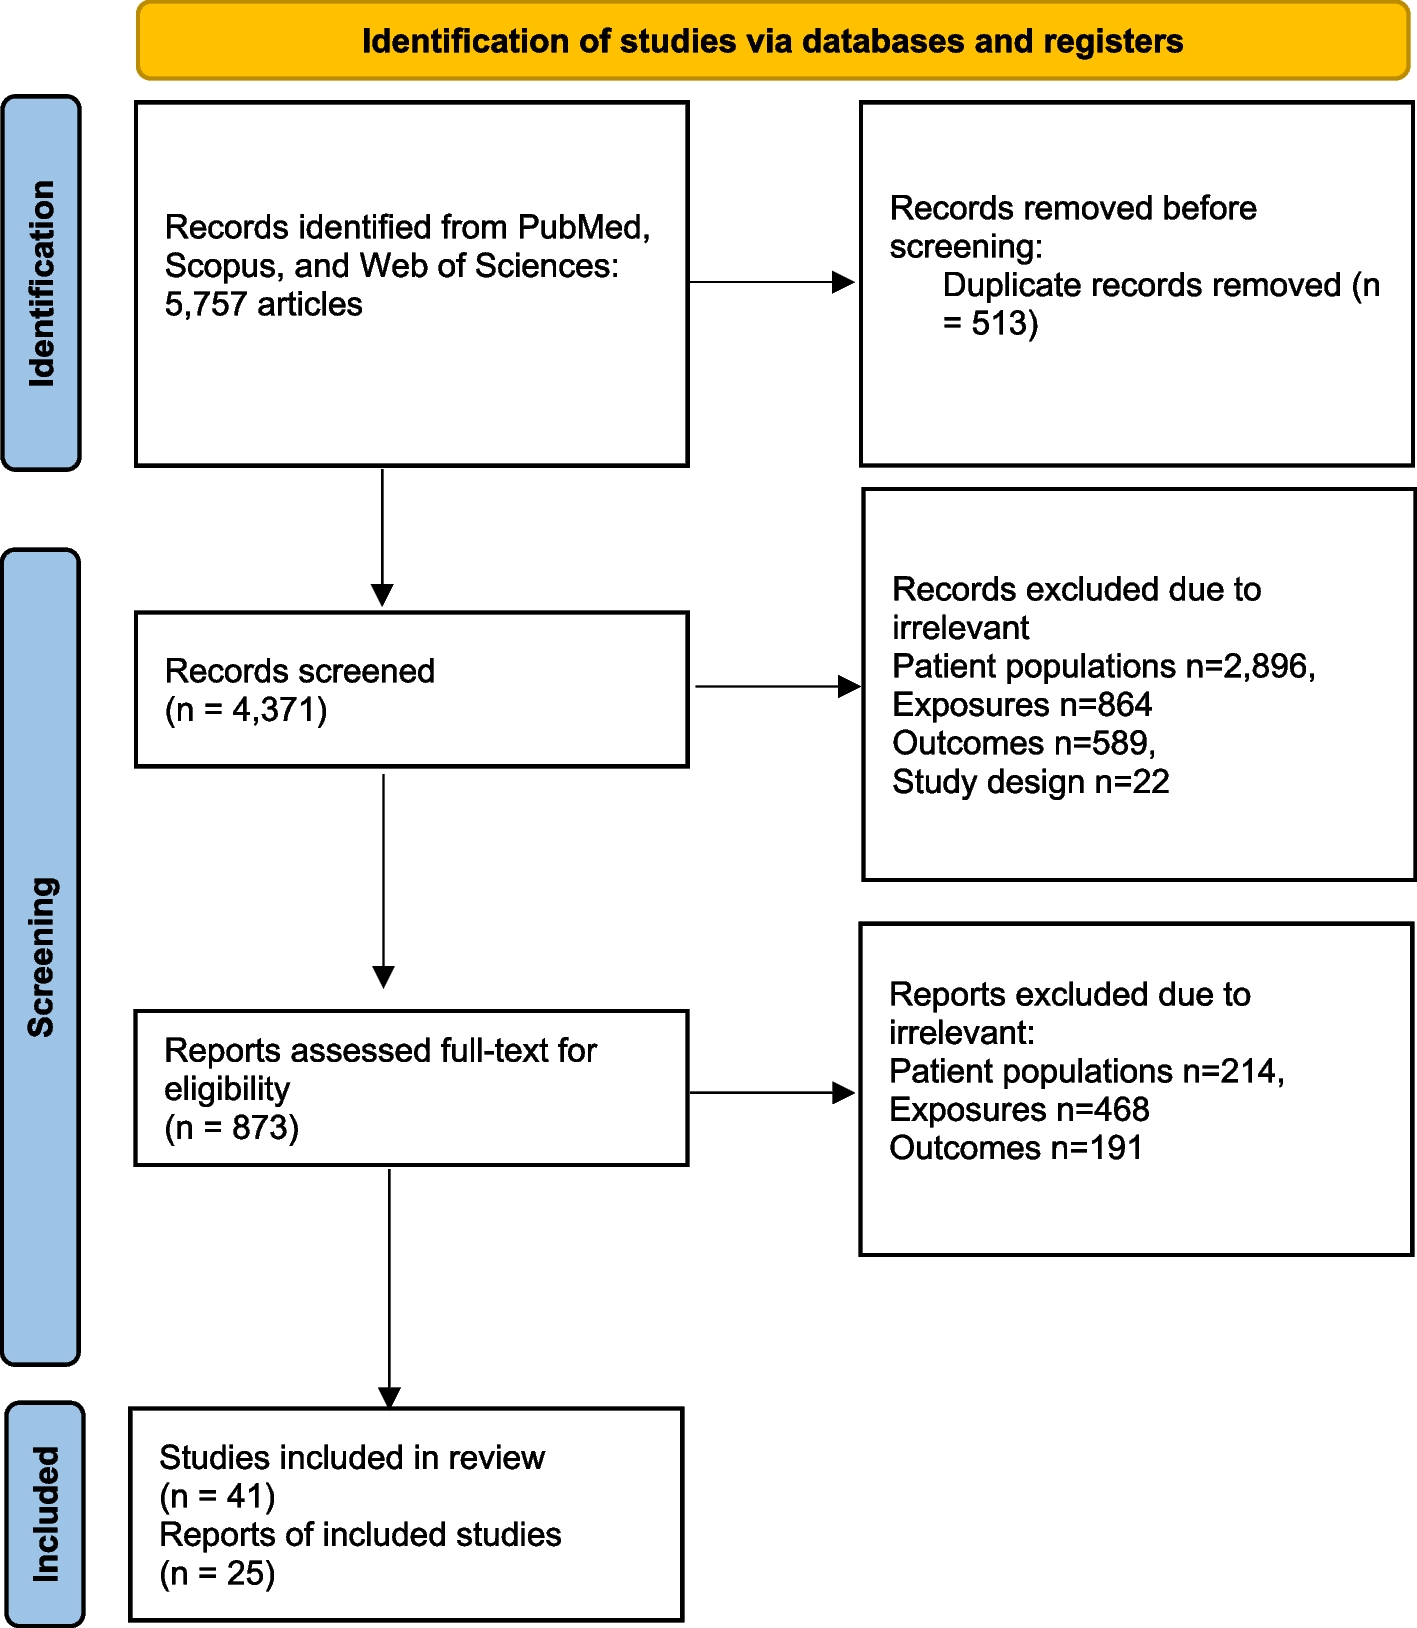


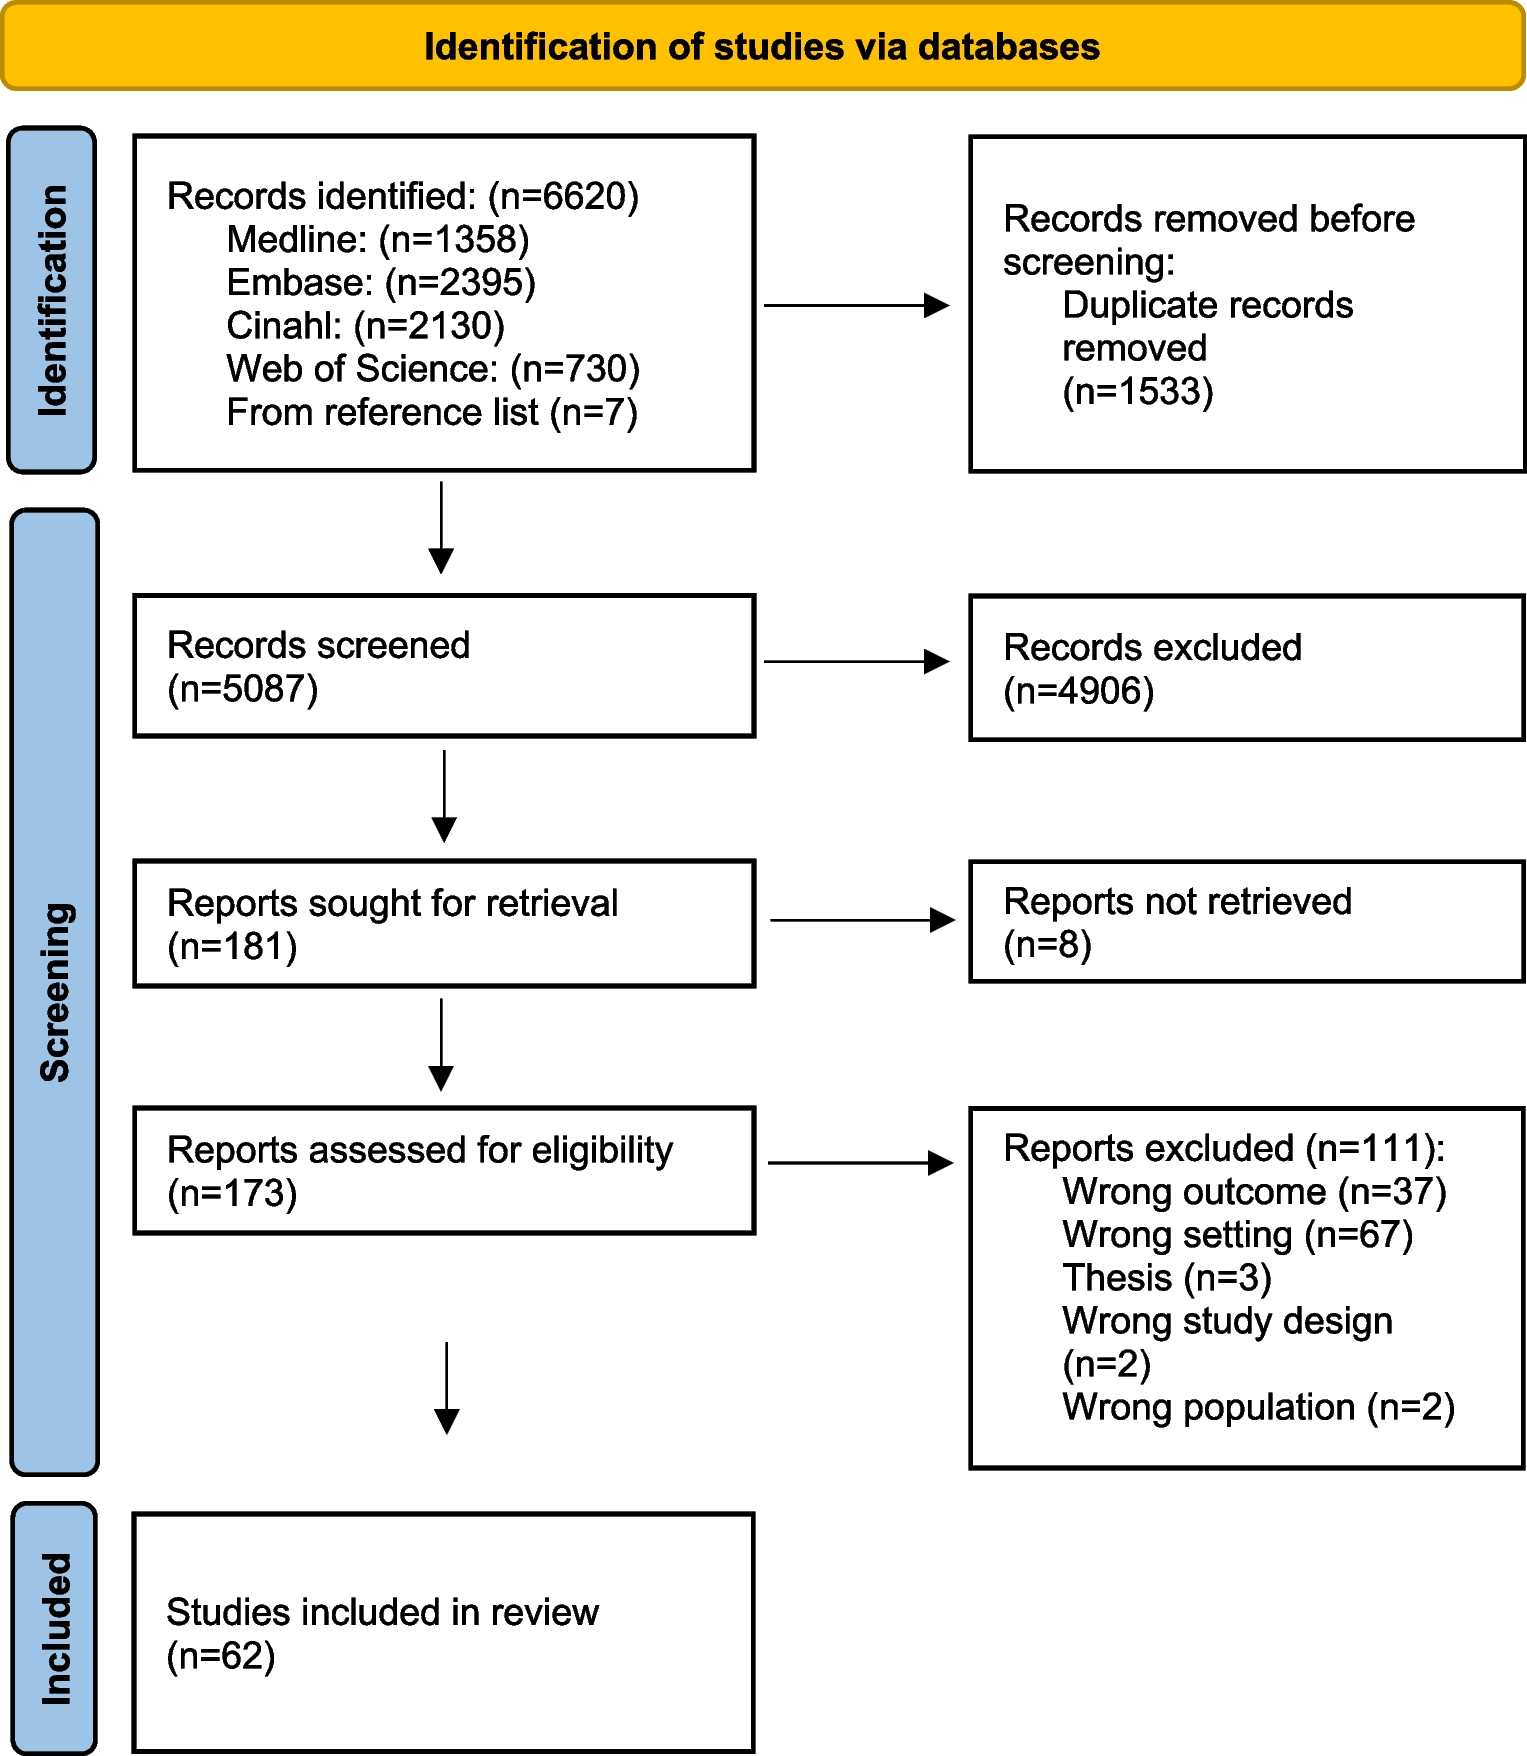

Figure 1 shows that 5,757 articles were included in the first search for this systematic review. In the next step, 513 studies were identified as duplicates. Following the evaluation of titles, abstracts, and keywords, 4,371 articles were excluded due to irrelevant patient populations (n = 2,896), exposures (n = 864), outcomes (n = 589), or study design (n = 22). Furthermore, 873 articles that initially met the inclusion criteria were re-evaluated with full-text assessment, 41 articles were included in this systematic review, and 25 studies were considered in this meta-analysis. Table 1 presents the characteristics of the included articles.
Fig. 1
PRISMA flowchart illustrating the selection process of studies, from initial identification (5,757 articles) to final inclusion in the systematic review (41 articles) and meta-analysis (25 studies)
Table 1 Characteristics of the included studies in the systematic reviewSystematic reviewTable 1 shows the study characteristics. The studies were published between 2001 and 2024. The sample size was 908 (min = 31, max = 939). Among the reviewed articles, all of them were conducted in cohort design, and 16 studies had sample sizes of less than 100 participants. There were 17 studies between 101 and 200 participants, 2 studies between 201 and 300 participants, and 6 studies with sample sizes of more than 300 participants. The included studies were published in China (18 studies) [9, 19,20,21,22,23,24,25,26,27,28,29,30,31,32,33], South Korea (7 studies) [34,35,36,37,38,39,40], Japan (5 studies) [41,42,43,44,45], Germany (3 studies) [46,47,48], the USA (2 studies) [49, 50]. Other countries, Switzerland [51], Spain [52], Sweden [53], Egypt [54], Brazil [55], and Taiwan [56], were each study 1.
The mean/median age of participants was distributed between 51 and 70 years old, and cancer types of participants included lung cancer (7 studies), breast cancer (6 studies), colorectal cancer (5 studies), ovarian cancer (5 studies), gastric cancer (4 studies), pancreatic cancer (3 studies), oral squamous cell carcinomas (2 studies), rectal cancer (2 studies), bladder cancer (2 studies), hepatocarcinoma (2 studies), ampullary carcinoma (1 study), esophageal cancer (1 study), and nasopharyngeal carcinoma (1 study) (Table 1).
Surgical interventions were the most common treatment, among 23 studies that described treatment; 10 studies just investigated surgery as treatment [19, 24, 27, 30, 31, 38, 40, 53, 54, 57], 9 studies combined surgery and chemotherapy [23, 28, 33, 42, 43, 45, 47, 48, 52] and chemotherapy-only treatments were observed in 4 studies [25, 49, 50, 56]. In addition, 41 studies reported the FAP-α detection method. All of the included studies employed immunohistochemistry as an assessment method of FAP-α expression level, and 12 studies used a combination of methods, including immunohistochemistry with other techniques such as western blotting, RT-qPCR, ELISA, PET/CT, and flow cytometry (Table 1).
Risk of bias assessmentThe risk of bias assessment showed that most studies had a low risk of bias in group comparability, exposure measurement, and outcome reliability. However, a high risk of bias was observed in confounder control and follow-up completeness, with several studies lacking proper adjustments or having incomplete follow-up data and unclear risk in handling missing data and follow-up sufficiency (Table 2).
Table 2 Risk of bias assessment using the joanna briggs institute (JBI) critical appraisal checklist for cohort studies [9, 22,23,24,25,26,27,28,29,30,31,32,33,34,35,36,37,38,39,40,41,42,43,44,45,46,47,48,49,50,51,52,53,54,55,56,57]Meta-analysis resultsThe pooled HR of the included studies is reported in Table 3 and Fig. 2. The overall crude HR (univariable analysis) of high FAP-α in poor survival of participants was 1.49 (95% CI: 1.19 − 1.85); in other words, the hazard of participants with high FAP-α was 1.49 times or 49% higher than participants with low FAP-α (P < 0.001). Also, the pooled adjusted HR was 1.53 (95% CI: 1.16 − 2.03, P = 0.003), the pooled HR of disease-free survival of participants was 1.36 (95% CI: 0.750 − 2.469, P = 0.311), and the pooled HR of progression-free survival of participants was 6.62 (95% CI: 5.84 − 7.50, P < 0.001). In addition, the pooled HR of poor survival in participants with lymph node metastasis (LNM) was 2.053 (95% CI: 1.603 − 2.630, P < 0.001) compared with participants without LNM, and the HR for participants with distant metastasis (DM) was 2.63 time (95% CI: 1.902 − 3.637, P < 0.001) compare with participants without DM (Table 3, Fig. 2) (Supplementary 2).
Table 3 Pooled hazard ratios (HRs) for overall survival, disease-free survival (DFS), lymph node metastasis (LNM), and distant metastasis (DM) based on high FAP expression compared to low FAP expressionFig. 2
Forest plot illustrating the pooled HRs for A crude overall survival, B adjusted overall survival, C disease-free survival, D in patients with lymph node metastasis, and E distant metastasis, F progression-free survival among participants with high vs. low FAP expression HR
Heterogeneity assessmentThe heteroge
Comments (0)