
Remember me
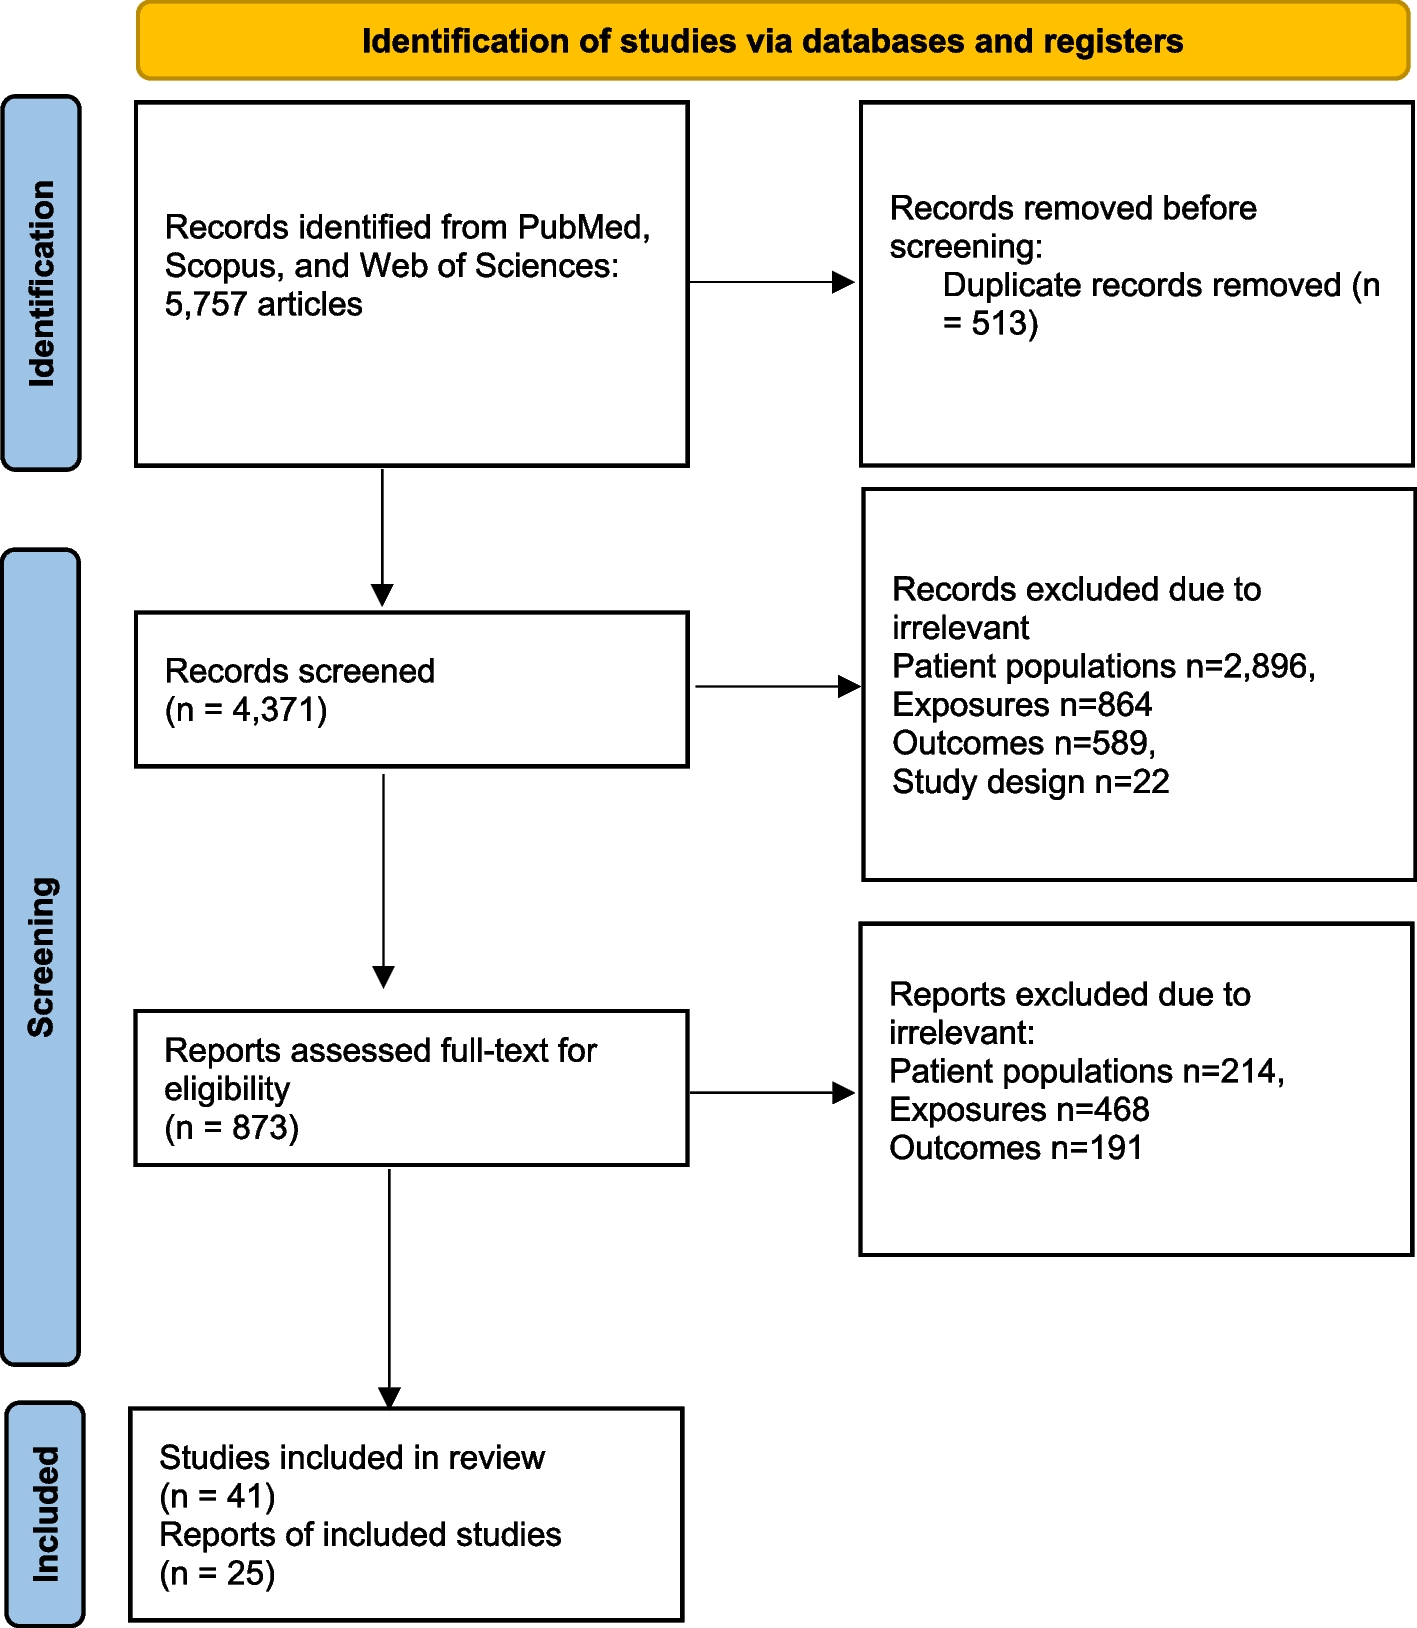


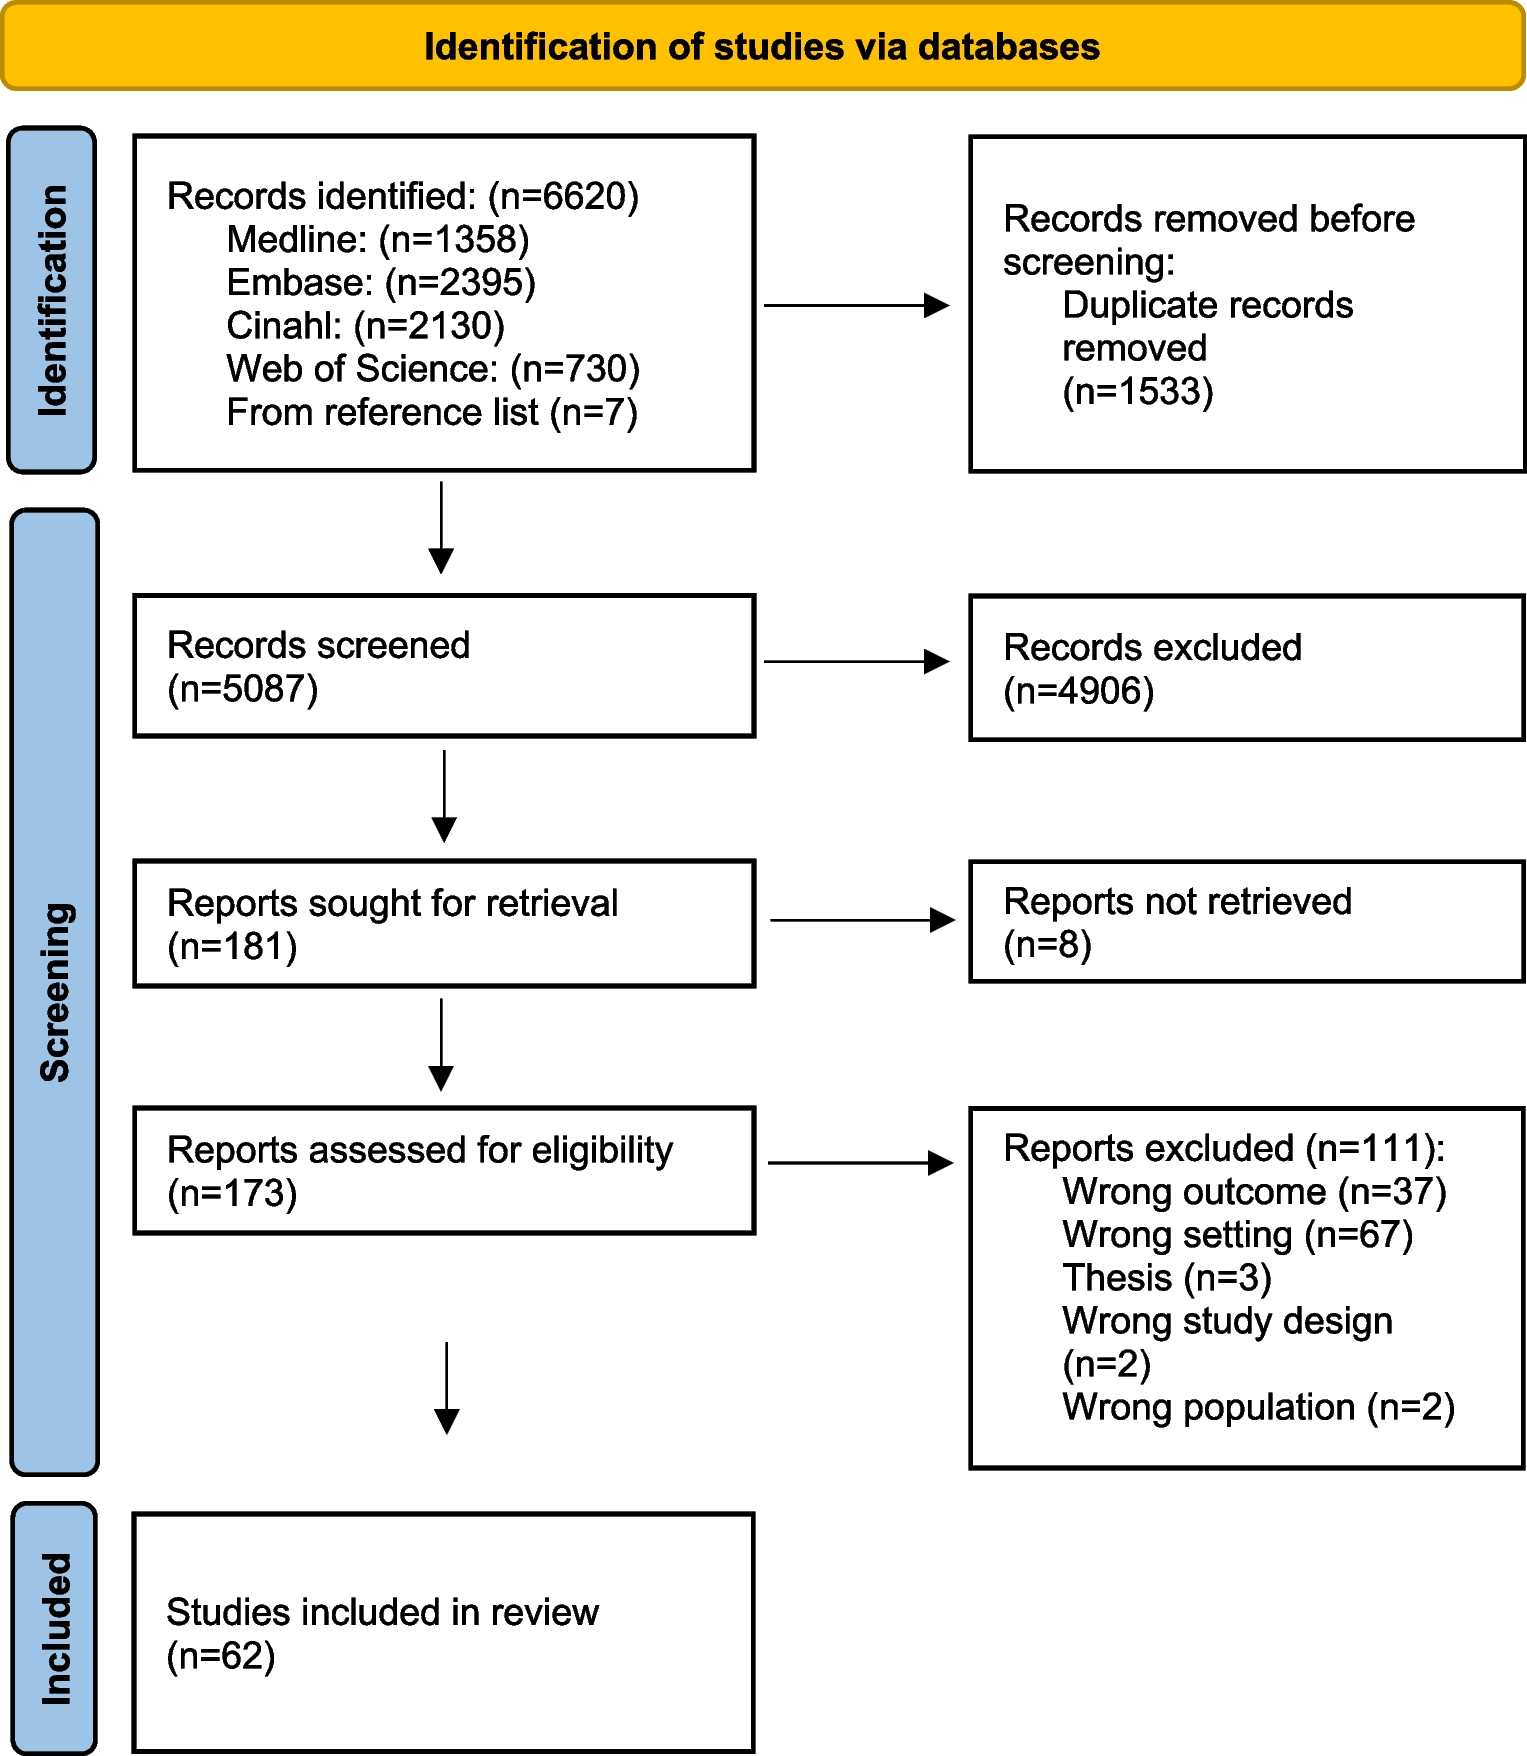

One thousand thirty-three articles were identified. Of this, 1016 were excluded, and only seventeen were included in the final synthesis. A summary of the data extraction processes is outlined in Fig. 1.
Fig. 1
Flow diagram for data selection. Adapted from The PRISMA 2020 statement: an updated guideline for reporting systematic reviews [40]
Characteristics of excluded studiesWe failed to retrieve the full-text article for two studies. The other excluded studies had no abstracts or full-text available, no results for controls, poster presentations, beta thalassemia studies, only sickle cell traits (HbAS) without HbSS or studies of HbSS without HbAA controls for comparison, as shown in the Supplementary file 2.
Characteristics of included studiesMost of the studies were conducted in Nigeria (n = 08). All the studies were observational studies with low sample sizes (ranging between 40 and 340). Liver and renal function tests are shown in Tables 1 and 2, respectively. Different authors used different units of measurement for the tests. For example, some authors used IU/L (international unit per liter of blood) [7, 19], µmol/L [20], and others used µkat/L (microunit per liter) [11] to measure liver enzymes. The final results reflected here were converted to most units used by other authors using an online tool at ScyMed® [43]. Details are found in Supplementary file 4. All liver enzyme units were converted to IU/L.
Table 1 Liver function tests of people with sickle cell disease in AfricaTable 2 Renal function tests of people with sickle cell disease in AfricaRisk of biasROBINS-E, a tool for assessing the risk of bias in non-randomized studies of exposure effects [42], was used to assess the risk of bias. Seven risks of bias domains were identified and assessed online using ROBINS-E. There were overall some concerns about the risk of bias, as shown in Fig. 2, details in Supplementary file 3.
Fig. 2
Assessment of risk of bias of non-randomized studies of exposure effects using ROBINS-E [42]
Most studies (10 out of 17) reported statistically significant differences between the people with SCD (HbSS) (exposed participants) and controls (HbAA). There were some concerns about the risk of bias, as summarized in Fig. 2 above.
Liver function in people with sickle cell disease in AfricaThe studies [7, 11, 19,20,21,22] revealed that people with SCD in Africa were more likely to have elevated liver enzymes than controls. The studies considered serum aspartate transaminase (AST), alanine transaminase (ALT), and alkaline phosphatase (ALP) results from six and four studies, respectively [7, 11, 19,20,21,22], as shown in Table 1.
The finding showed that AST’s random effect pooled mean difference was not statistically significant (MD = 8.62 IU/L, 95% CI − 2.99–20.23, I2 = 97.0%, p < 0.01). However, most studies revealed that the people with SCD had a higher serum AST level than the control group. Notably, substantial heterogeneity (I2 > 50%) was found. The details are in Fig. 3.
Fig. 3
Forest plot of serum AST of people with sickle cell disease compared to controls in Africa
Similarly, the random effect of pooled mean difference (M.D.) of ALT was not statistically significant (MD = 7.82 IU/L, 95% CI − 0.16–15.58, I2 = 99.0%, p < 0.01). The forest plot (Fig. 4) shows a higher serum ALT level among people with SCD than controls.
Fig. 4
Forest plot of serum ALT of people with sickle cell disease in Africa compared to controls
Findings from serum alkaline phosphatase (ALP) from four studies [7, 11, 19, 22] show a negative value of the random effect pooled mean difference (MD = − 2.54, 95% CI − 64.72–59.64, I2 = 99.0%, p < 0.01 IU/L). This could have been due to one study (Mohammed et al. 1992) [11] that had a relatively high mean value of ALP in the control group; the details are in Fig. 5. Due to the small sample size, inferential analysis of bias was not performed.
Fig. 5
Forest plot of serum ALP of people with sickle cell disease compared to controls in Africa
Renal function in people with sickle cell disease in AfricaThe studies [6,7,8,9,10,11,12,13,14,15,16,17,18] revealed that people with SCD in Africa may have a relatively compromised renal function. From the studies, three variables were used to evaluate the renal function in the study population, see Table 2.
The random effect pooled mean difference for serum creatinine from the eleven studies [6,7,8, 10,11,12,13,14, 16,17,18] is negative (MD = − 3.15, 95% CI − 15.02–8.72, I2 = 99%, p < 0.01) units. The forest plot is skewed to the left of the experimental group, which may indicate increased creatinine clearance among people with SCD. Details are in Fig. 6.
Fig. 6
Forest plot of serum creatinine for people with sickle cell disease compared to controls in Africa
In Fig. 7, the funnel plot shows only two studies under the “white” area, and the asymmetry was tested using Egger’s regression. The finding suggested no statistically significant risk of bias (t = 1.09, df = 9, p = 0.305).
Fig. 7
Funnel plot of serum creatinine for people with sickle cell disease compared to controls in Africa
When the data of serum urea was considered, the random effect pooled mean difference from seven studies [6,7,8, 11, 12, 16, 17] was − 0.57 (95% CI − 3.49–2.36, I2 = 99%, p < 0.01) units as can be seen in Fig. 8. Though not statistically significant, it may still show that people with SCD have nearly similar serum urea levels to those of the control group.
Fig. 8
Forest plot of serum urea of people with sickle cell disease compared to controls in Africa
Meanwhile, the random effect pooled mean difference of estimated glomerular filtration rate (eGFR) from seven studies [6, 9, 14,15,16,17] was positive (MD = 19.79, 95% CI 10.89–28.68 mL/min/1.73 m2, I2 = 87.0%, p < 0.01). This demonstrates that people with sickle cell disease have higher eGFR (M.D. of estimated glomerular filtration > 0) than the control group. However, there was substantial heterogeneity (I2 > 50%). Details are in Fig. 9.
Fig. 9
Forest plot of eGFR of people with sickle cell disease compared to controls in Africa
Comments (0)