
Remember me


The root’s thickness visibly increased with advancing growth years (Fig. 2). Observation of HuangQin slices revealed that from the third year onwards, the central hollow expanded with increasing growth years. Staining results indicated that one-year-old HuangQin slices displayed a single circle of red xylem, whereas two-year-old slices exhibited two distinct rounds of red xylem. Additionally, the central regions of one- and two-year-old HuangQin slices remained structurally intact. However, starting from the third year, a conspicuous black cavity emerged at the core of the slice, accompanied by the presence of three concentric rings of red xylem. Slices from the third and fourth years exhibited three and four rounds of red xylem, respectively. Remarkably, there was a progressively increase in the proportion of decay from the third to fourth year, accompanied by a color transition from brown to brownish-black. Overall, the phloroglucinol staining results provided unequivocal confirmation of HuangQin’s growth age.
Fig. 2
Photos of HuangQin samples and corresponding staining photos. a1, b1: HQ_1Y; a2, b2: HQ_2Y; a3, b3: HQ_3Y; a4, b4: HQ_4Y
The geographical locations of the FengXiang exhibits resulted in slight variations in precipitation and annual average air temperature over the course of four growth years (Stable 1). The third year shows the highest air temperature and land surface temperature, accompanied by the longest sunshine duration and ultraviolet radiation. The first year, however, exhibits the highest amount of precipitation (Stable 1).
Soil physical and chemical properties in different yearsThe physicochemical of the rhizosphere soil were analyzed to obtain a comprehensive understanding. The results revealed that the pH remained slightly alkaline and exhibited a slightly increased with increasing planting duration. The levels of SAK exhibited a gradual upward trend from the first year to the fourth year, while TN, TK, and AK displayed an initial increase over the first two years followed by a subsequent decline from the second to fourth years (Table 1). Conversely, TP, NH4+-N, AP, and SMC exhibited a declining trend from the first to second years, followed by an increase from the second to third years, and subsequently a decrease from the third to fourth years. On the other hand, AN, NO3-N, and acid-soluble potassium content increased from the first to second year, decreased from the second to third year, and then increased again from the third to fourth year. Overall, Soil-HQ_2Y exhibited the highest levels of TN, TK, AN, NO3-N and AK. Soil-HQ_3Y recorded the highest levels of TP and AP. In contrast, Soil-HQ_4Y displayed the highest levels of acid-soluble potassium, SAK, and pH value. Only NH4+-N content was found to be highest in Soil-HQ_1Y (SFig 1).
Table 1 Mineral element content in rhizosphere soil of HuangQin at different yearsMicrobial community structure of HuangQin planted in different yearsIn rhizosphere soil samples from the first year to the fourth year, the number of operational taxonomic units (OTUs) observed were 7594, 10,227, 10,280, and 9796, respectively (Fig. 3). Notably, Soil-HQ_3Y exhibited the highest number of OTUs, whereas Soil-HQ_1Y displayed the lowest count. The total OTU count increased from Soil-HQ_1Y to Soil-HQ_3Y, followed by a decrease from Soil-HQ_3Y to Soil-HQ_4Y. This pattern suggests an initial increase followed by a decrease in OTU count with increasing planting years of HuangQin, with a peak observed at 3 years. To delineate common and unique characteristics of soil microorganisms across different years, a Venn plot analysis was performed. The total number of common OTUs across all four groups was 2432, 32.03% (Soil-HQ_1Y), 23.78% (Soil-HQ_2Y), 23.66% (Soil-HQ_3Y), and 24.83% (Soil-HQ_4Y) of the total OTU in each group, respectively. And a total of 4636 OTUs were shared between Soil-HQ_2Y and Soil-HQ_3Y, whereas Soil-HQ_1Y and Soil-HQ_2Y exhibited the fewest shared OTUs, totaling 3430. Additionally, Unique OTU counts for Soil-HQ_1Y to Soil-HQ_4Y were 2835, 4474, 4275, and 4269, respectively. The results showed that the total number of bacterial OTU and the number of endemic bacteria in HuangQin soil at different growth years decreased with the increase of years. The soil bacterial species of Soil-HQ_1Y and Soil-HQ_2Y were the most different, and the soil bacterial species of Soil-HQ_2Y and Soil-HQ_3Y were the smallest, and nearly half of the bacterial species were the same. The above results indicated that planting years had a great effect on the amount of OTU in HuangQin soil.
Fig. 3
Temporal variations in soil microorganism’s populations as depicted by Histograms across multiple years. Abscissa, different groupings. Ordinate, number of OTUs
A total of 41 phyla, 78 classes, 159 orders, 298 families, 619 genera, and 380 species were detected in 4 groups of soil samples. Analysis of soil microorganism composition and structural changes across different years revealed the top 10 microflora at the phylum level (Fig. 4a), with varying abundance percentages. These included Myxococcota (2.20%−3.15%), Bacteroidota (1.75%−4.06%), Planctomycetes (3.91%−4.95%), Gemmatimonadota (3.74%−5.93%), unidentified_Bacteria (5.26%−7.36%), Crenarchaeota (3.13%−8.59%), Actinobacteria (7.45%−21.35%), Acidobacteriota (8.75%−15.14%), Actinobacteriota (11.47%−14.33%), and Proteobacteria (15.57%−32.13%). Notably, Proteobacteria, Actinobacteriota, Acidobacteriota, Actinobacteria and Crenarchaeota emerged as dominant bacterial phyla. Proteobacteria was the most dominant microbial group in the soil, with a relative abundance of 20.83%, proteobacteria is one of the most abundant bacterial groups in soil, and it participates in soil nutrient cycling through key links such as nitrogen cycle, sulfur cycle and phosphorus cycle [31], followed by Actinobacteriota, Acidobacteriota, Actinobacteria and Crenarchaeota, all of which accounted for about 12%. These five dominant groups together accounted for 58.07% of the total bacterial abundance. Actinobacteriota plays a variety of roles in soils, including participating in the decomposition of organic matter, participating in soil carbon, nitrogen, and sulfur cycling, and possibly promoting plant growth. These functions are essential for maintaining soil health and fertility [32]. Actinobacteria are abundant aerobic microorganisms in the soil, which can decompose organic matter, inhibit pathogenic bacteria, participate in nitrogen fixation and degradation of pollution, improve nutrient and mineral availability, promote plant growth, and do not pollute the environment, and maintain soil biological balance [33]. Moreover, the abundance of the five phyla Myxococcota, Planctomycetes, Crenarchaeota and Acidobacteriota increased year by year, reaching the highest value in the fourth year. The abundance of Bacteroidota, unidentified_Bacteria and Proteobacteria showed a decreasing and then increasing trend, among them, Bacteroidota and Proteobacteria both had only small increases, and they were still the most abundant in the first year. Finally, the abundance of Actinobacteria and Actinobacteriota showed a trend of first increasing and then decreasing. It can be seen that with the increase of planting years, the abundance of some beneficial bacteria such as Actinobacteria, Acidobacteriota and Proteobacteria in the soil decreases.
Fig. 4
Species composition and abundance of bacterial communities in the rhizosphere soil of Skullcap with varying cultivation durations (a: door level, b: genus level) c: ASV-based histogram of LDA value distribution. The displayed species exhibit an LDA score exceeding 4
At the genus level, Achromobacter was the dominant genus in the Soil-HQ_1Y bacterial community composition, with a relative abundance of 12.30% (Fig. 4b), followed by unidentified_Burkholderiaceae (4.08%), Pseudarthrobacter (2.68%), Solirubrobacter (0.86%), Gaiella (1.68%), Blastococcus (0.82%), Sphingomonas (0.70%), Nocardioides (0.66%), Haliangium (0.63%) and unidentified_Methylomirabilota (0.54%). Among the Soil-HQ_2Y bacterial community composition, Pseudarthrobacter was the dominant genus with a relative abundance of 13.25%, followed by Gaiella (1.81%), Blastococcus (1.5%), Nocardioides (1.31%), Haliangium (0.84%), Solirubrobacter (0.83%), unidentified_Methylomirabilota (0.67%), Sphingomonas (0.56%) and Achromobacter (0.01%). Among the Soil-HQ_3Y bacterial community composition, Pseudarthrobacter was the dominant genus with a relative abundance of 2.61%, followed by Gaiella (2.03%), Blastococcus (1.44%), Solirubrobacter (0.95%), unidentified_Methylomirabilota (0.92%), Nocardioides (0.84%), Haliangium (0.81%), Sphingomonas (0.67%), Achromobacter (0.02%) and unidentified_Burkholderiaceae (0.01%). Lastly, in the Soil-HQ_4Y of the bacterial community composition, Pseudarthrobacter was the dominant genus with a relative abundance of 2.34%, followed by Gaiella (1.79%), unidentified_Methylomirabilota (1.15%), Haliangium (1.03%), Solirubrobacter (0.93%), Blastococcus (0.71%), Sphingomonas (0.68%), Nocardioides (0.56%), Achromobacter (0.04%) and unidentified_Burkholderiaceae (0.02%). Among them, the abundance of Pseudarthrobacter in the four groups of samples has been greater than 2%, and the overall trend is to increase first and then decrease, reaching a peak in the second year. Blastococcus and Nocardioides are in perfect tune with its trend. Gaiella has a similar trend, peaking only in its third year. The abundance of Sphingomonas, unidentified_Burkholderiaceae and Achromobacter decreased first and then increased, while the abundance of unidentified_Methylomirabilota and Haliangium increased overall. The abundance of Solirubrobacter changes in a trend similar to N.
Based on the linear discriminant analysis effect size (LEfSe), a linear discriminant analysis (LDA) distribution histogram with a score cutoff of ± 4 was employed to illustrate taxa with significant differences in abundance between different groups (Fig. 4c). LEfSe analysis showed that the bulk soil indicator bacteria in Soil-HQ_1Y were Burkholderia_pseudomallei (5.04), Achromobacter (5.02) and Proteobacteria (4.98), among the Soil-HQ_2Y were Pseudarthrobacter (5.14), Micrococcaceae (4.92) and unidentified_Actinobacteria (4.89), and in the Soil-HQ_3Y were Nitrososphaerales (4.56), Nitrososphaeria (4.51) and Crenarchaeota (4.46), and finally in the Soil-HQ_4Y are Nitrosomonadaceae (4.31), Metagenome (4.16) and Pyrinomonadaceae (4.15). These results also showed that there were significant differences in bacterial abundance in rhizosphere soils of HuangQin in different planting years.
Flavonoid metabolomics analysis and differential metabolite screeningTo gain insights into the changes occurring in the main active ingredients of HuangQin during the transition from ZiQin to KuQin, flavonoids in the four groups of samples were identified using UPLC-MS platform with broadly targeted metabolome technology. For root samples from HQ_1Y to HQ_4Y, we detected 550, 547, 547, and 547 metabolites, respectively. Flavonoids constituted 97.28% of the metabolite composition, while tannins accounted for 2.7%. Among the identified flavonoids, a total of 537 were classified into secondary structures (Fig. 5a), comprising 282 flavones (52.5%), 105 flavonols (19.6%), 49 flavonones (9.1%), 37 isoflavones (6.9%), 25 other flavonoids (4.7%), 18 chalcones (3.4%), 15 flavanonols (2.8%), and 6 flavanols (1.0%).
Fig. 5
Composition of metabolites categories in HuangQin. a: Histogram depicting the secondary classification of all identified metabolites. b: PCA grouping analysis. c: OPLS-DA verification Diagram. d: OPLS-DA score graph
The principal component analysis (PCA) results demonstrated good repeatability of biological samples, with distinct separation among different samples (Fig. 5b). The contribution rates of the first two principal components were 32.42% and 21.68%, respectively. The cumulative rate reached 54.10%, which effectively discriminates HuangQin samples for different years, indicating that there were certain differences in the chemical composition of HuangQin across different years. Orthogonal partial least squares discriminant analysis (OPLS-DA), a supervised pattern recognition method, effectively excluded non-study-related effects to identify differential metabolites. The model’s Q2 value of 0.937 indicated its appropriateness (Fig. 5c). The OPLS-DA score plot (Fig. 5d) revealed significant segregation among the different comparison groups. Pairwise comparisons were conducted among the radix samples of the four HuangQin accessions to identify metabolites responsible for observed differences. Through correlation analysis, PCA, cluster heat map analysis, and OPLS-DA model analysis, high biological sample repeatability was confirmed.
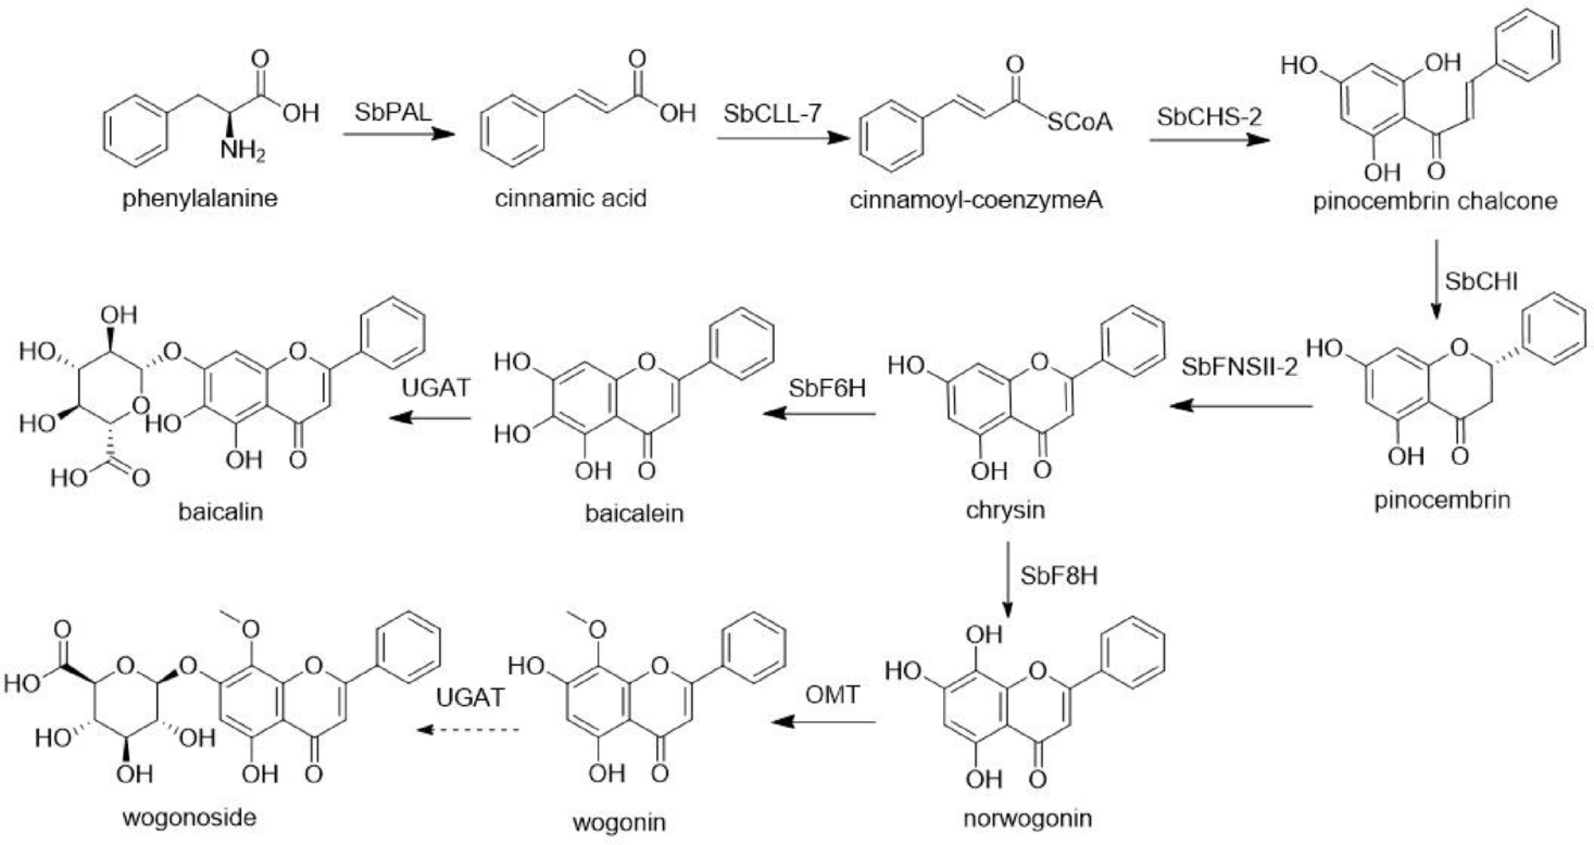
Differential metabolite analysis552 compounds were screened for differential metabolites, resulting in the identification of 222 differential metabolites (121 upregulated and 101 downregulated) in HQ_2Y compared to HQ_1Y (Fig. 6a), 140 (106 upregulated and 34 downregulated) in HQ_3Y compared to HQ_2Y, 178 (61 upregulated and 117 downregulated) in HQ_4Y compared to HQ_3Y, 206 (142 upregulated and 64 downregulated) in HQ_3Y compared to HQ_1Y, 210 (109 upregulated and 101 downregulated) in HQ_4Y compared to HQ_1Y, and 151 (75 upregulated and 76 downregulated) in HQ_4Y compared to HQ_2Y (SFig. 2). The types of differential metabolites in HQ_1Y and HQ_2Y encompass 45.9% flavones (Fig. 6b), 20.3% flavonols, 9.9% flavanones, 7.7% isoflavones, 5.9% chalcones, 3.2% flavanonols, 3.6% other flavonoids, 3.2% tannin, and 0.5% flavanols. In HQ_2Y and HQ_3Y, the differential metabolite types included 53.6% flavones, 18.6% flavonols, 9.3% flavanones, 8.6% isoflavones, 4.3% other flavonoids, 3.6% chalcones, and 2.1% flavanonols. The increased proportion of flavones by 8% was the main reason for the change, while the proportions of other types did not show significant changes, and no significant differences were observed in tannin and flavanol metabolites. Over the course of 2 to 3 years, the contents of chrysin, baicalein, norwogonin, and baicalin increased, albeit not significantly, indicating ongoing accumulation of active ingredients in HuangQin during this period. In HQ_3Y and HQ_4Y, the differential metabolite types comprised 48.3% flavones, 21.3% flavanols, 9.6% flavanones, 8.4% isoflavones, 4.5% tannin, 3.9% other flavonoids, 1.7% flavanonols, 1.1% chalcones, and 1.1% flavanols. Notably, baicalin, a principal component in HuangQin, exhibited a significant down-regulation by 0.44 times over the course of three to four years, with its content halved, while chrysin, baicalein, and norwogonin all showed up-regulation, although not significantly. Furthermore, the content of chrysin in HQ_4Y reached its highest value, and oroxylin A content in HuangQin was significantly up-regulated at each stage, reaching its peak in the fourth year. In HQ_2Y and HQ_4Y, the differential metabolite types comprised 48.3% flavones, 19.9% flavonols, 7.9% flavanones, 6.6% isoflavones, 6.0% other flavonoids, 4.0% chalcones, 3.3% tannin, 3.3% flavanonols, and 0.7% flavonols. At this stage, significant changes occurred in the main components of HuangQin, with chrysin, baicalein, norwogonin, and oroxylin A being significantly up-regulated, while baicalin was significantly down-regulated. This suggests continuous accumulation of norwogonin, chrysin, oroxylin A, and baicalein over the 2 to 4-year period, while baicalin underwent significant reduction. Therefore, it is speculated that the 3-year growth period of HuangQin may be the time node to distinguish ZiQin and KuQin.
Fig. 6
Metabolic profiling of differential metabolites. a: Differential metabolite volcano plot. The horizontal axis numbers represent different difference groups, I: HQ_1Y vs. HQ_2Y; II: HQ_2Y vs. HQ_3Y; III: HQ_3Y vs. HQ_4Y; IV: HQ_2Y vs. HQ_4Y. Vertical axis, log2FC value of difference substances in each difference group. Red dot, difference species (p value < 0.05). Black color, difference species (p value > = 0.05). b: Differential metabolite composition map. Horizontal axis, substances classified by the secondary classification of HuangQin. Vertical axis, number of metabolites
All the detected differential metabolites were compared with the KEGG database, and the metabolic pathways closely related to different differential expressions were identified through pathway enrichment analysis, which provided a basis for gene function mining in the later stage. It is included isoflavonoid biosynthesis, metabolic pathways, biosynthesis of secondary metabolites, flavonoid biosynthesis and flavone and flavonol biosynthesis.
Effects of soil physicochemical properties on bacteria at different planting years of HuangQinBy integrating the prominent microorganisms in soil physicochemical properties and the abundance at the genus level, a notable correlation emerged with Pseudarthrobacter exhibiting a significant association with TN, AN, AK, and NH4+-N (Fig. 7a). Specifically, as TN, AN, and AK increased, the abundance of Pseudarthrobacter demonstrated a corresponding rise, whereas with a decrease in NH4+-N, the abundance of Pseudarthrobacter increased, peaking at two years. Pseudarthrobacter has been recognized for its role in promoting plant growth, supported by studies revealing that Pseudarthrobacter sp. NIBRBAC000502770 can enhance the growth of Geum aleppicum and facilitate the accumulation of flavonoids [34].
Fig. 7
Integrated analysis of soil physicochemistry and soil microbial communities. a: Edge width corresponds to Mantel’s R statistic for the corresponding distance correlations, Blue and red for gradients with negative to positive correlations, respectively. Orange, very significant line (Mantel’s p < 0.01). Green, prominent line (0.01 ≤ Mantel’s p < 0.05). Gray, the inconspicuous line color (Mantel’s p > 0.05). b: RDA analysis. Black, different microorganisms. Blue labels and arrows, different physicochemical factors. Colored dots, samples belonging to different groups. Length of the arrow, intensity of the influence of environmental factors on microbial changes
A decrease in NH4+-N decreases during the 1–2 year period is accompanied by a corresponding reduction in the abundance of Sphingomonas. The NH4+-N concentration reaches its peak at 3 years, coinciding with the highest abundance of Sphingomonas during the same period, while AN exhibit an inverse trend. Sphingomonas species have exhibited significant agricultural applications, particularly in promoting plant growth and enhancing plant stress resistance Certain strains of Sphingomonas have been identified as potential enhancers of crop growth, particularly under stress conditions such as drought, salinity, and heavy metal exposure in agricultural soils. This is attributed to their ability to synthesize plant growth hormones like gibberellin and indoleacetic acid [35]. Furthermore, a significant correlation was observed between Haliangium and AP, with both exhibiting a decline in abundance from 3 to 4 years, coinciding with the lowest AP levels at year 4. Haliangium species may play a crucial role in the degradation of polycyclic aromatic hydrocarbons (PAHs) in biochar-enhanced rhizosphere soils [36].
Nocardioides exhibited a notable correlation with TN and AK, as well as a significant association with AN and pH. The abundance of Nocardioides increased during the 1–2 year period but decreased from 2 to 4 years, mirroring the trends observed in TN and AK. AN followed a similar trajectory as Nocardioides, with a slight increase observed during 3–4 years, whereas pH remained relatively stable during 1–3 years before increasing during 3–4 years. Achromobacter demonstrated a significant correlation with TP, SK, SAP, and NH4+-N, with its highest abundance observed at 1 year and gradually decreasing over subsequent years. The general trend for TP, SK, SAP, and NH4+-N was an increase during 1–3 years followed by a decrease in 3–4 years. Moreover, a significant correlation was noted between Blastococcus and AP, with Blastococcus being most abundant at 3 years, consistent with the trend observed in AP.
RDA analysis was used to further explore the relationship between rhizosphere soil microbial community and soil physicochemical factors in HuangQin. The results showed that the contents of pH, TN, TK, NO3-N and AP had an effect on the distribution of soil bacterial communities (Fig. 7b). The influence of pH, TN and TK was greater, and the influence of NO3-N and AP was relatively small. Pseudarthrobacter was positively correlated with TN, TK and NO3-N in soil. and it was negatively correlated with the content of AP and pH. Achromobacter and unidentified_Burkholderiaceae were positively correlated with the content of AP in soil. There was a negative correlation with the contents of TN, TK, NO3-N and pH, and the rest of the bacteria were all gathered at the origin, which was not significantly correlated with soil physical and chemical factors.
Correlation analysis of differential metabolites with differential microorganismsSpearman correlation hierarchical cluster analysis (Fig. 8a) revealed a significant decrease in baicalin content among the differential microorganisms and metabolites over the 3 to 4 year period. The data of differential metabolites and the spearman correlation analysis of differential microorganisms were listed (Stable2). Rhizosphere bacteria were found to exhibit both negative and positive correlations with baicalin levels. On the one hand, rhizosphere bacteria that are negatively correlated with baicalin include 13 species of bacteria, such as Polycyclovorans, Pseudomonas and Aquicella, etc. Conversely, the rhizosphere bacteria exhibiting positive correlation with baicalin encompass a total of 17 bacterial species, including Nocardioides, Iamia and Gemmatimonas, etc. Notably, the majority of these positively associated bacteria comprise beneficial strains that actively contribute to soil fertility and plant growth through their involvement in crucial processes such as organic matter decomposition, carbon fixation, and nitrogen metabolism. Therefore, we hypothesize that certain bacterial species, such as Polyceclovolens, Psadormonas, and Aquitella, may exert inhibitory effects on baicalin synthesis, while others like Nocatiodes, Yamia, and Germatimonas could potentially enhance the accumulation of baicalin.
Fig. 8
Hierarchical cluster heat map of spearman correlation between differential microorganisms and differential metabolites. a: HQ_4Y_vs_HQ_3Y; b: HQ_4Y_vs_HQ_2Y
Between two to four years of age (Fig. 8b), baicalin content exhibited a significant increase and was found to be significantly negatively correlated with 12 bacteria species, including Pirellula, Polycyclovorans and Nitrosospira, while positively correlated with 23 bacteria species such as Blastococcus, Skermanella and unidentified_Acidimicrobiia. The content of chrysin exhibited a significant increase and demonstrated a negative correlation with 20 bacteria species, including Blastococcus, Skermanella, and unidentified_Acidimicrobiia. Conversely, it displayed a positive correlation with 9 bacteria such as Pirellula, unidentified_Chloroflexi and Polycyclovorans. The content of norwogonin exhibited a significant increase and displayed negative correlations with 23 bacteria taxa, including Pseudarthrobacter, Cellulomonas and Microbacterium. Conversely, it showed a positive correlation with 15 bacteria including Pirellula, Polycyclovorans and Nitrosospira. The content of baicalein increased significantly and was negatively correlated with 13 bacteria such as unidentified_Acidimicrobiia, Cellulomonas and Actinomycetospora, and positively correlated with 12 bacteria such as Pirellula, unidentified_Chloroflexi and Polycyclovorans.
While the Mantel tests and redundancy analysis (RDA) indicated significant correlations (p < 0.05) between specific microbial taxa and flavonoid accumulation, these findings reflect statistical associations rather than established causal relationships. Additional mechanistic investigations such as targeted inoculation or genetic manipulation, are necessary to confirm whether these microbes directly regulate flavonoid biosynthesis in HuangQin.
Comments (0)