
Remember me
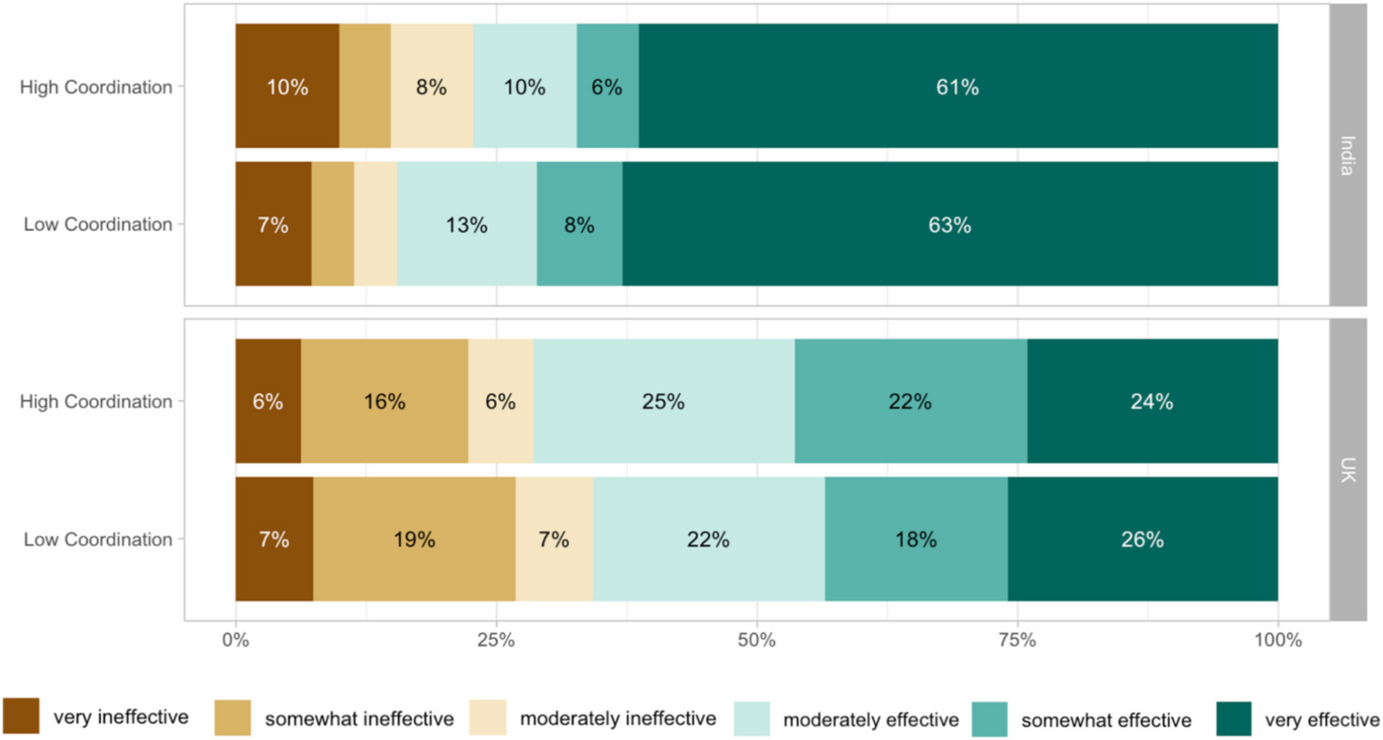
For effectiveness, an ANOVA revealed a significant main effect of culture, with participants giving higher estimates in the India group (M = 4.90, SD = 1.66) than in the UK group (M = 4.07, SD = 1.261), F (1, 414) = 26.83, p < 0.001, ηg2 = 0.061, and no significant main effect of coordination, with responses from participants in the High Coordination condition (M = 4.55, SD = 1.68) not differing significantly from responses from participants in the Low Coordination condition (M = 4.47, SD = 1.69), F (1, 414) = 0.02, p = 0.883, ηg2 < 0.001). There was no significant interaction between Coordination and Culture (F (1, 414) = 0.95, p = 0.331, ηg2 = 0.002 (See Fig. 1).
Fig. 1
Responses to the effectiveness question in the High and Low Coordination conditions for participants in each of the two cultures
4.1.2 Persistence QuestionFor the persistence question, an ANCOVA with effectiveness as covariate revealed a significant main effect of coordination, with participants giving higher estimates in the High Coordination condition (M = 4.37, SD = 0.99), than in the Low Coordination condition (M = 4.17, SD = 1.10), F (1, 414) = 4.46, p = 0.036, ηg2 = 0.011, as well as a significant main effect of Culture, with participants in the UK group giving higher estimates (M = 4.40, SD = 0.93) than participants in the India group (M = 4.13, SD = 1.14), F (1, 414) = 17.06, p < 0.001, ηg2 = 0.04). There was no significant interaction between Coordination and Culture (F (1, 414) = 0.14, p = 0.707, ηg2 < 0.001 (See Fig. 2).
Fig. 2
Responses to the persistence question in the High and Low Coordination conditions for participants in each of the two cultures
4.1.3 Expectation QuestionFor the expectation question, an ANCOVA with effectiveness as covariate did not reveal a significant main effect of coordination, with participants not giving significantly higher estimates in the High Coordination condition (M = 3.29, SD = 1.44), than in the Low Coordination condition (M = 3.06, SD = 1.50), F (1, 414) = 3.10, p = 0.079, ηg2 = 0.007, but did reveal a significant main effect of Culture, with participants in the India group giving higher estimates (M = 3.82, SD = 1.20) than participants in the UK group (M = 2.60, SD = 1.47), F (1, 414) = 67.13, p < 0.001, ηg2 = 0.14) (Fig. 3).
Fig. 3
Responses to the expectation question in the High and Low Coordination conditions for participants in each of the two cultures
4.1.4 Annoyance QuestionFor the annoyance question, an ANCOVA with effectiveness as covariate did not reveal a significant main effect of coordination: responses did not differ significantly between the Low Coordination condition (M = 2.33, SD = 1.28) and the High Coordination condition (M = 2.21, SD = 1.19), F (1, 414) = 1.05, p = 0.305, ηg2 = 0.003. We did observe a significant main effect of Culture, with participants in the India group giving significantly higher estimates (M = 2.56, SD = 1.37) than participants in the UK group (M = 2.02, SD = 1.04), F (1, 414) = 21.14, p < 0.001, ηg2 = 0.049). The interaction between Coordination and Culture was not significant (F (1, 414) = 1.16, p = 0.282, ηg2 = 0.003) (See Fig. 4).
Fig. 4
Responses to the annoyance question in the High and Low Coordination conditions for participants in each of the two cultures
4.1.5 Obligation QuestionFor the obligation question, a Pearson's Chi-squared test with Yates'continuity correction found a significant difference for culture, with 66.67% of participants in the India group, but only 6.81% of participants in the UK group, indicating yes, X2 (1, N = 418) = 161.1, p < 0.001, but no significant difference for Coordination, X2(1, N = 418) = 0.83, p = 0.773 (See Fig. 5).
Fig. 5
Responses to the obligation question in the High and Low Coordination conditions for participants in each of the two cultures
4.1.6 Regressions with Interdependence as PredictorNext, we conducted a series of regressions with interdependence as predictor for the DVs of persistence, expectation and annoyance.
First, a regression analysis revealed that self-reported interdependence predicted responses to the persistence question, β = 0.1436, p < 0.001, r2 = 0.0177, F(1, 416) = 7.496, p = 0.006.
Next, a regression analysis revealed that self-reported interdependence predicted responses to the expectation question, β = 0.4408, p < 0.001, r2 = 0.0815, F(1,416) = 38.03, p < 0.001.
Finally, a regression analysis revealed that self-reported interdependence predicted responses to the annoyance question,Footnote 1β = 0.164, p = 0.0086, r2 = 0.0141, F(1,416) = 6.969, p = 0.008 Table 2.
Table 2 Regressions with interdependence as predictorThese results support hypothesis 4 – i.e., that more interdependent individuals have a greater sense of commitment, irrespective of their culture. This raises the possibility that the difference in the degrees of interdependence between India and the UK may be a factor underlying the observed differences between India and the UK with respect to participants’ responses to the questions about persistence, expectations and annoyance. To probe this further, we also conducted a series of regressions with interdependence and group (UK and India) as predictors for the DVs of persistence, expectation and annoyance.
First, a regression analysis revealed that self-reported interdependence predicted responses to the persistence question, β = 0.277, p < 0.001, and group membership (UK) did so as well, β = 0.531, p < 0.001, r2 = 0.062, F(2, 415) = 14.87, p < 0.001.
Next, a regression analysis revealed that self-reported interdependence predicted responses to the expectation question, β = 0.176, p = 0.0231, and group membership (UK) did so as well, β = − 1.047, p < 0.001, r2 = 0.176, F(2, 415) = 45.48, p < 0.001.
Finally, a regression analysis revealed that self-reported interdependence did not predict responses to the annoyance question, β = 0.036, p = 0.610, however, group membership (UK) did do so, β = − 0.508, p < 0.001, r2 = 0.0441, F(2, 415) = 10.62, p < 0.001 Table 3.
Table 3 Regressions with interdependence and group as predictorWe also conducted a logistic regression analysis with interdependence and group (UK and India) as predictors for the DV of obligation. The results revealed that being a member of the UK group significantly reduced the odds ratio by 0.0371, β = − 3.292, p < 0.001, χ2(1) = 138, p < 0.001, while a unit increase in self-reported interdependence did not significantly change the odds ratio, β = 0.0166, p = 0.909, χ2(1) = 42.5, p < 0.001.
4.1.7 Interdependence between GroupsTo compare the self-reported interdependence of participants between the two cultures, we computed a mean interdependence rating for each participant on the basis of the 15 items in self-construal questionnaire that target interdependence (Singelis 1994). A Welch Two Sample t-test revealed that participants in the India group reported a higher degree of interdependence (M = 5.669, SD = 0.9524) than participants in the UK group (M = 4.725, SD = 0.7360), t (369.63) = 11.254, p < 0.001, d = 1.28. Next, we tested for metric invariance – i.e., to probe how similar the relationships between the specific scale items and the underlying construct of interdependence are for the two cultural groups. To do so, we compared a configural model against a metric model using a chi-square difference (Δ χ2) test, which yielded a significant result, Δχ2 = 29.833, df = 14, p = 0.008, indicating a lack of metric invariance. While this result provides reason to take particular caution in interpreting the observed cultural difference in self-construal, there is ongoing debate about the relevance of invariance for assessing the validity of cross-cultural constructs across cultures (Weizel et al., 2023). In addition, to estimate the internal consistency for the total score in the sample, we computed Cronbach’s α = 0.60 (Fig. 6).
Fig.6
Distribution of Interdependence scores for each culture
We also conducted a series of analyses for each group to probe to what extent responses to the different test questions were correlated with each other.
A Spearman's Rank Correlation revealed no correlation between responses to the annoyance question and responses to the persistence question for the whole sample, r(416) = − 0.02396, p = 0.6251, the UK group, r(218) = 0.05, p = 0.459, or for the India group, r(196) = − 0.0199, p = 0.78.
A Spearman's Rank Correlation revealed a significant positive correlation between responses to the annoyance question and responses to the expectation question for the whole sample, r(416) = 0.3426, p < 0.001, a significant positive correlation for the UK group, r(218) = 0.4327, p < 0.001, and a weaker significant correlation for the India group, r(196) = 0.147, p = 0.03867.
A Spearman's Rank Correlation revealed a significant positive correlation between responses to the persistence question and responses to the expectation question for the whole sample, r(416) = 0.2506, p < 0.001, a significant correlation for the UK group, r(218) = 0. 1479, p = 0.02825, and a stronger significant correlation for the India group, r(196) = 0.5354, p < 0.001.
A Spearman's Rank Correlation revealed a significant positive correlation between self-reported interdependence and responses to the persistence question for the whole sample, r(416) = 0.145, p = 0.003, no correlation for the UK group, r(218) = 0.070, p = 0.299, and a significant positive correlation for the India group, r(196) = 0.356, p < 0.001.
A Spearman's Rank Correlation revealed a significant positive correlation between self-reported interdependence and responses to the expectation question for the whole sample, r(416) = 0.305, p < 0.001, no correlation for the UK group, r(218) = − 0.025, p = 0.704, and a significant correlation for the India group, r(196) = 0.311, p < 0.001.
A Spearman's Rank Correlation revealed no correlation between self-reported interdependence and responses to the annoyance question for the whole sample, r(416) = 0.087, p = 0.075, for the UK group, r(218) = − 0.042, p = 0.531, and for the India group, r(196) = 0.046, p = 0.518 Table 4.
Comments (0)