
Remember me


The study was designed as a double-blinded (assessors blinded for each others’ results, image assessor blinded for both assessors and participants) reliability study on ultrasound assessments of muscle thickness and PA in the quadriceps and plantar flexors (see Fig. 1). Since previous studies provided concerns dependency on subjective influences of ultrasound results, assessor experience was hypothesized to moderate the precision and accuracy, which areas a vital precondition for scientifically sound muscle ultrasound imaging. To address this issue, the intra- and inter-day reliability was determined in experienced and inexperienced assessors by collecting muscle thickness and pennation angle data from four muscles twice per day (intraday) on two consecutive days (inter-day).
Fig. 1
Graphical illustration of the study protocol including image acquisition of an experienced and inexperienced investigator, blinded for the results of the respective other in the quadriceps (rectus femoris and vastus lateralis) and the plantar flexors (lateral and medial head of the gastrocnemius)
ParticipantsNo a-priori sample size estimation was performed as this is not available for agreement analyses. However, previous studies used sample sizes of 15 to 29 [5, 11, 22, 33]. To ensure sufficient power and account for potential drop-outs, 39 recreationally active and healthy participants (m: n = 20, age = 23.75±2.43 years, height = 179.43±8.68 cm, mass = 78.92±9.92 kg, w = 19, age = 23.91±2.57 years, height = 166.27±5.21 cm, mass = 60.28±6.81 kg) were recruited from the university campus and university sports science program. Participants were considered recreationally active if they participated in a structured sport- or training program at least twice per week for a minimum of 60 min for (at least) one year. To receive comparable results and avoid problems with muscle assessments due to large amounts of fatty tissue, participants with a BMI of > 25 were excluded from the study. All participants were instructed about the study protocol and provided written informed consent. The study was conducted in agreement with the Declaration of Helsinki and was ethically approved by the local ethical review board (No GZ. 39/49/63 ex 2024/25).
Ultrasound investigationAssessor selectionTo investigate the influence of experience on the intra- and inter-day reliability one highly experienced investigator (> 12,000 ultrasound images across multiple published articles over years) and several inexperienced assessors (≤ 100 ultrasound explorations) performed the data collection. Within this study alone, more than 1,000 images were acquired, so we had to rotate the inexperienced assessor randomly within our pool of exercise and physical education students. This procedure was performed to minimize possible learning effects of the inexperienced assessor during the study so that later images would not be biased by increased experience with the equipment and procedure.
To ensure adequate imaging also for the inexperienced investigators, they were introduced into ultrasound investigations by separated training sessions performed over 3 days, in which they were informed regarding crucial information to adequately perform muscle ultrasound investigations and what they have to focus to extract data such as the muscle size (orientation of fascial borders) and the PA. Image digitization and evaluation was performed by one independent assessor, blinded for the investigator. Moreover, in the training sessions, all inexperienced investigators performed between 20 and 25 images per muscle that were evaluated in the study, resulting in a minimal experience of 80 and a maximum experience of 100 acquired images before partaking in this study. To minimize learning effects, the inexperienced assessor was randomly selected from a pool of five assessors using Excel randomizer function for any given participant within this study.
Participant positioning and preparationUltrasound image acquisition was performed in the rectus femoris, vastus lateralis, gastrocnemii medialis and lateralis on two consecutive days by the experienced as well as one inexperienced assessor. Testing was performed using the right leg of the participant. Although other studies allowed several days between data collection [5, 7, 40], structural adaptations during this period (even if small) cannot be ruled out. Therefore, we tested muscles on consecutive days. After the participants were introduced to the study protocol they were placed in a seated position on a physiotherapy table. Standardization of the leg position was ensured by placing the popliteal space of the knee flush against the edge of the table with the lower legs hanging freely. Additionally, the lower-body muscles were relaxed, and a goniometer was used to ensure the knee joint and hip joint angle to be in a 90° angle. Standardization of the positioning of participants and the point to conduct the measurement was performed by both investigators together. The arms were used to stabilize the upper body to avoid any co-contractions in the hips which could affect the images. By sonographic screening of the full length of the quadriceps, the proximal (hip) and distal (knee) muscle tendon junction (MTJ) were determined by the experienced assessor which were marked with a permanent marker.
The first measurement spot for the rectus femoris was the center between the two MTJs and the second between 10 and 15 cm proximal from the distal MTJ at the knee. The variability of this second spot was used to account for differences in anatomical properties of the participants. From this second position, a horizontal line was drawn to the vastus lateralis to mark the spot at the same height on the vastus lateralis. The measurement spots on the gastrocnemius were determined similarly: The distal MTJ at the Achilles tendon was determined using an exploratory approach. At a distance of 5–10 cm (depending on individual anatomical properties of the participants) in the proximal direction the gastrocnemius medialis was marked. The gastrocnemius lateralis measurement spot was marked accordingly, albeit a bit more proximal compared to the gastrocnemius medialis due to the anatomical specificity of the gastrocnemius. This procedure was used as no intersubject comparison was conducted, so the only relevant aspect was to use the same measurement region in both testing occasions and that both assessors performed the testing at the exact same spot. That also means that the spots were re-painted at every possible instance. If any spot would have not been identifiable at any given time on these two days, the participants would have been excluded from the study. This, however, did not occur.
Ultrasound imaging and data processingRandomization was performed for the assessor- and muscle-order at the first occasion using Excel randomizer function by an independent, blinded investigator. Only one assessor was present inside the lab at any given time, meaning the other entered the lab earliest once the other assessor had already finalized his image acquisition and left the room. This procedure was performed on both testing days. Ultrasound testing was performed using B-Mode ultrasound (Lumify, Software version 5.0, Philips Ultrasound LLC, Washington, USA) with a 5-cm linear probe and a frequency of up to 30 Hz. All spots were measured twice per assessor (to determine intra-assessor, intra-day(/session) reliability) on each occasion so that the mean of both could be processed for inter-day reliability evaluation, resulting in 16 images per assessor/testing occasion per participant, 32 images per participant overall and 1,248 images in total across all participants. PA and muscle thickness were evaluated by one experienced investigator blinded for test subject and assessor using MicroDicom software (Sofia, Bulgaria); [46] (Fig. 2).
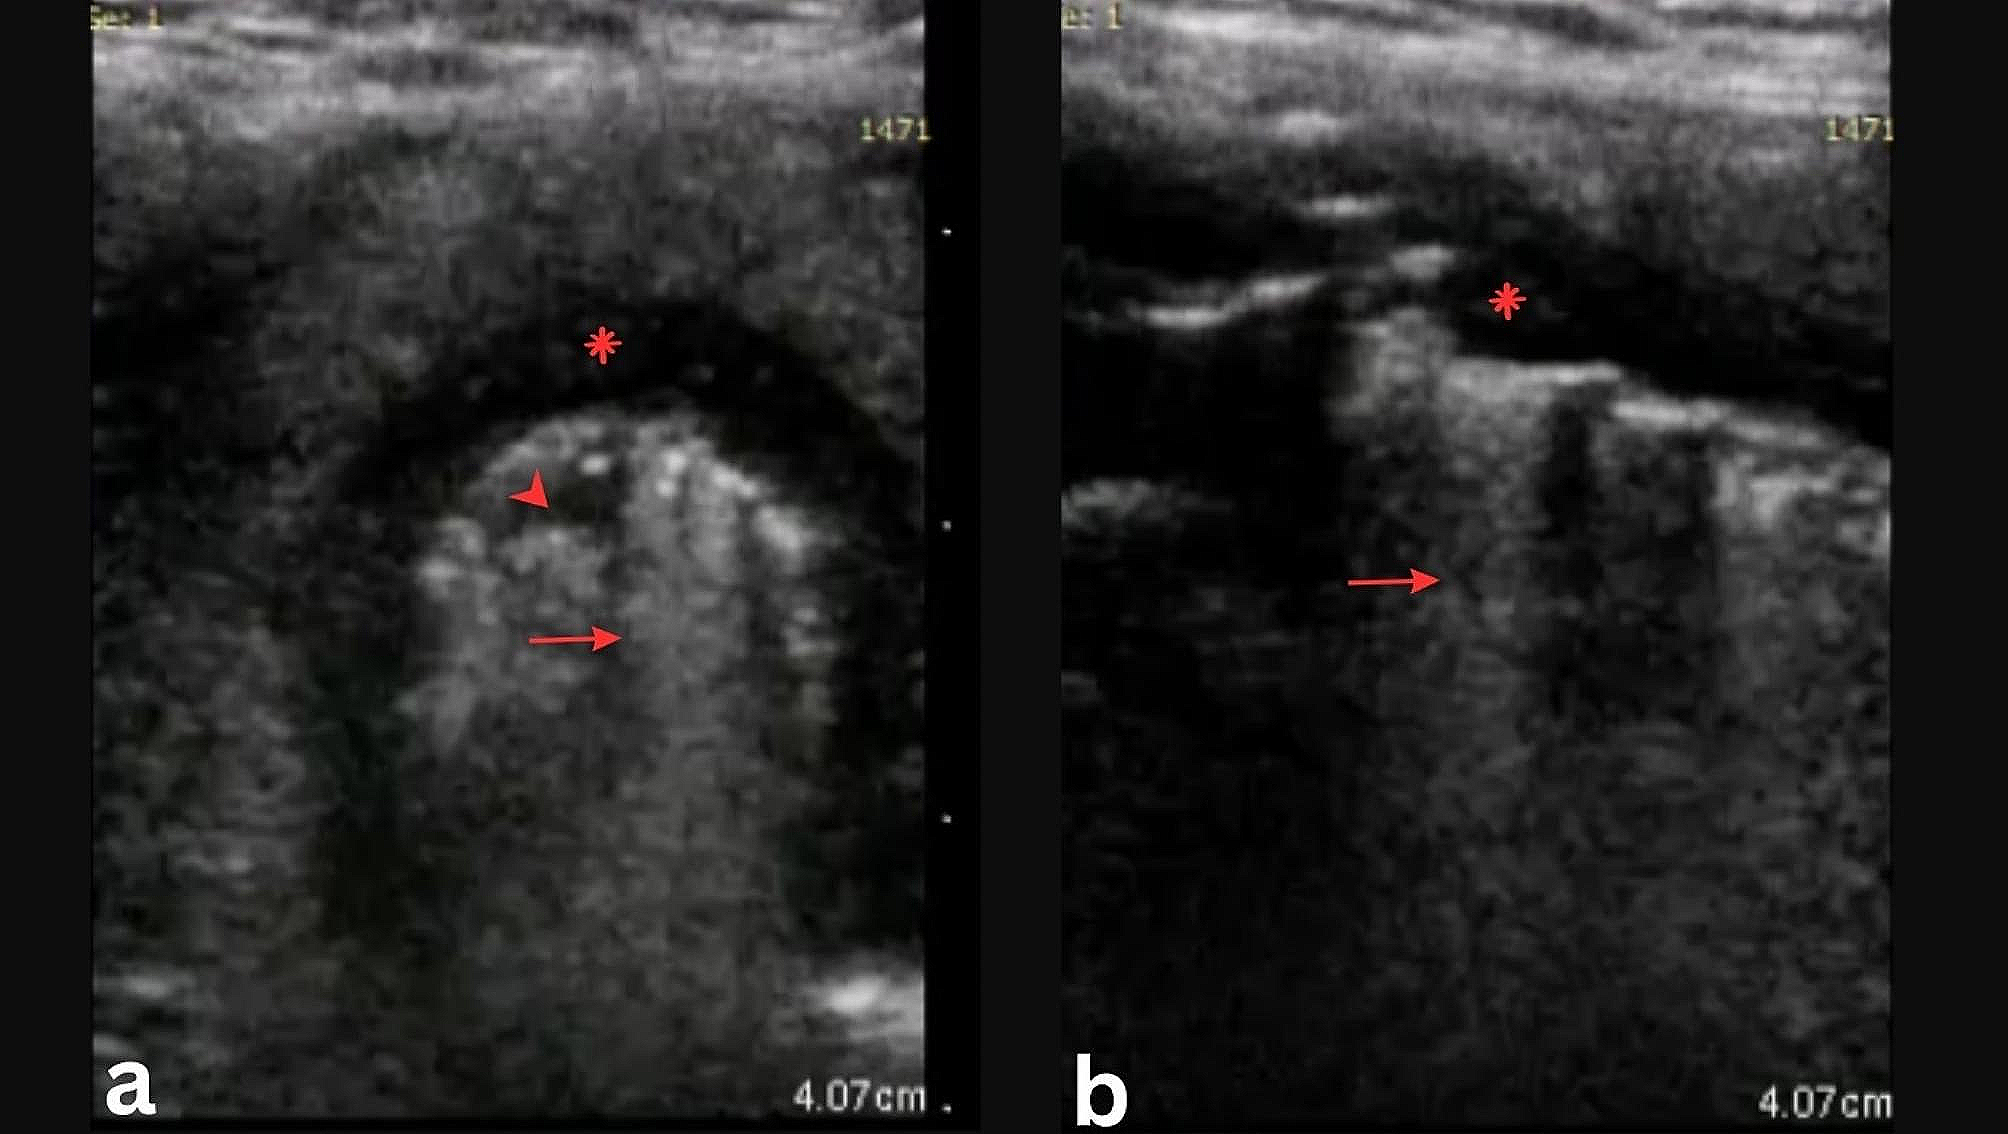
Fig. 2
Exemplary illustration of image evaluation for muscle thickness and pennation angle for the vastus lateralis which were calculated by the ultrasound investigation software MicroDicom by drawing the angle between the fascia layer and the fascicle orientation
Statistical processingStatistical analysis was performed using JASP (Version 0.18.3 (Intel), Netherlands). Normal distribution of data was checked using the Shapiro Wilk test. Mean (M) and standard deviation (SD) were stated for each muscle thickness. Reliability analysis was performed within and between days for each assessor separately. Additionally, inter-assessor reliability, also known as objectivity was evaluated between the assessors to check whether both assessors measured the same value (to be found in the Supplemental Material Table A). These analyses were conducted for relative and absolute reliability coefficients using the ICC for agreement [23] with models available
$$\:ICC=_-_/\left(_+\left(_-_\right)/n\right)$$
Where:
ICC = intraclass correlation coefficient,
\(\:\text}_}\) = mean square for columns,
\(\:\text}_}\) = mean square for error,
\(\:\text}_}\) = mean square for rows,
n = number of subjects,
with calculating the SEM [43],
where:
SEM = standard error of measurement,
SD = standard deviation of the mean difference between trial 1 and 2.
ICC = intraclass correlation coefficient.
And the MDC
where:
MDC = minimal detectable change,
SEM = standard error of measurement.
These coefficients were supplemented by an agreement analysis in adherence to Bland & Altman [6, 14]. For this, the systematic bias was evaluated for significance using the paired sampled t-test [2, 19], while the qualitative error assessment was extended by quantifying absolute measurement errors via the mean absolute error (MAE) [50, 51]
$$\:MAE=\frac*\sum\:_^\left|_-_\right|$$
where:
n = number of data points.
i = index for each (paired) data point.
xi = i-th data point in variable x.
yi = i-th data point in variable y.
and mean absolute percentage error (MAPE) [21]
$$\:\text\text\text\text=\frac*\sum\:_^\left|\frac_-_}_}\right|*100$$
where:
n = number of data points.
i = index for each (paired) data point.
xi = i-th data point in variable x.
yi = i-th data point in variable y.
From the BA analysis the LoAs were extracted for each comparison while the MAE and the systematic bias were included to the graphical illustration using BA plots. The systematic bias was quantified as the mean difference and inference analysis was performed using the sampled t-test [2, 48]. The assumption to be checked was that if the evaluation was performed reliably, two measurements in a row (intra-day(/session)) or two measurements only separated by one day (inter-day/(session)) must result in one and the same value. Also, the measurements of two assessors on the same subject at the same time-point should result in the same value. ICCs were interpreted in adherence to Koo & Li [23], using the lower boundaries of the 95% CI, with ICC ≥ 0.9 being excellent. The α-level was set to 0.05.
Comments (0)