Culture and characterization of ERC
After filling out the informed consent letter, all human menstrual blood samples were obtained from Tianjin Medical University General Hospital from healthy female volunteers (20–30 years of age). ERC derived from the menstrual blood of adults was isolated and cultured as previously described [13]. In brief, mononuclear cells were isolated from the menstrual blood by Ficoll density centrifugation using a sterile menstrual cup. The isolated cells were subsequently cultured in Dulbecco's Modified Eagle Medium/Nutrient Mixture F12 (DMEM/F12, Hyclone, USA) containing 10% Fetal Bovine Serum (FBS, Hyclone, USA) and 1% penicillin/streptomycin (Solarbio, Beijing, China) at 37 °C, 5% CO2, and normoxia. The culture medium was changed every 3 days to remove tissue fragments and non-adherent cells. The adherent cells were passaged utilizing a 0.25% Trypsin solution (with EDTA; Solarbio, Beijing, China). Generation 3 cells were used for subsequent ERC characterization.
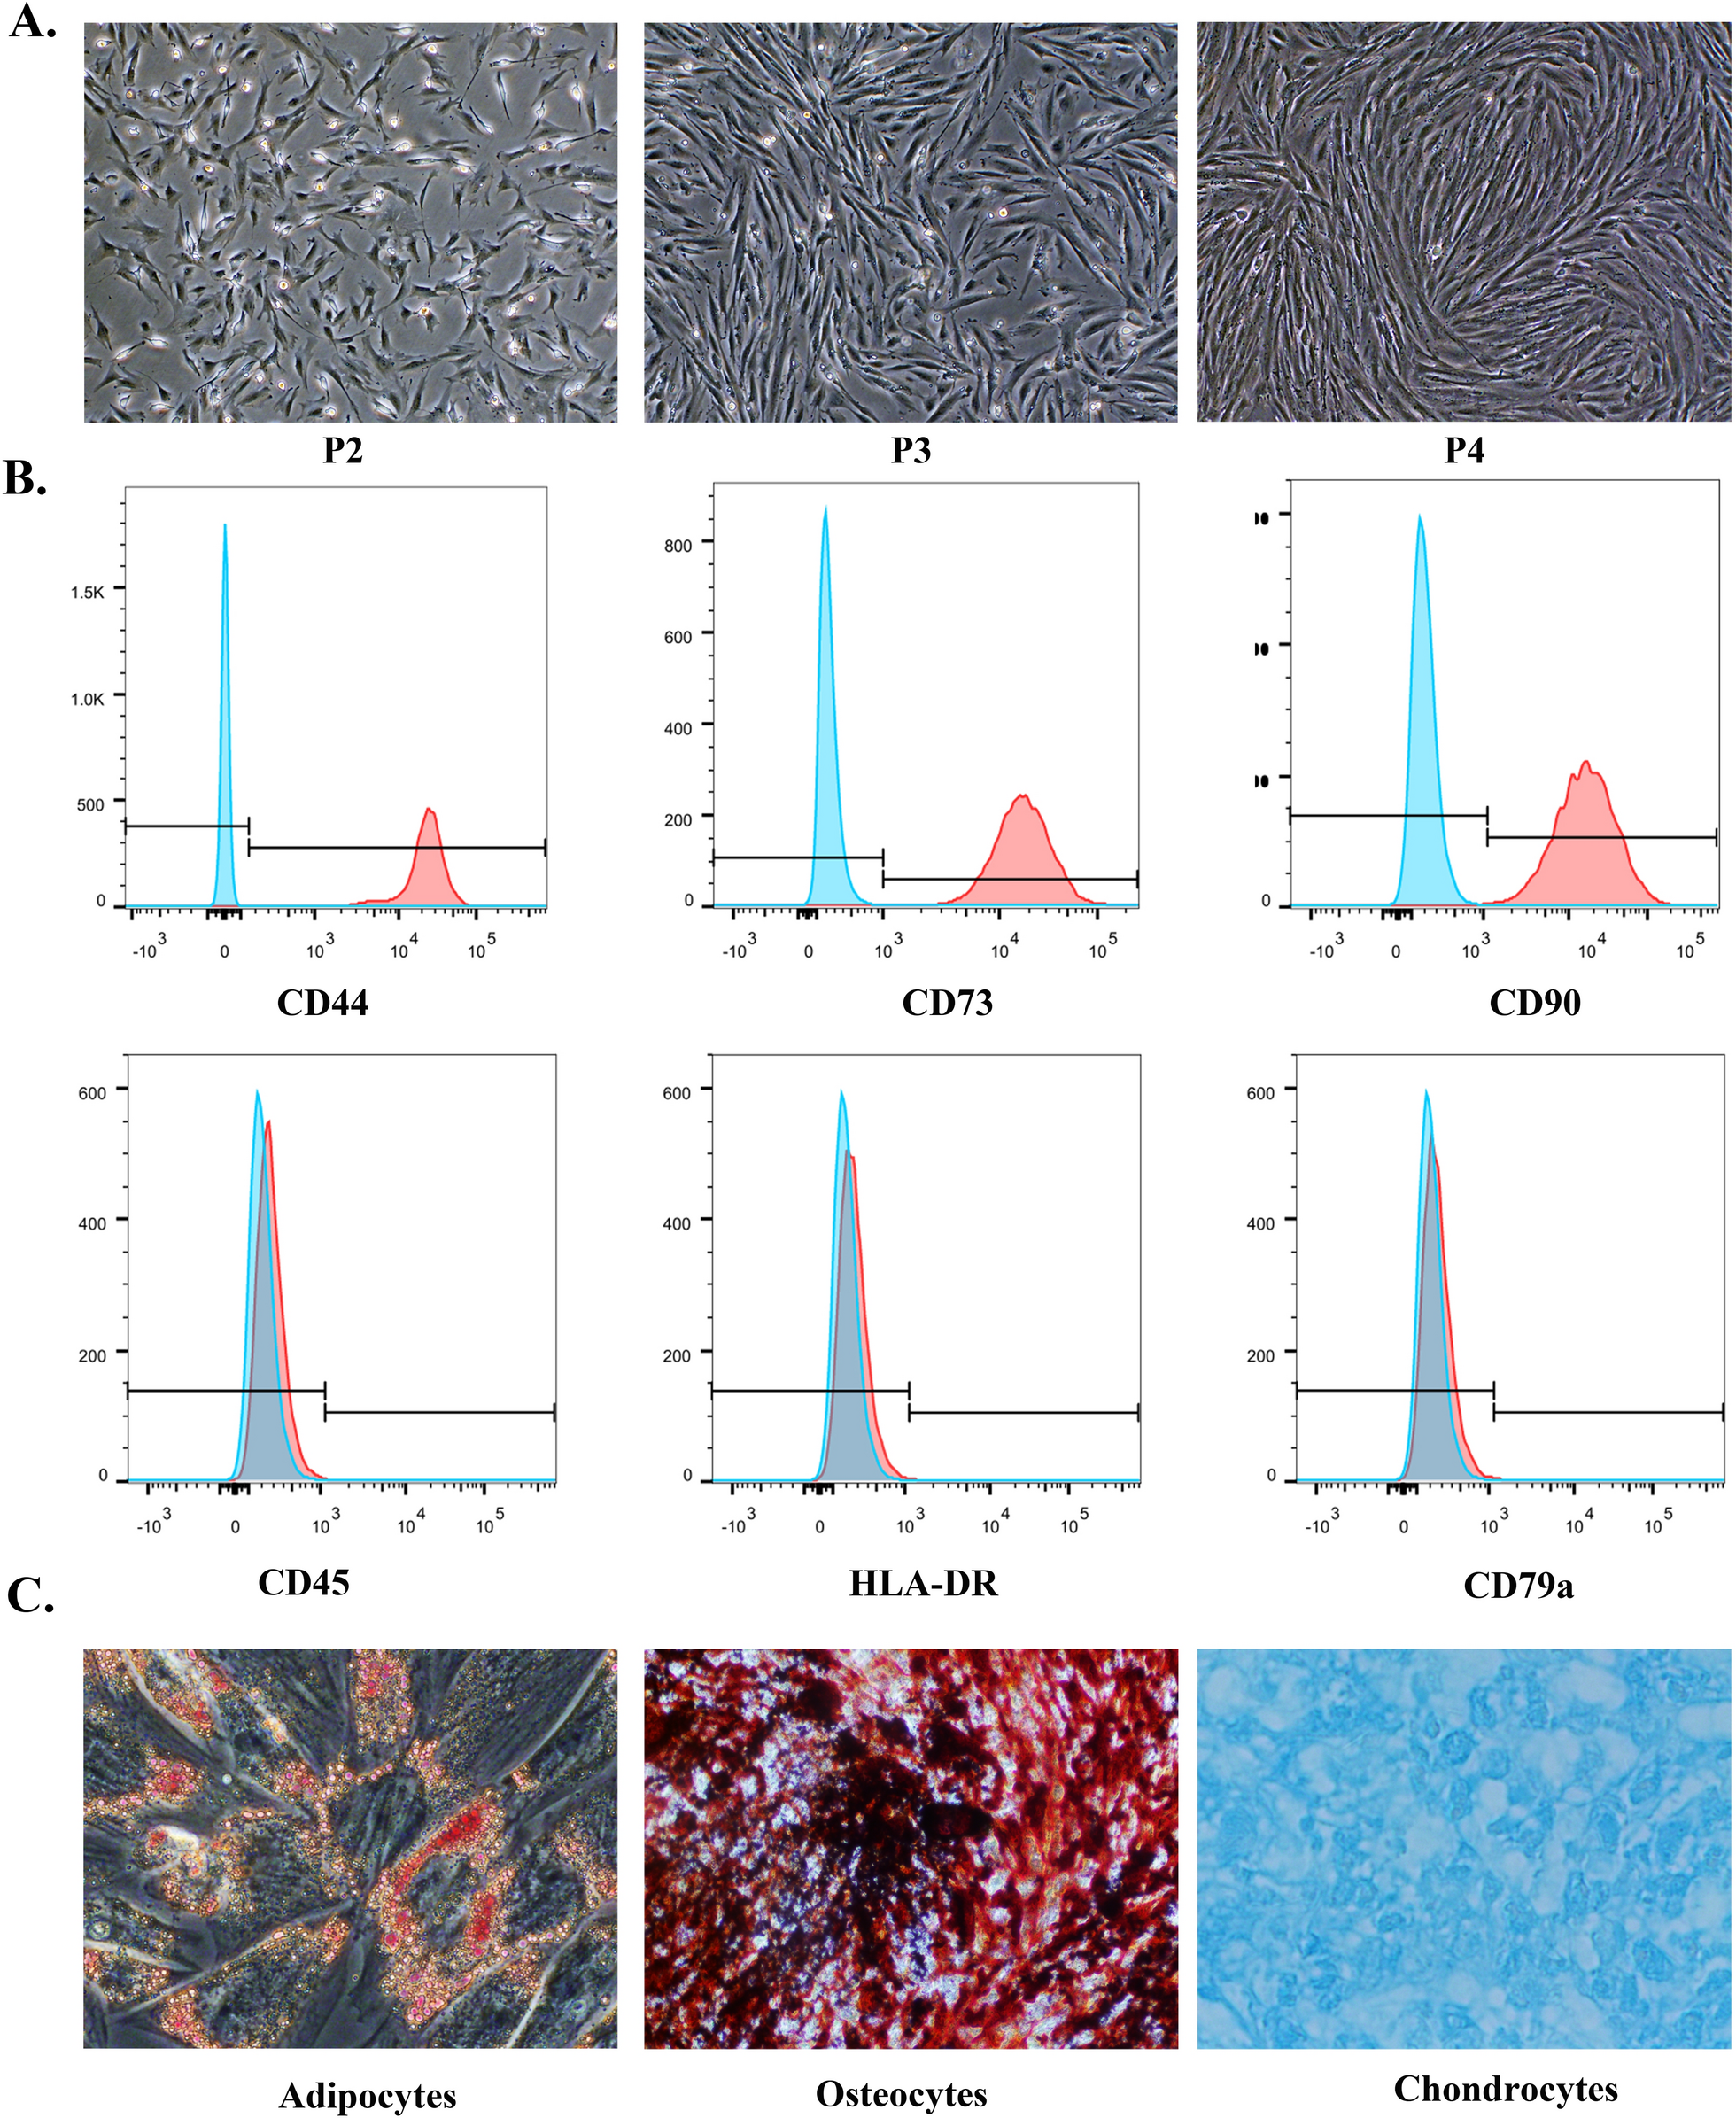
Various methodologies are available for the minimal criteria of MSC including surface molecules and differentiation assays by the International Society for Cell & Gene Therapy (ISCT) guidelines [14]. Photographed and recorded ERC of different generations. Purified passage 3 ERC were obtained and stained with fluorescent antibodies to surface molecules (CD44, CD73, CD90, CD45, CD79a, and HLA-DR) (eBioscience, California, USA). Additionally, their osteoblastic, adipocytic, or chondrocytic differentiation potential under defined conditions was demonstrated by in vitro staining according to the manufacturer's protocol (TransGen Biotech, Beijing, China).
Preparation of ERC with CD73 knockout
To knockout CD73 (NT5E, NM_002526) in ERC, lentivirus-mediated CRISPR-Cas9 knockout technology was applied by the manufacturer's instructions (GeneChem Inc., Shanghai, China). The vector was U6-sgRNA-EF1a-Cas9-FLAG-P2A-Puromycin. Synthetic single guide RNA (SgRNA) targeting human NT5E sequences were designed with two targeting sequences: 5′-CACTTTCTGAGCGATGAGTT-3′ and 5′-CACCGAACTCATCGCTCAGAAAGT-3′. The lentiviral infection protocol was conducted in a biosafety cabinet with an optimized multiplicity of infection (MOI = 30). The transfected cells were passaged when they reached 80% confluence. Following puromycin selection (2 μg/mL, Solarbio, Beijing, China), the efficiency of NT5E knockout was examined by Western blotting and flow cytometry, and subsequent experiments were performed from passages 5–7.
Isolation, purification, and characterization of exosomes
As previously described, exosomes were collected from cell culture supernatants by ultracentrifuge [15]. In brief, ERC were maintained in exosome depleted human MSCs medium (MM101, TransGen Biotech, China) for 48 h to harvest conditioned medium. The conditioned medium was centrifuged at 2,000 g for 20 min at 4 °C to remove apoptotic cells and cell debris and then at 10,000 g for 30 min to remove comparatively larger microvesicles. The clarified supernatants were filtered through 0.22 μm filter membranes. Finally, the supernatant was ultracentrifuged at 130,000 g (Optima XPN-100, Beckman Coulter, USA) for 2 h at 4 °C to obtain exosomes, then washed with PBS and ultracentrifuged at 130,000 g for another 2 h. The concentration was determined using a BCA protein assay kit. (PC0020, Solarbio, China). The morphology of ERC-exo was observed by transmission electron microscopy (TEM) (H7800, HitachiLtd., Japan). Particle size was determined by nanoparticle tracking analysis (NTA; ZetaViewPMX 110). Surface markers, including exosomal markers (CD63, CD9, TSG101) and Golgi markers (Calnexin), were analyzed by Western blotting.
Co-cultures of exosomes with splenocytes
To isolate splenocytes, spleen mechanically mashed and subjected to erythrocyte lysis as previously described[16]. Splenocytes (1 × 10⁶ cells/well) were seeded in 96 well plates and were randomly assigned to 4 groups: LPS group, LPS + Exo group, LPS + NC-Exo group (ERC transfected with lentiviral lacking NT5E gene, used as negative control), and LPS + CD73−/− Exo group (ERC transfected with lentiviral to delete NT5E gene). The cell proliferation ability was analyzed by the CCK-8 kit (n = 5 in each group). Additionally, splenocytes stimulated with various stimulators(St) were co-cultured with exosomes for 72 h. Macrophages were stimulated with LPS (2 μg/mL), and T cells were stimulated with 5 µg/mL precoated anti-mouse CD3 (Biolegend, USA) and 3 µg/mL anti-mouse CD28 (BioLegend, USA). The percentages of each cell type were examined by FACS analysis.
HK2 cell culture and H/R model
HK2 cells purchased from ATCC were cultured in DMEM/F12 supplemented with 10% FBS, 1% penicillin/streptomycin (Solarbio, Beijing, China) at 37 °C in a humidified atmosphere containing 5% CO2. For hypoxia/reoxygenation (H/R) treatment, HK2 cells were exposed to hypoxia condition with 1% O2, 5% CO2, and 94% N2 for 24 h followed by reoxygenation (21% O2, 5% CO2, and 74% N2) for 12 h. HK2 cells were randomly assigned to 3 groups: H/R, H/R + Exo, H/R + CD73−/− Exo, (n = 5 in each group). Next, the cells were incubated with the CCK‐8 Kit (10 μL/well; #96992, Sigma) for 2 h. Finally, the absorbance was recorded at 450 nm utilizing a microplate reader (Safire2, TECAN, Switzerland).
Measurement of the AMP hydrolytic of exosomes
The AMPase enzymatic activity of exosomes was assessed with the assistance of the Phosphate Assay Kit (ab270004, Abcam, USA). To remove inorganic phosphate in PBS, exosomes were isolated by ultracentrifugation and then resuspended in MES buffer (M1317, Sigma, USA). 100 μM AMP (HY-A0181, MedChemExpress, China) was added to 500 μl MES buffer, followed by the addition of 30 μg/ml ERC-Exo or CD73−/− ERC-Exo, and incubation at 37 °C for 1 h. The Adenosine Assay Kit (Bio-Vision, CA, USA) and the Phosphate Assay Kit (ab270004, Abcam) were employed for measuring the enzymatic activity of ERC-Exo.
Exosome labeling and bioluminescence in vivo
To obtain DiO-labelled or PKH26-labelled exosomes, donor ERC or CD73−/−ERC were labeled with DiO (C1038, Beyotime, China) or PKH26 (MINI26, Sigma-Aldrich, USA), respectively, according to the manufacturer's protocol. Subsequently, the cells were washed twice with exosome-depleted human MSCs medium to remove excess dye. After 48 h, the supernatants were harvested, and exosomes were isolated, as described above. This allows us to remove most of the free dye in the pellet. To assess the in vivo tissue distribution of ERC-Exo, control mice or renal I/R injury mice were injected intravenously with 200 µg of DIO-labelled ERC-Exo. Mice were euthanized 12 h after injection. Tissues, including lung, heart, liver, spleen, and kidney, were resected and imaged using the IVIS Spectrum imaging system (Xenogen, Inc.).
Ethics approval and consent to participate
This study was performed following the Declaration of Helsinki Ethical Principles and approved by the Ethics Committee of the Tianjin Medical University General Hospital, Tianjin, China (Approval number: IRB2024-YX-014-01): (1) Title of the approved project: Studies on the mechanism of human menstrual blood-derived endometrial regenerative cell exosomes in the therapy of ischaemia–reperfusion. (2) Name of the institutional approval committee: the Ethics Committee of the Tianjin Medical University General Hospital, Tianjin, China. (3) Approval number: IRB2024-YX-014-01. (4) Date of approval: 01/25/2024.
Animal study
The 45 male C57BL/6 mice, aged 8–10 weeks, were acquired from Tianjin Medical University General Hospital. The animal care and experimental protocols were approved by the Institutional Animal Care and Use Committee of Tianjin Medical University General Hospital and was conducted in accordance with the ARRIVE guidelines 2.0 (Project title: Studies on the mechanism of human menstrual blood-derived endometrial regenerative cell exosomes in the therapy of ischaemia–reperfusion; Approval number: IRB2024-DW-08; Date of approval: 01/30/2024). For two weeks, all mice were maintained in a controlled environment with unrestricted access to food and water.
Animal models and therapeutic experiments
The work has been reported in line with the ARRIVE guidelines 2.0. By IACUC guidelines, mice were observed daily after surgery, and euthanasia was indicated for mice using a scoring system to evaluate excessive distress, including the presence of excessive weight loss, loss of thermoregulation, and lethargy. The mice were randomly assigned to the following groups. All the animals were ear tagged and randomly grouped by computer. Start with any number in the random number table and obtain N random numbers sequentially in the same direction. The remainder is obtained by dividing the random number by the number of groups, and if it is divided, the remainder is obtained by the number of groups. Finally, group by remainder. Male C57BL/6 mice (8–10 weeks old) were anesthetized with with 1% pentobarbital before undergoing surgery and then placed on a heated pad to help maintain body temperature. Renal I/R injury was established as previously reported[17]. Specifically, the two renal pedicles were clamped with microaneurysm clamps for 40 min. The clamps were then released, and the kidneys were observed by a color change to confirm blood reflux before the incision was closed. Sham operations were performed in which both kidneys were exposed, but no renal pedicle clamping was performed. Body temperature was maintained at 36.6–37.2 °C on a heating pad throughout the procedure using a sensitive rectal probe. Generally, mice were divided into three groups:Untreated, ERC-Exo, CD73−/− ERC-Exo, with 6 mice per group. ERC-Exo or CD73−/− ERC-Exo (200 μg) were administered intravenously after reperfusion, thrice every 24 h. At 72 h after reperfusion, The mice were euthanized by cervical dislocation after sampling. Kidneys were rapidly harvested for histological assessment, molecular biology testing, and flow cytometry analysis of inflammatory cells. For histopathology, sections of the kidney were fixed in 10% buffered formalin. All the above operations were performed at the Animal Center of Tianjin Medical University General Hospital. The experimenter does not participate in the assignment process,but only knows the final assignment result. Results evaluation and data analysis were performed by a third party, and at least two researchers were asked to cross-check the analysis results.
Renal function and histological assessment
Serum sCr and BUN concentrations were measured using commercially available assay kits (Nanjing Jiancheng, Nanjing, China). For histological evaluation, the kidney tissue was perfused with PBS, fixed in 10% buffered formalin, embedded in paraffin, sectioned at a thickness of 5 μm, and stained with the periodic acid Schiff (PAS) staining kit (G1281, Solarbio, China). The tubular injury score based on a semi-quantitative assessment of tubular rupture, dilatation, rupture, and casts was assessed on ten random tissue sections per mouse [18]. The scoring range was 0–5: 0, no lesion; 1, < 10%; 2, 10 to 25%; 3, 26 to 50%; 4, 51 to 75%; 5, > 75%.
Laser doppler perfusion imaging
To measure the renal blood flow, we are going to perform the Laser Doppler perfusion imager by a LDI system (PeriCam PSI System) before ischemia insult (0), after 40 min of ischemia (40 min) and after 72 h of reperfusion (72h). Simultaneously, images were analysed using Pericam PSI software, and the perfusion value was calculated and divided by the baseline measurement to obtain a percentage representing the relative changes in blood flow.
TUNEL staining
The 3 μm section of kidney tissue was deparaffinized. Apoptotic cells were then demonstrated with the commercial TdT-mediated dUTP nick end labeling (TUNEL) kit (K1133, Apexbio, USA). Green TUNEL-positive nuclei were observed and photographed using a fluorescence microscope. TUNEL-positive cells were counted in 6 fields (400×) per slide using a fluorescence microscope (Olympus, Japan) according to the manufacturer's protocol.
Flow cytometry
For the detection of immune cell phenotypes in kidneys, mononuclear cells from kidneys were isolated according to the previously described method [19]. Both kidneys were minced and incubated in collagenase D (5 mg/mL, Sigma-Aldrich) solution for 30 min at 37 °C. Single cell suspensions of kidney digestions were obtained by mechanical disruption of tissues using 70-μm strainers (BD Bioscience), and kidney mononuclear cells were isolated using isotonic Percoll density gradient centrifugation. As previously described, flow cytometric analysis was performed [20]. Specifically, cells were stained in FACS buffer (PBS, 2% FBS, 0.1% sodium azide) and pre-incubated with anti-CD16/CD32 antibody for 15 min to reduce non-specific binding through the Fc receptor. Fluorochrome conjugated monoclonal antibodies (mAbs) including CD45-APC, CD4-FITC, CD11b-FITC, F4/80-APC, CD86-PerCP-Cyanine5.5, IFN-γ-PE, IL-17-PerCP-Cyanine5.5, and CD206-PE were purchased from BioLegend, Inc.. In addition, cells from the kidneys were fixed and permeabilized using a Cytofix/Cytoperm™ Fixation/Permeabilization Kit (BD, USA) and stained intracellularly for IFN-γ-PE, IL-17-PerCP-Cyanine5.5, Foxp3-APC, and CD206-PE. They were incubated with the appropriate cocktail of fluorochrome-conjugated monoclonal antibodies for 50 min at 4 °C, washed, and resuspended in FACS buffer. Samples were analyzed on a BDFACS Canto™II flow cytometer and FlowJo 10.8.1.
Immunofluorescence
Renal inflammatory macrophage infiltration was assessed by immunofluorescence. The kidneys were removed, fixed in 10% buffered formalin, embedded in paraffin, and cut into 3 μm-thick sections. Then, the sections were permeabilized with Triton X-100 (0.2%) in PBS, followed by blocking with 10% goat serum. Sections were stained with the following antibodies: rat anti-mouse F4/80 antibody (1:200, ab6640, Abcam) and rabbit anti-mouse iNOS antibody (1:250, ab178945, Abcam), rabbit anti-mouse CD206 antibody (1: 500, ab64693, Abcam). Fluorescence-conjugated secondary antibodies were mixed and used as the second antibodies. Positive cells in the cortex were numbered in five non-overlapping fields of view at 400 × magnification and the average cell counts were used for analysis.
Bone marrow derived macrophages (BMDMs)
To isolate BMDMs, bone marrow cavities were rinsed with PBS, which were then filtered and subjected to erythrocyte lysis as previously described [21]. Isolated cells were grown in high glucose DMEM (Gibco, USA) supplemented with 10% FBS, 1% penicillin/streptomycin, and 20 ng/mL recombinant mouse macrophage colony-stimulating factor (M-CSF) (RP01206, Abclonal, China), with the medium being changed every 2 to 3 days. Mature BMDMs were randomly assigned to 4 groups: LPS, LPS + Exo, LPS + CD73−/− Exo, and LPS + CD73−/−Exo + Recombinant CD73 Protein (30 ng/mL, RP01447, Abclonal) (n = 3 in each group). BMDMs isolated from the different treatment groups were analyzed for phenotype, protein expression, and cytokine secretion.
Cellular uptake of exosome in vitro
PKH26-labelled ERC-Exo or CD73−/− ERC-Exo were incubated with BMDMs for 3 h. After three washes with PBS, BMDMs incubated with ERC-Exo or CD73−/− ERC-Exo were fixed with 4% PFA, blocked for 20 min at room temperature, and incubated with anti-F4/80 antibody (1:200, ab6640, Abcam) at 4 °C overnight. After three washes with PBS, the cells were incubated with FITC-conjugated anti-rat secondary antibody (1:500, ab150157, Abcam) for 1.5 h at room temperature. The cells were washed 3 times with PBS, and the nuclei were counterstained with DAPI (ab285390, Abcam, USA). Fluorescence imaging was performed by a fluorescence microscope (Olympus, Japan) and analyzed using the Image J software.
Western blotting
ERC-exo, BMDMs, and kidney tissues were lysed in RIPA lysis buffer (R0010, Solarbio, China) containing protease (K1007, APExBIO, USA) and phosphatase inhibitor cocktail (K4003, APExBIO, USA). The BCA assay (PC0020, Solarbio, China) determined protein concentration according to the manufacturer's instructions. Equal protein samples (40 μg per lane) were separated by 10% SDS-PAGE. The samples were transferred to PVDF membranes (0.45 μm; Millipore). The membranes were blocked in TBST with 5% BSA for 2 h at room temperature and incubated with primary antibodies as follows: CD63 (1:1000, A19023, ABclonal), CD81 (1:1000, A4863, ABclonal), TSG101 (1:1000, A5789, ABclonal), Calnexin (1:1000, A4846, ABclonal), Arginase-1 (1:1000, 93668S, CST), iNOS (1:1000, 13120S, CST), ERK1/2 (1:1000, A4782, ABclonal), P-ERK1/2 (1:1000, AP0485, ABclonal), P38 (1:1000, A4771, CST), P-P38 (1:1000, AP1311, ABclonal), and GAPDH (1:1000, 2118S, CST) at 4 °C overnight. The membranes were washed three times in TBST (15 min each time) and then incubated with HRP-conjugated secondary antibody (1:3000, #7074S; CST) for 40 min at room temperature. The membranes were detected by enhanced chemiluminescence (WP20005, Thermo Fisher Scientific, USA) after three washes (15 min each). The densitometry of protein bands was quantified and analyzed using ImageJ software.
Co-culture of macrophages and T cells
CD4+ naïve T cells were isolated from splenocytes using CD4 (L3-T4) Microbeads (130-117-043, Miltenyi Biotec) and seeded into 96-well plates (105/well) supplemented with 10 ng/mL recombinant IL-2 (Abclonal, China), 5 µg/mL precoated anti-mouse CD3 (Biolegend, USA) and 3 µg/mL anti-mouse CD28 (BioLegend, USA). BMDMs were seeded in 96-well plates and allowed to acclimate for 24 h. Macrophages were primed with 200 ng/mL LPS for 48 h and washed 3 times. CD4+ T cells in a complete medium were added to the macrophage and co-cultured for another 72 h. These cells were maintained in a CO2 (5%) incubator at 37 °C. Staining was carried out using a Cytofix/Cytoperm™ Fixation/Permeabilization Kit (BD, USA) according to the manufacturer’s instructions. Tregs were stained using a fluorescent-conjugated anti-Foxp3-APC (1:100, BioLegend, USA). Samples were analyzed on a BDFACS Canto™II flow cytometer and FlowJo 10.8.1.
Enzyme-linked immunosorbent assay (ELISA)
The concentrations of IL-6, IL-1 β, TNF-α, and IL-10 in kidney homogenate and cell supernatants were assessed using corresponding commercial ELISA kits (DAKEWE, China) following the manufacturer’s instructions. The optical density (OD) value was measured with a microplate reader(Safire2, TECAN, Switzerland).
Statistical analysis
Graphing and statistical analyses were performed using GraphPad Prism v.9.5.0 (GraphPad Software). Results are expressed as mean ± standard error of the mean (SEM). The Shapiro–Wilk test was used to assess the normality of continuous variables. Unpaired two-tailed Student’s t-tests between two groups and one-way ANOVA followed by Tukey’s multiple comparison post hoc test were used to test differences among multiple groups. Statistical significance was set at *P < 0.05, **P < 0.01, ***P < 0.001, and the most significant for ****P < 0.0001.


Comments (0)