Statistical analysis
Statistical calculations were performed using GraphPad Prism 10 software. Student’s t test was used to compare means between two groups of data and one-way ANOVA was used to compare three or more groups of data. ANOVA calculations were followed up by Tukey’s multiple comparison test to determine differences between samples. Means of experimental groups were considered significant when p value was < 0.05.
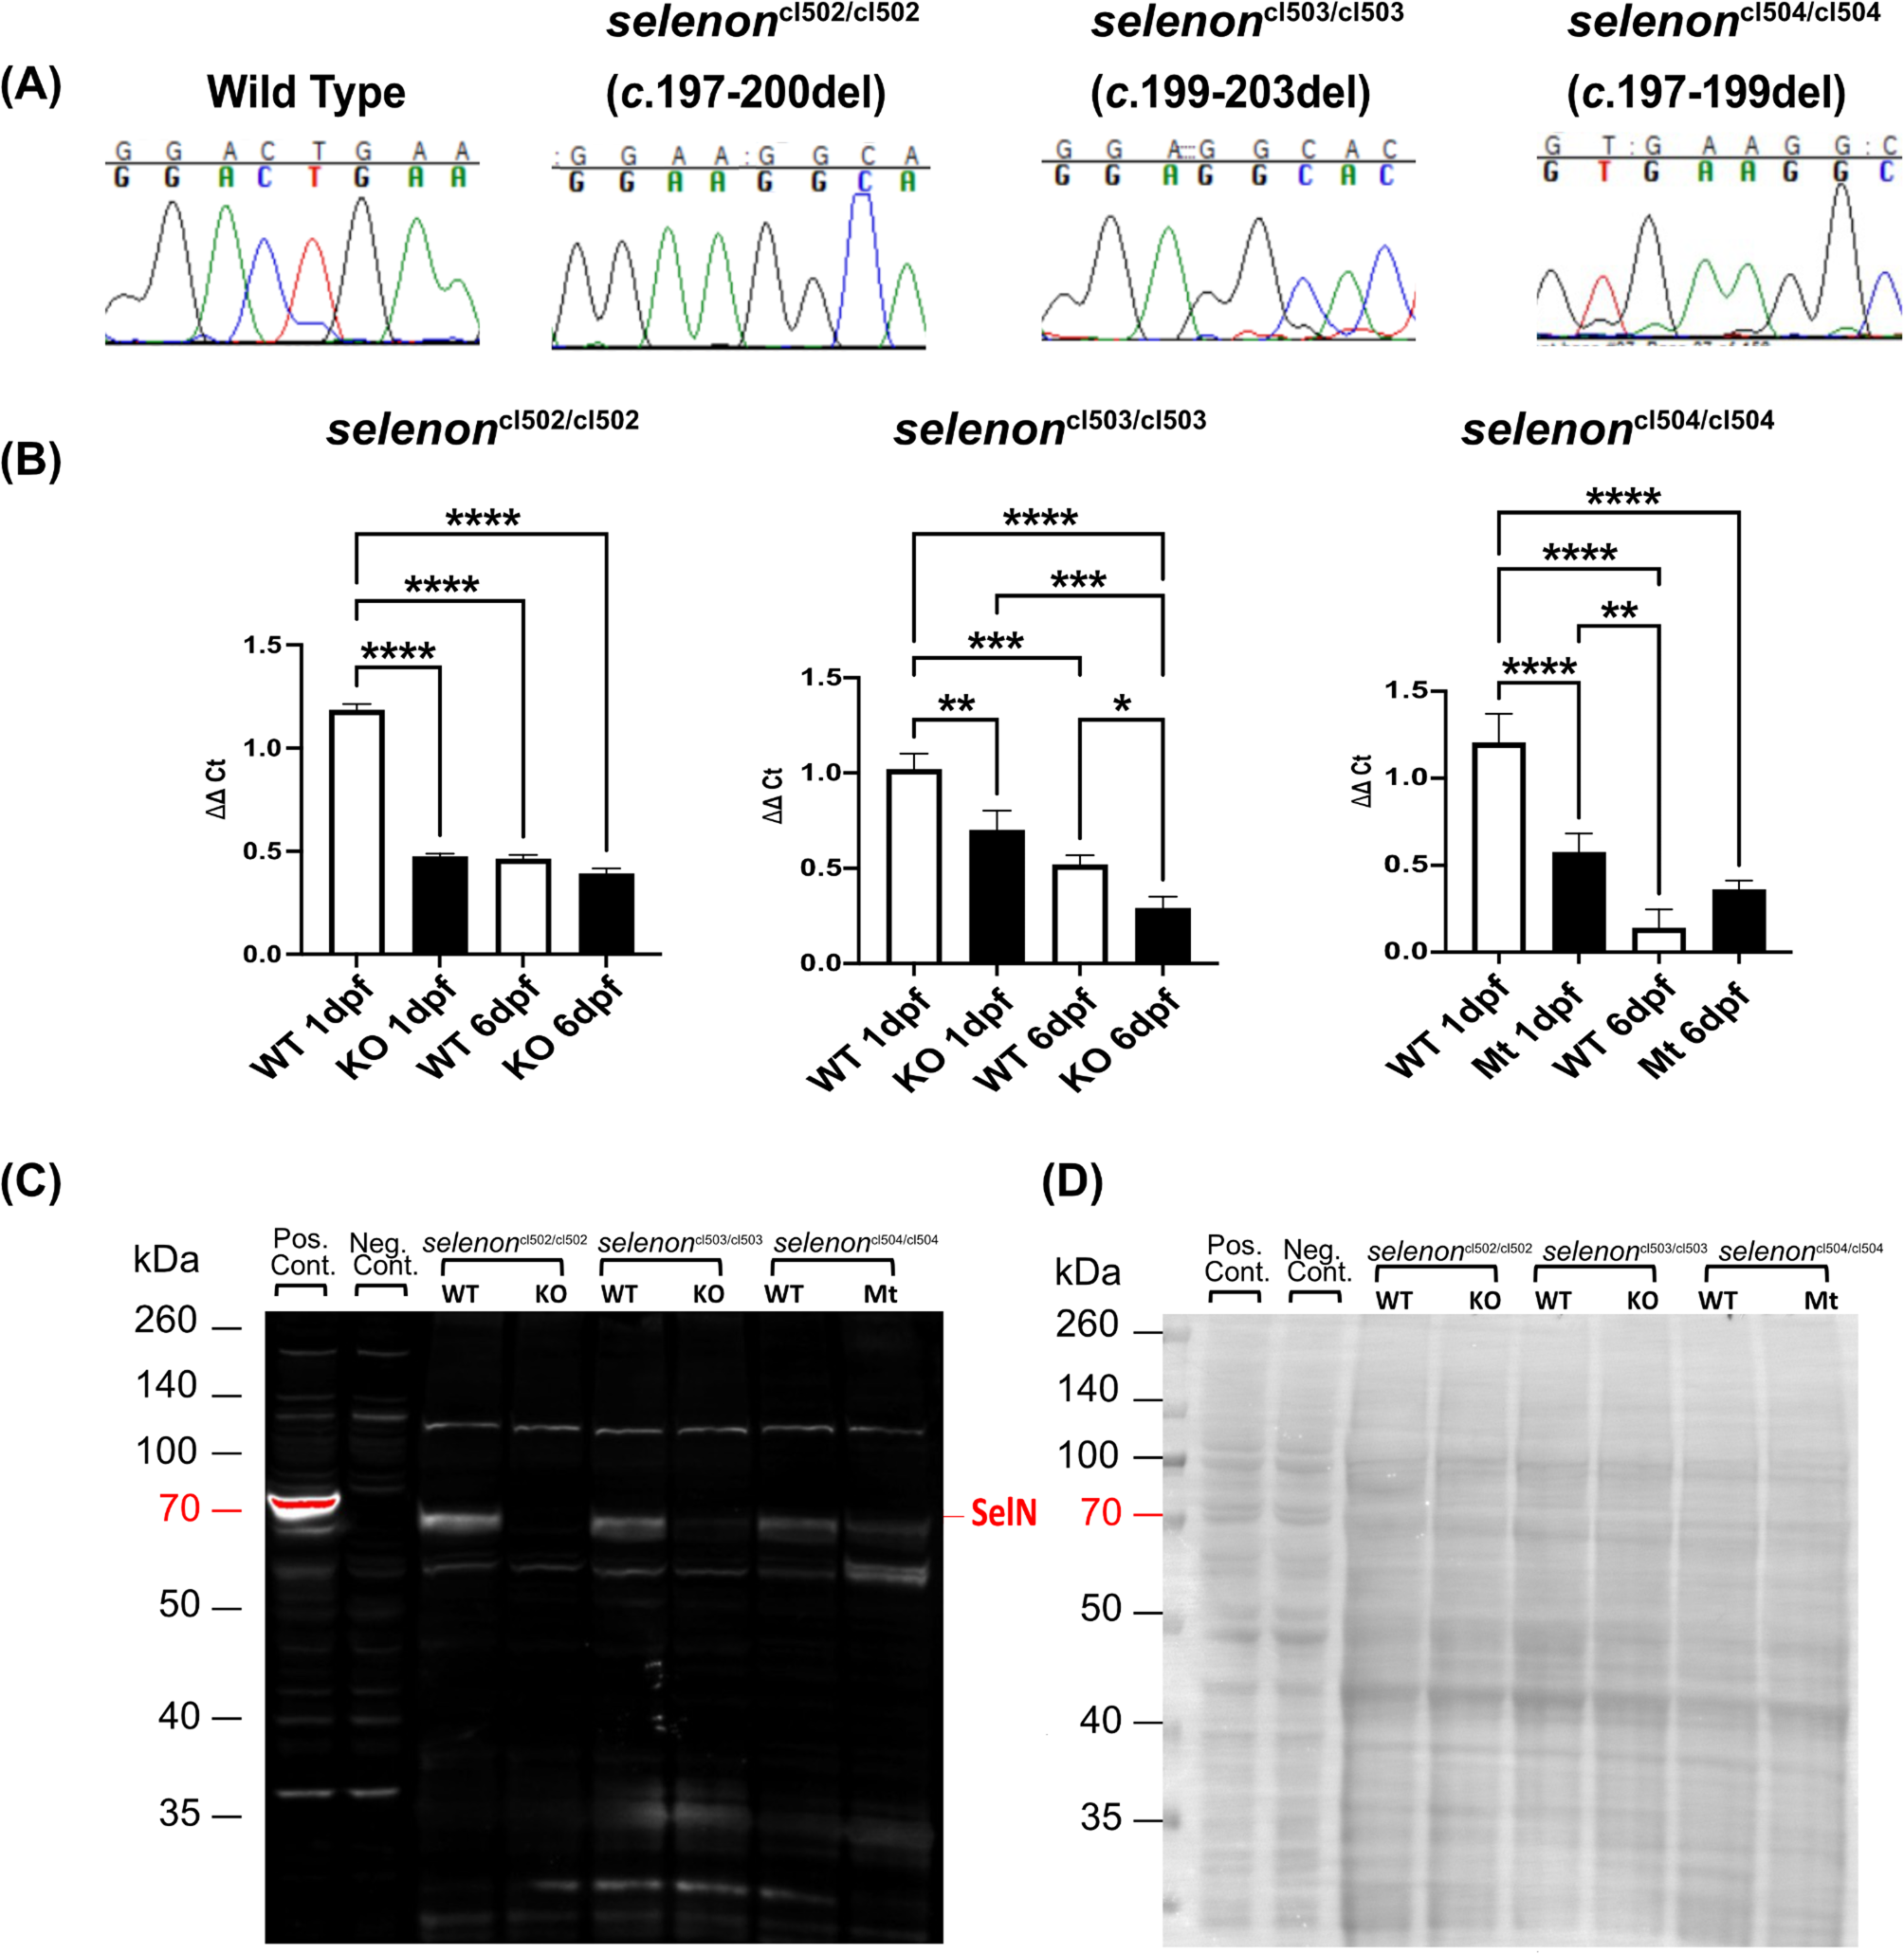
Generation of SELENON-CM zebrafish models
To generate zebrafish lines with mutations in the selenon gene, we induced mutagenesis using CRISPR-Cas9 system Gene Art Platinum Cas9 Nuclease (Thermo Fisher Scientific, Waltham, MA). This was achieved by performing mRNA microinjections into one-cell AB zebrafish embryos targeting exon 2. The guide RNA (gRNA) used to target this exon was 5’-AUU GUA GGA GGC AGG ACU GA-3’. This resulted in the generation of mosaic mutations in exon 2 of the selenon gene. These eggs were then reared and bred to AB wild type (WT) fish to generate heterozygous carriers. After Sanger sequencing and selecting mutations of interest fish were outbred to AB WT. Finally, each heterozygous mutation was intercrossed to generate experimental fish: homozygous knock outs (KO), heterozygotes (HET), and WT in ratios of 1:2:1.
Zebrafish real time qPCR
We quantified selenon transcripts in zebrafish using PrimePCR multiplex real time quantitative PCR (RT-qPCR) system by Bio-Rad (Hercules, CA). We extracted and purified total RNA from cells and zebrafish using Trizol LS reagent (Ambion) following protocol by Peterson et al., 2009 [30]. Reverse transcription and qPCR assays were performed using Reliance One-step multiplex RT-qPCR Master Mix (Bio-Rad). We included two housekeeping genes determined by Reference Gene H384 panel by Bio-Rad: rps18 and ppia. Analysis was performed using CFX Maestro Software by Bio-Rad.
Zebrafish western blotting
For protein quantification of SelN in zebrafish embryos, we created new antibodies against the C-terminal domain of SelN for both zebrafish and mouse isoforms (Biomatik, Kitchener, Ontario). The amino acid sequence targeted for these antibodies were QEGLEKAKPYLES for zebrafish and KEGLRRGLPLLQP for mouse. Cells and 2 days post fertilization (dpf) deyolked and dechorionated zebrafish (according to [31]) were extracted for total protein using RIPA lysis buffer (Thermo Fisher Scientific) with protease inhibitors (Thermo Fisher Scientific). Using NuPAGE-Tris Acetate western blot system by Invitrogen (Carlsbad, CA) we separated our proteins by size and transferred them onto a PDVF blot. Ponceau stain (Sigma Aldrich, St Louis, MO) was used to image total protein transferred. Finally, we immunoblotted against SelN at a 1:500 dilution and rhodamine labeled anti-tubulin antibody (Bio-Rad) at 1:5,000 concentration. Blots were imaged using a ChemiDoc MP Imaging System by Bio-Rad.
Zebrafish spontaneous coiling assay
To measure spontaneous coiling, we set up zebrafish breeding pairs overnight with dividers and began mating the following day. Fish were harvested in windows of 30 min and time was annotated to maintain consistency. Twenty-four hours later, embryos were placed under a light microscope and recorded for 3 min. Cycles of ~ 15 embryos were recorded alternating mutant and WT fish for one hour. To quickly fit ~ 15 embryos under the microscope field of view we 3D printed a 1.4 mm wide grid (Supplemental File 1). Videos were analyzed using DanioScope version 1.1 software (Noldus, Wageningen, the Netherlands).
Zebrafish hatching assay
To measure changes in hatching we set up HET by HET zebrafish breeding pairs overnight with dividers and began mating them the following day at the same time. One hour later we harvested the eggs and allowed them to grow overnight. On day 1 post-fertilization eggs were transferred to three 96-well plates for observation. Hatching counts were performed 4 times a day until all eggs had hatched. On 4 dpf fish were euthanized and genotyped.
Zebrafish swim activity assay
Six dpf zebrafish larvae were placed in 48-well plates and tested for swim activity using an activity monitor by Zantiks (Cambridge, UK). The protocol used during activity recording included: 10 min acclimation, 20 s vibration, 5 min light, 5 min dark, 5 min light, 5 min dark, and then repeat the same steps. Data were analyzed using an in-house generated MatLab script (see Supplemental File 2).
Analysis of embryonic zebrafish single cell RNAseq atlas
Single-cell RNAseq (scRNAseq) data from Wagneret al. 2017 [24] were downloaded. We extracted gene expression data using the Python package scanpy v1.9.1. In total, 30,677 genes with their averaged expression data across six samples in the scRNAseq data were extracted. 903 genes were removed during QC step for having missing data and/or zero variance. Expression matrix was loaded on R version 4.0.2 for analysis. Adjacency matrix for the remaining 29,774 genes was generated using the Weighted Gene Correlation Network Analysis (WGCNA) package [32]. Soft thresholding from the scale-free topology model was used to reduce ‘noise’ of correlations in the adjacency matrix. A Topology Overlap Matrix (TOM) was generated from the adjacency matrix and converted to a dissimilarity matrix by subtracting the TOM matrix from 1. Samples were clustered using the ‘hclust average’ method. 136 gene modules were identified using the dynamic tree cut method on the generated clusters using the WGCNA R package with a minimum of 30 genes per module. To distinguish between these, modules were labeled as colors using the labels2colors function. Twenty core merged modules were generated by merging modules with a similar matrix (distance threshold < 0.25). The genes in each module demonstrate a similar expression profile and co-express. Pearson correlation was generated for each module against clinical traits, i.e., time point. Significance of the correlation of each gene against the time point was computed. Two core modules, ‘antiquewhite1’ (4516 genes) and ‘firebrick2’ (240 genes) having significant p-values < 0.05 for correlation with selenon were identified. 3339 genes with positive association (weighted threshold > 0.02) toselenon (sepn1) from ‘antiquewhite1’ and 168 genes from ‘firebrick2’ modules were exported using the exportNetworkToCytoscape function and were used to generate interaction networks on CytoScape v3.8.2 software. KEGG pathway and GO term enrichment analysis of significant modules was performed using clusterProfiler package (v3.16.0) [33]. Enriched pathways were identified as terms with p.adj < 0.05.
Cell culture
C2C12 mouse myoblasts (American Type Culture Collection, Manassas, VA) were maintained in growth medium (DMEM supplemented with 20% Fetal Bovine Serum, Certified; GIBCO, (Invitrogen) in 10% CO2. For differentiation, cells were allowed to grow to 90–100% confluence and switched to differentiating medium (DMEM containing 2% Horse Serum; GIBCO, Invitrogen) that was subsequently changed every 24 h.
C2C12 selenon knock down
RNAi-Ready pSIREN-RetroQ vector (Clontech, Inc. Mountain View, CA) was used to prepare shRNA constructs targeting Selenon gene (KD1: TTCAAACCCATTGCGGAGA, KD2: GCAAACCATGAATTGGAAAGT, and KD3: CATGATTGACAGCCGCCTG). These constructs were transfected into the 293 Ecopack packaging cell line (Clontech) using Lipofection 2000 transfection reagent (Invitrogen) to generate retrovirus particles. 48 h after transfection, the viral supernatant was harvested and used for transduction of C2C12 cells. The virus was removed 6 h after the infection and fresh growth medium containing puromycin was added to C2C12 cells allowing the selection of infected cells. For each shRNA target 3 replicate plates of C2C12 cells were transduced and were subsequently processed as independent cultures.
Cellular RNA extraction and qRT-PCR
Total RNA was extracted and purified from C2C12 cells using RNeasy kit (Qiagen, Valencia, CA) according to the manufacturer’s instructions. RNA was treated with DNase I Amplification Grade (Invitrogen). cDNA synthesis preparation was performed using the SuperScript First-Strand synthesis system for RT-PCR (Invitrogen). Real-time quantitative RT-PCR was carried out using the TaqMan probe-based chemistry (Applied Biosystems, Foster City, CA) on an ABI Prism 7300 Real Time PCR System.
Cellular western blotting
Cell cultures in 100 mm dishes were washed twice with PBS and scraped into 300 µl of sample buffer. Lysates were denatured for 5 min at 95 °C, sonicated with Branson Sonifier 250 to shear DNA and centrifuged for 10 min at 16,000 rcf. Soluble proteins were quantified by Lowry’s method using the DC Protein Assay Kit (Bio-Rad, Hercules, CA). Twenty micrograms of whole cell extracts were resolved on 4 − 12% SDS-polyacrylamide gels and transferred onto Ready gel blotting sandwiches immune-blot PVDF membranes (Bio-Rad) using a XCell II™ Blot Module (Invitrogen). Membranes were then probed with crude SelN antibody raised in rabbit (1:500). After incubation with HRP-conjugated AffiniPure Goat Anti-Rabbit IgG (1:10,000), reactive proteins were visualized with Supersignal West Pico Chemiluminescent substrate (Thermo Fisher Scientific).
Glutathione assay in cells and zebrafish
Zebrafish and cells were tested for oxidized and reduced forms of glutathione (GSH) using a Glutathione Colorimetric Detection Kit (Thermo Fisher Scientific). Five 6 dpf zebrafish per sample were humanely euthanized and homogenized using 100ul of 100mM phosphate buffer, pH7. Procedure for both cell and zebrafish was continued as indicated by the manufacturer. Colorimetric reaction was measured using a plate reader every minute for 20 min.
ROS quantification in C2C12 cells
Intracellular ROS was measured using CM-H2DCFDA (Invitrogen). Briefly 3 samples per group of cells were detached by trypsin and washed in PBS and spun down. The cell pellets were then resuspended in 100 µl of PBS containing 5 µM CM-H2DCFDA and incubated at 37ºC for 15 min. Cells were then washed with PBS and resuspended in 0.5 ml of PBS. 10,000 cells per sample were analyzed for fluorescence using Becton Dickinson FACS-Vantage SE flow cytometer. The data were analyzed using Flowjo software (Tree Star, Inc., OR).
Carbonylation and nitrosylation assay
Total carbonylated proteins were quantified using OxyBlot Protein Oxidation Detection Kit (Millipore, Billerica, MA) following manufacturer’s instructions using 15 µg of total protein detected with rabbit anti-DNP antibodies (Invitrogen) at 1:1,000 and HRP-conjugated AffiniPure Goat Anti-Rabbit IgG (1:10,000). Total S-nitrosylated proteins were measured using an S-nitrosylated Protein Detection Assay Kit (Cayman Chemical Company, Ann Arbor, MI). Both carbonylated and S-nitrosylated proteins were detected using Supersignal West Pico Chemiluminescent substrate (Thermo Fisher Scientific) and quantified by scanning the gels on a ChemiDoc XRS gel documentation system and analyzed using Quantity One software v. 4.5.2 (Bio-Rad). The top of each gel was defined as Relative front (Rf) = 0 and the bottom as Rf = 1. Repeated intensity measurements were made down the center of each lane at intervals of Rf = 0.0043.
Generation of Selenon knock out C2C12 cell lines
Using CRISPR-Cas9 system we stablished two new Selenon-null C2C12 myoblast lines. These lines were generated independently. One resulted in mutations in exon 5 of the Selenon gene, and the second one in exon 3. This was achieved by using lipofectamine and transfecting with LentiCRISPRv2 plasmids. The following sequences were used to clone gRNAs coding regions in the plasmids for selenon exon 3 or exon 5 gRNA’s: Ex3-F 5’-caccgTATGGTAAGAGTCTCCTCGC-3’, Ex3-R 5’-aaacGCGAGGAGACTCTTACCATAc-3’, Ex5-F 5’-caccgGGCAAAGCGGGTCTTCACGA-3’, and MouseSepnEx5-gRNA-R 5’-aaacTCGTGAAGACCCGCTTTGCCc-3’. Puromycin antibiotic was used to select for transfected cells and single cells were isolated and grown individually. New single colonies were expanded and sequenced to identify null mutations.
Primary myoblast isolation
To isolate primary myoblasts from our SELENON-CM mouse model, we euthanized and dissected the quadricep muscles from 3-month-old mice. We then followed myoblast isolation protocol by Shahini et al., 2018 [34]. Myoblasts were frozen in 10% DMSO growth media and utilized up to 7 passages.
Seahorse (Agilent) metabolic function in myotubes and zebrafish embryos
To test metabolic function in C2C12 cells, primary cell lines, and 24 h post fertilization (hpf) zebrafish embryos we used the Seahorse XFe96 Analyzer by Agilent (Santa Clara. CA) following manufacturer instructions. For zebrafish experiments we placed a single dechorionated embryo in XFe96 Spheroid Microplate per well in Danio water and measured real time metabolic activity using the following protocol: Port A injected a final concentration of 12.5 μm oligomycin, port B injected 2 μm FCCP and 1mM sodium pyruvate, port C injected 10 μm rotenone and antimycin-A, and port D injected 5mM 2-deoxyglucose. Timing between measurements was: 2 min mixing, 1 min wait, and 2 min measure, repeated 5 times for baseline and after each port injection.
C2C12 cells and primary myoblasts, cells were seeded onto XFe96 Cell Culture plates precoated with 0.09 mg/ml Matrigel (Corning Inc., Corning, NY). The following day cells were differentiated using 2% horse serum media for C2C12 and according to [34] instructions for primary cells, for 5 days. Myotubes were then tested in the Seahorse XFe96 Analyzer using the following protocol: Port A injected a final concentration of 1.5 μm oligomycin, port B injected 1.5 μm FCCP and 1mM sodium pyruvate, port C injected 2.5 μm rotenone and 1.5 μm antimycin-A, and port D injected 5mM 2-deoxyglucose. Timing between measurements was: 2 min mixing, 1 min wait, and 2 min measure, repeated 3 times except for measurements after port B, which were repeated 5 times. Immediately upon assay completion, leftover media was carefully removed, and cells were lysed for creatine kinase assay and protein concentration for normalization. Colorimetric creatine kinase activity assay (Abcam, Cambridge, UK) was performed after each Seahorse assay followed by BCA protein assay (Thermo Fisher Scientific).
Ultrastructure imaging of zebrafish using transmission electron microscopy
Six dpf zebrafish larvae were euthanized and placed in glutaraldehyde fixative diluted in fish water at a 1:1 ratio. After 2 days, fish were sectioned and prepared for transmission electron microscopy (TEM) imaging using JEOL 1200EX-80 kV microscope. Slow twitch fibers were identified as adjacent to the skin and myofibrils were imaged at 2500X. At least 13 images were recorded for each fish and mitochondria areas were quantified using Image J software.


Comments (0)