
Remember me
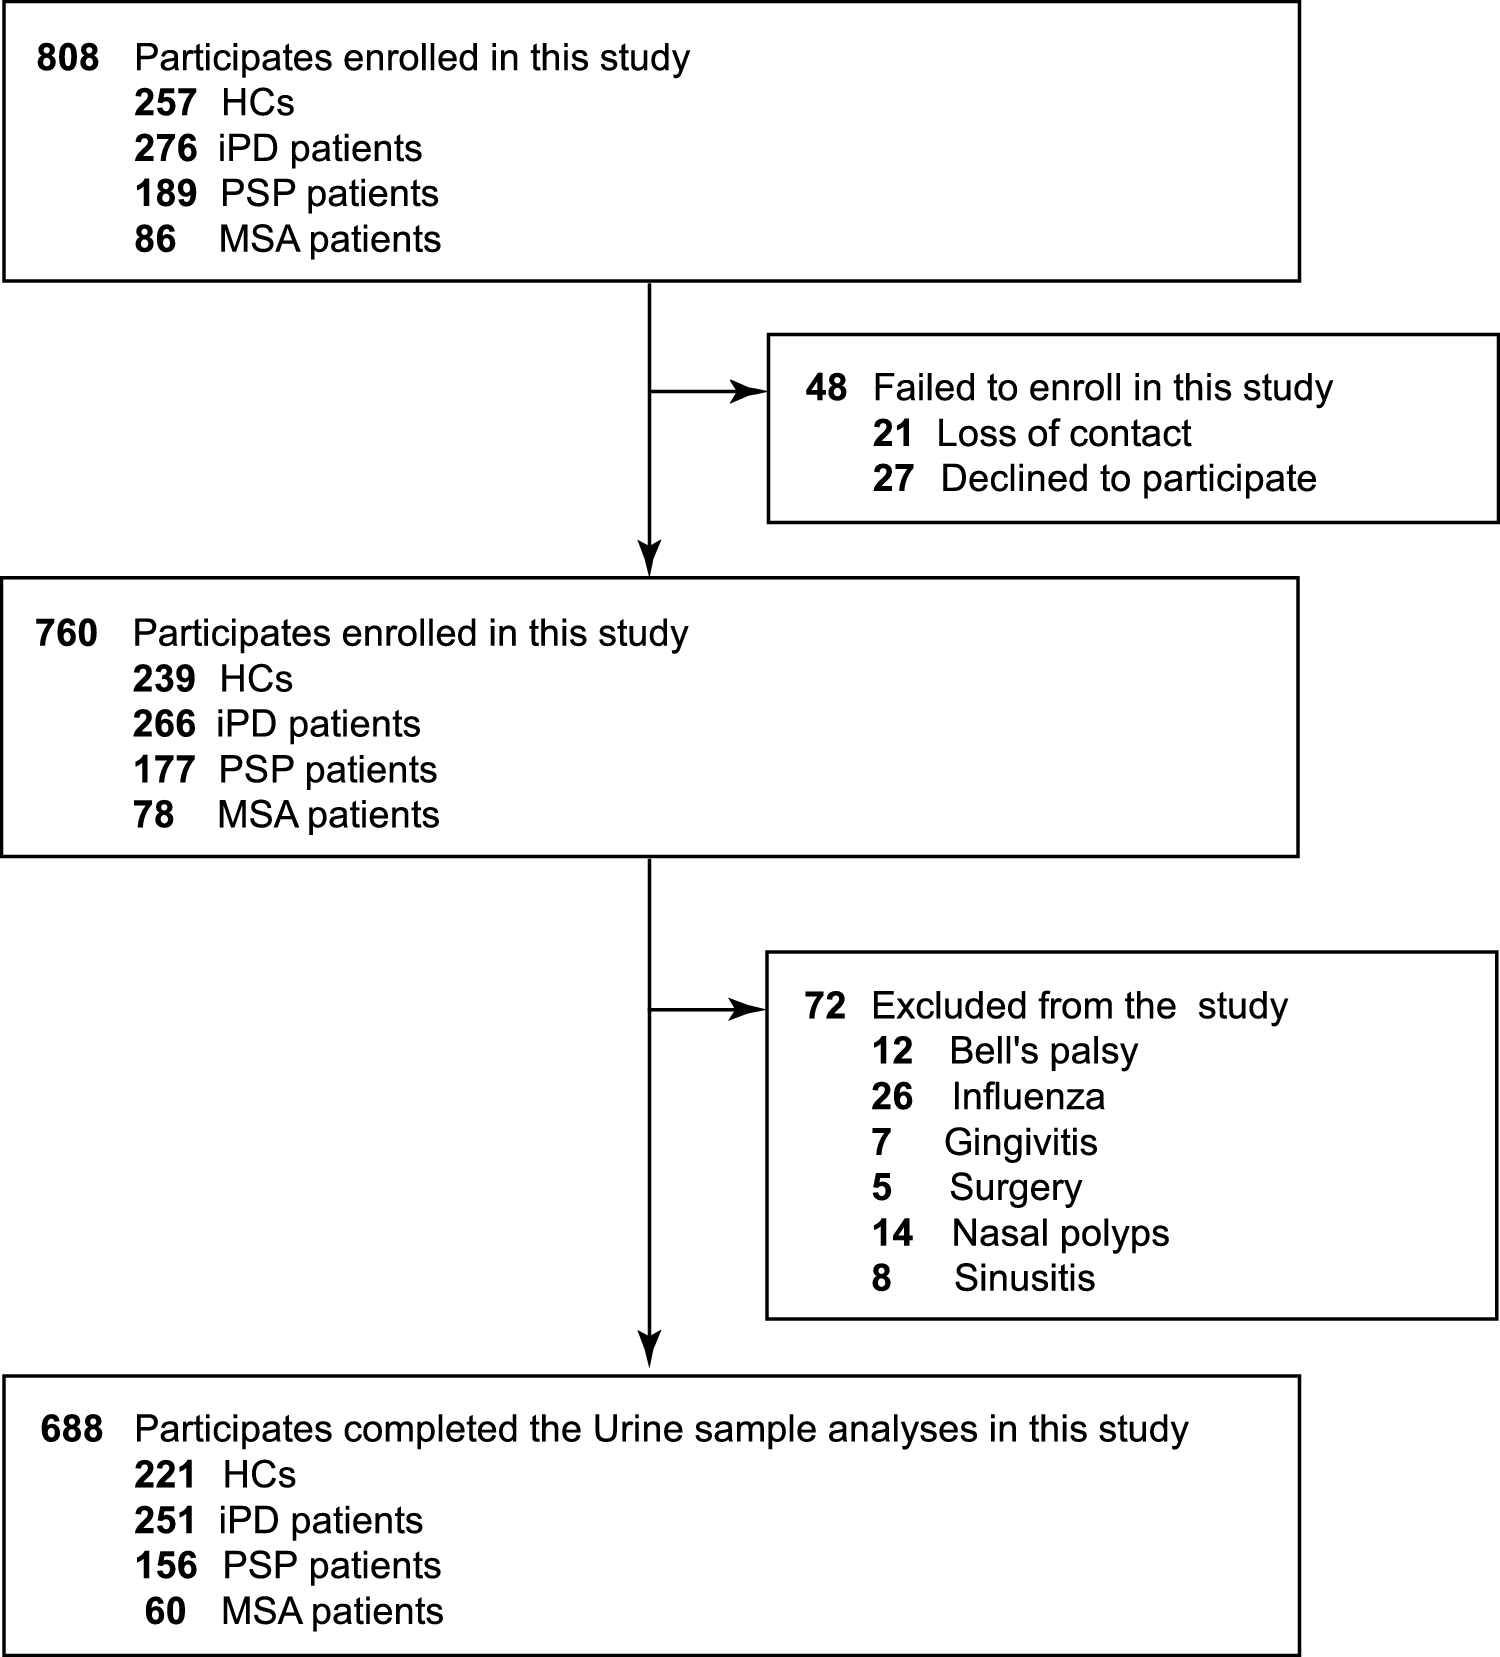


In our study, a total of 808 new participants were initially recruited, including 257 HCs, 276 patients with iPD, 189 with PSP, and 86 with MSA. Among these, 48 participants (5.94%) who declined participation or could not be contacted due to incomplete or outdated contact information were excluded. Additionally, 72 participants (8.91%) who reported taste loss due to non-idiopathic causes (such as Bell's palsy, influenza, gingivitis, surgery, nasal polyps, or sinusitis) were also excluded from the study. Ultimately, 688 participants (85.15%) successfully completed clinical and taste assessments as per the Consolidated Standards of Reporting Trials (CONSORT) flow diagram (Fig. 1).
The demographic characteristics of the participants are detailed in Table 1. There were no significant differences observed in gender, age, or BMI across the four groups (P = 0.9878, P = 0.4182, and P = 0.3354, respectively). Similarly, there were no significant variations in H&Y, UPDRS, and GSRS scores among iPD, PSP, and MSA patients (P = 0.4510, P = 0.9772, and P = 0.9606, respectively). However, iPD patients exhibited significantly longer disease durations compared to PSP (P = 0.0014) and MSA patients (P = 0.0298). Notably, there was no significant difference in disease duration between PSP and MSA patients (P = 0.9988). Cognitive assessments, including MMSE and MoCA, indicated lower scores in PSP patients compared to iPD (P < 0.0001 and P < 0.0001, respectively) and MSA (P = 0.0001 and P < 0.0001, respectively) patients. However, MMSE and MoCA scores did not significantly differ between iPD and MSA patients (P = 0.9761 and P = 0.1885, respectively).
Table 1 Demographics and clinical characteristics of the subjects in the studyTaste impairmentThe distribution of taste scores among study participants is depicted in Fig. 2. Our taste assessment indicated that HCs achieved significantly higher scores for correctly identifying tastes compared to patients with iPD, PSP, and MSA (Fig. 2, and Supplementary Fig. 2). Specifically, in the sweet taste test, mean scores were 3.41 for HCs, 3.10 for iPD, 3.13 for PSP, and 3.17 for MSA (P = 0.0117). Notably, iPD patients showed significantly lower scores compared to HCs (P = 0.0098), while no significant differences were observed among HCs, PSP, and MSA patients (P = 0.0741, P = 0.4153, and P = 0.9975, respectively) (Table 1, Fig. 2A). In detail, mean scores were 3.41 for HCs, 2.69 for iPD, 3.17 for PSP, and 2.90 for MSA (P < 0.0001) in the salty taste test. Here, iPD and MSA patients had significantly lower scores compared to HCs (P < 0.0001 and P = 0.0105, respectively), while no significant difference was found between HCs and PSP patients (P = 0.1630). Additionally, iPD patients exhibited lower scores than PSP patients (P = 0.0002) (Table 1, Fig. 2B). For the sour taste test, mean scores were 3.19 for HCs, 2.71 for iPD, 2.76 for PSP, and 3.15 for MSA (P < 0.0001). Scores were significantly lower in iPD and PSP patients compared to HCs (P < 0.0001 and P = 0.0029, respectively), with no significant difference observed between HCs and MSA patients (P = 0.9967). Furthermore, iPD patients showed lower scores compared to MSA patients (P = 0.0029) (Table 1, Fig. 2C). In the umami taste test, mean scores were 3.27 for HCs, 2.65 for iPD, 2.75 for PSP, and 2.63 for MSA (P = 0.0001). Scores were significantly lower in iPD, PSP, and MSA patients compared to HCs (P = 0.0001, P = 0.0182, and P = 0.0342, respectively), with no significant differences among iPD, PSP, and MSA patients (P = 0.8214, P > 0.9999, and P = 0.9371, respectively) (Table 1, Fig. 2D). In the bitter taste test, mean scores were 3.87 for HCs, 3.23 for iPD, 3.58 for PSP, and 3.58 for MSA (P < 0.0001). Scores were significantly lower in iPD, PSP, and MSA patients compared to HCs (P < 0.0001, P = 0.0057, and P = 0.0041, respectively), with no significant differences observed between iPD and MSA patients (P = 0.8374), or between PSP and MSA patients (P = 0.7599). Notably, iPD patients had lower scores than PSP patients (P = 0.0029) (Table 1, Fig. 2E). Figure 2F illustrates the distribution of total TTS across the four study groups. Statistical analysis revealed significantly lower TTS in iPD, PSP, and MSA patients compared to HCs (P < 0.0001, P < 0.0001, and P = 0.0002, respectively). Moreover, TTS was significantly lower in iPD patients compared to PSP and MSA patients (P = 0.0024 and P = 0.0464, respectively), with no significant difference between PSP and MSA patients (P = 0.9988) (Table 1, Fig. 2F). In the MSA group, there were no significant differences in the taste test results for sweet, salty, sour, umami, and bitter flavors, as well as in TTS, between MSA-parkinsonian and MSA-cerebellar subtypes. (Supplementary Fig. 3).
Fig. 2
The distribution and comparison of taste scores. The comparison of taste scores in sweet (A), salty (B), sour (C), umami (D), bitter (E) test, and TTS (F) among the HCs, iPD, PSP and MSA groups. All box-and-whisker plots depict the median, quartiles and range. G The distributions of HCs, iPD, PSP and MSA in absolute numbers and relative percentage among perfect taste function, hypogeusia, and ageusia. Statistical significance was determined by Kruskal–Wallis one-way analysis of variance with post hoc testing
To further explore the impact of parkinsonism on TTS, we stratified TTS into three categories: Class I (perfect taste function), Class II (hypogeusia), and Class III (ageusia). Among HCs, 42 (19.00%) demonstrated perfect taste function, while 117 (80.09%) had hypogeusia, and 2 (0.90%) had ageusia (Supplementary Fig. 2F). In contrast, among iPD patients, 11 (4.38%) had perfect taste function, 204 (81.27%) had hypogeusia, and 36 (14.34%) had ageusia (Supplementary Fig. 2G). Similarly, among PSP patients, 5 (3.21%) had perfect taste function, 143 (91.67%) had hypogeusia, and 8 (5.13%) had ageusia (Supplementary Fig. 2H). Lastly, among MSA patients, 1 (1.67%) had perfect taste function, 58 (96.67%) had hypogeusia, and 1 (1.67%) had ageusia (Supplementary Fig. 2I). The distribution of taste function classes revealed a significantly higher prevalence of hypogeusia and ageusia among iPD patients compared to other groups, indicating more pronounced gustatory dysfunction in iPD (Fig. 2G).
Correlation between taste impairment and clinical characteristicsThe association between taste scores and clinical characteristics was assessed in the study participants. Pearson’s correlation analysis revealed no correlation between age and taste scores among HCs or patients with iPD, PSP, or MSA (Supplementary Table 2). In iPD patients, significant correlation was observed between sweet taste scores and GSRS scores (P = 0.013, r = −0.156), and a similar correlation was noted between salty taste scores and MDS-UPDRS score (P = 0.048, r = −0.156). Additionally, sour taste scores showed mild negative correlations with MDS-UPDRS (P = 0.007, r = −0.168) and GSRS scores (P = 0.038, r = −0.131) in iPD patients. Umami taste scores were negatively correlated with MDS-UPDRS score (P = 0.012, r = −0.159), while bitter taste scores exhibited negative correlations with H&Y, MDS-UPDRS, SCOPA-AUT, and GSRS scores in iPD patients (P = 0.002, r = −0.197; P = 0.001, r = −0.202; P = 0.038, r = −0.131; and P = 0.005, r = −0.178, respectively). Moreover, TTS showed negative correlations with H&Y, MDS-UPDRS, and GSRS scores in iPD patients (P = 0.013, r = −0.157; P < 0.001, r = −0.283; and P < 0.001, r = −0.247, respectively) (Fig. 3A, Supplementary Table 2). Among PSP patients, salty taste scores exhibited small but significant correlations with MMSE and MoCA scores (P = 0.025, r = 0.180; and P = 0.026, r = 0.178, respectively), and TTS showed a correlation with H&Y score (P = 0.049, r = 0.256) (Fig. 3C, Supplementary Table 2). These findings suggest that taste scores are significantly associated with disease severity in iPD patients. Further validation was conducted through logistic regression analysis, which confirmed a negative correlation between TTS and disease severity assessed by H&Y staging scale and UPDRS in iPD patients (r = −0.1574, P = 0.0126; r = −0.2834, P < 0.0001, respectively) (Fig. 3D and E). Additionally, gastrointestinal function assessed by GSRS scores was significantly negatively correlated with TTS in iPD patients (r = −0.2466, P < 0.0001) (Fig. 3F).
Fig. 3
Association between the taste function and clinical characteristics in patients. A-C, Association between the taste function and clinical characteristics in patients with iPD (A), PSP (B) and MSA (C), respectively. D-F, Scatterplots showing the correlation analysis in patients with iPD between the TTS and H&Y (D), UPDRS (E) and GSRS (F), respectively. Associations were assessed using Spearman correlation (A-C). Solid line indicates regression line, and dotted lines border the 95% confidence interval using linear correlation analysis (D-F)
Predictive value of taste impairments for iPDWe performed ROC curve analyses of taste scores, as shown in Supplementary Table 3, to identify effective markers for stratifying Parkinsonism. In the sweet test, the ROC analysis distinguished HCs from iPD patients with an AUC (Area Under Curve) of 0.5585, specificity of 45.42%, and sensitivity of 63.80%. It also differentiated HCs from PSP patients with an AUC of 0.5757, specificity of 50.00%, and sensitivity of 63.80%. For the salty test, the analysis differentiated HCs from iPD patients with an AUC of 0.6456, specificity of 60.16%, and sensitivity of 60.63%. It also separated HCs from PSP patients (AUC = 0.5644, specificity = 49.36%, sensitivity = 60.63%), HCs from MSA patients (AUC = 0.6100, specificity = 55.00%, sensitivity = 60.63%), and iPD from PSP patients (AUC = 0.5891, specificity = 50.64%, sensitivity = 60.16%). In the sour test, the ROC analysis distinguished HCs from iPD patients (AUC = 0.6127, specificity = 64.14%, sensitivity = 54.75%), HCs from PSP patients (AUC = 0.6049, specificity = 64.74%, sensitivity = 54.75%), iPD from MSA patients (AUC = 0.5994, specificity = 51.67%, sensitivity = 64.14%), and MSA from PSP patients (AUC = 0.5896, specificity = 51.67%, sensitivity = 64.74%). For the umami test, the analysis identified differences between HCs and iPD patients (AUC = 0.5868, specificity = 57.77%, sensitivity = 53.39%), HCs and PSP patients (AUC = 0.5868, specificity = 63.46%, sensitivity = 53.39%), and HCs and MSA patients (AUC = 0.6189, specificity = 66.67%, sensitivity = 53.39%). In the bitter test, the analysis differentiated HCs from iPD patients (AUC = 0.6256, specificity = 29.48%, sensitivity = 95.93%), HCs from PSP patients (AUC = 0.6379, specificity = 32.69%, sensitivity = 95.93%), and HCs from MSA patients (AUC = 0.6344, specificity = 31.67%, sensitivity = 95.93%). These results suggest that individual taste tests are not highly effective for distinguishing between different forms of Parkinsonism. However, the TTS might be a more reliable marker, capable of differentiating iPD, PSP, and MSA patients from HCs with AUC values of 0.7448, 0.7014, and 0.7066, respectively. Moreover, the TTS differentiated iPD patients from PSP (AUC = 0.5827, specificity = 66.67%, sensitivity = 47.01%) or MSA patients (AUC = 0.5823, specificity = 65.00%, sensitivity = 47.01%) (Supplementary Table 3, Supplementary Fig. 4).
Comments (0)