
Remember me


Male C57BL/6J mice (20 ± 2 g) were obtained from Chengdu Dossy Experimental Animals Co., Ltd. (License No. SCXK (Chuan) 2020-0030). The mice were housed in a controlled environment with unrestricted access to food and water under 12 h/12 h light/dark cycle at 24 ± 2 °C. The study protocol was approved by the Animal Ethics Committee of Chengdu University of Traditional Chinese Medicine (Approval No. 2018-24).
Study designThe research was conducted in two phases. In the first phase, the analgesic effect of EA on CFA-induced inflammatory pain model was assessed. Mice were randomly assigned to four groups: Control, CFA, CFA + sham EA, and CFA + EA. In the second phase, to investigate the role of P2RY14 in EA-mediated analgesia, mice were divided into five groups: Control + vehicle (0.05% DMSO), CFA + vehicle (0.05% DMSO), CFA + vehicle (0.05% DMSO) + EA, CFA + PPTN (phenylpropylthio-uridine-5’-monophosphate) + EA, and CFA + UDPG (uridine 5’-diphosphate glucose) + EA. The study schedule was showed in Figs. 1A and 2A.
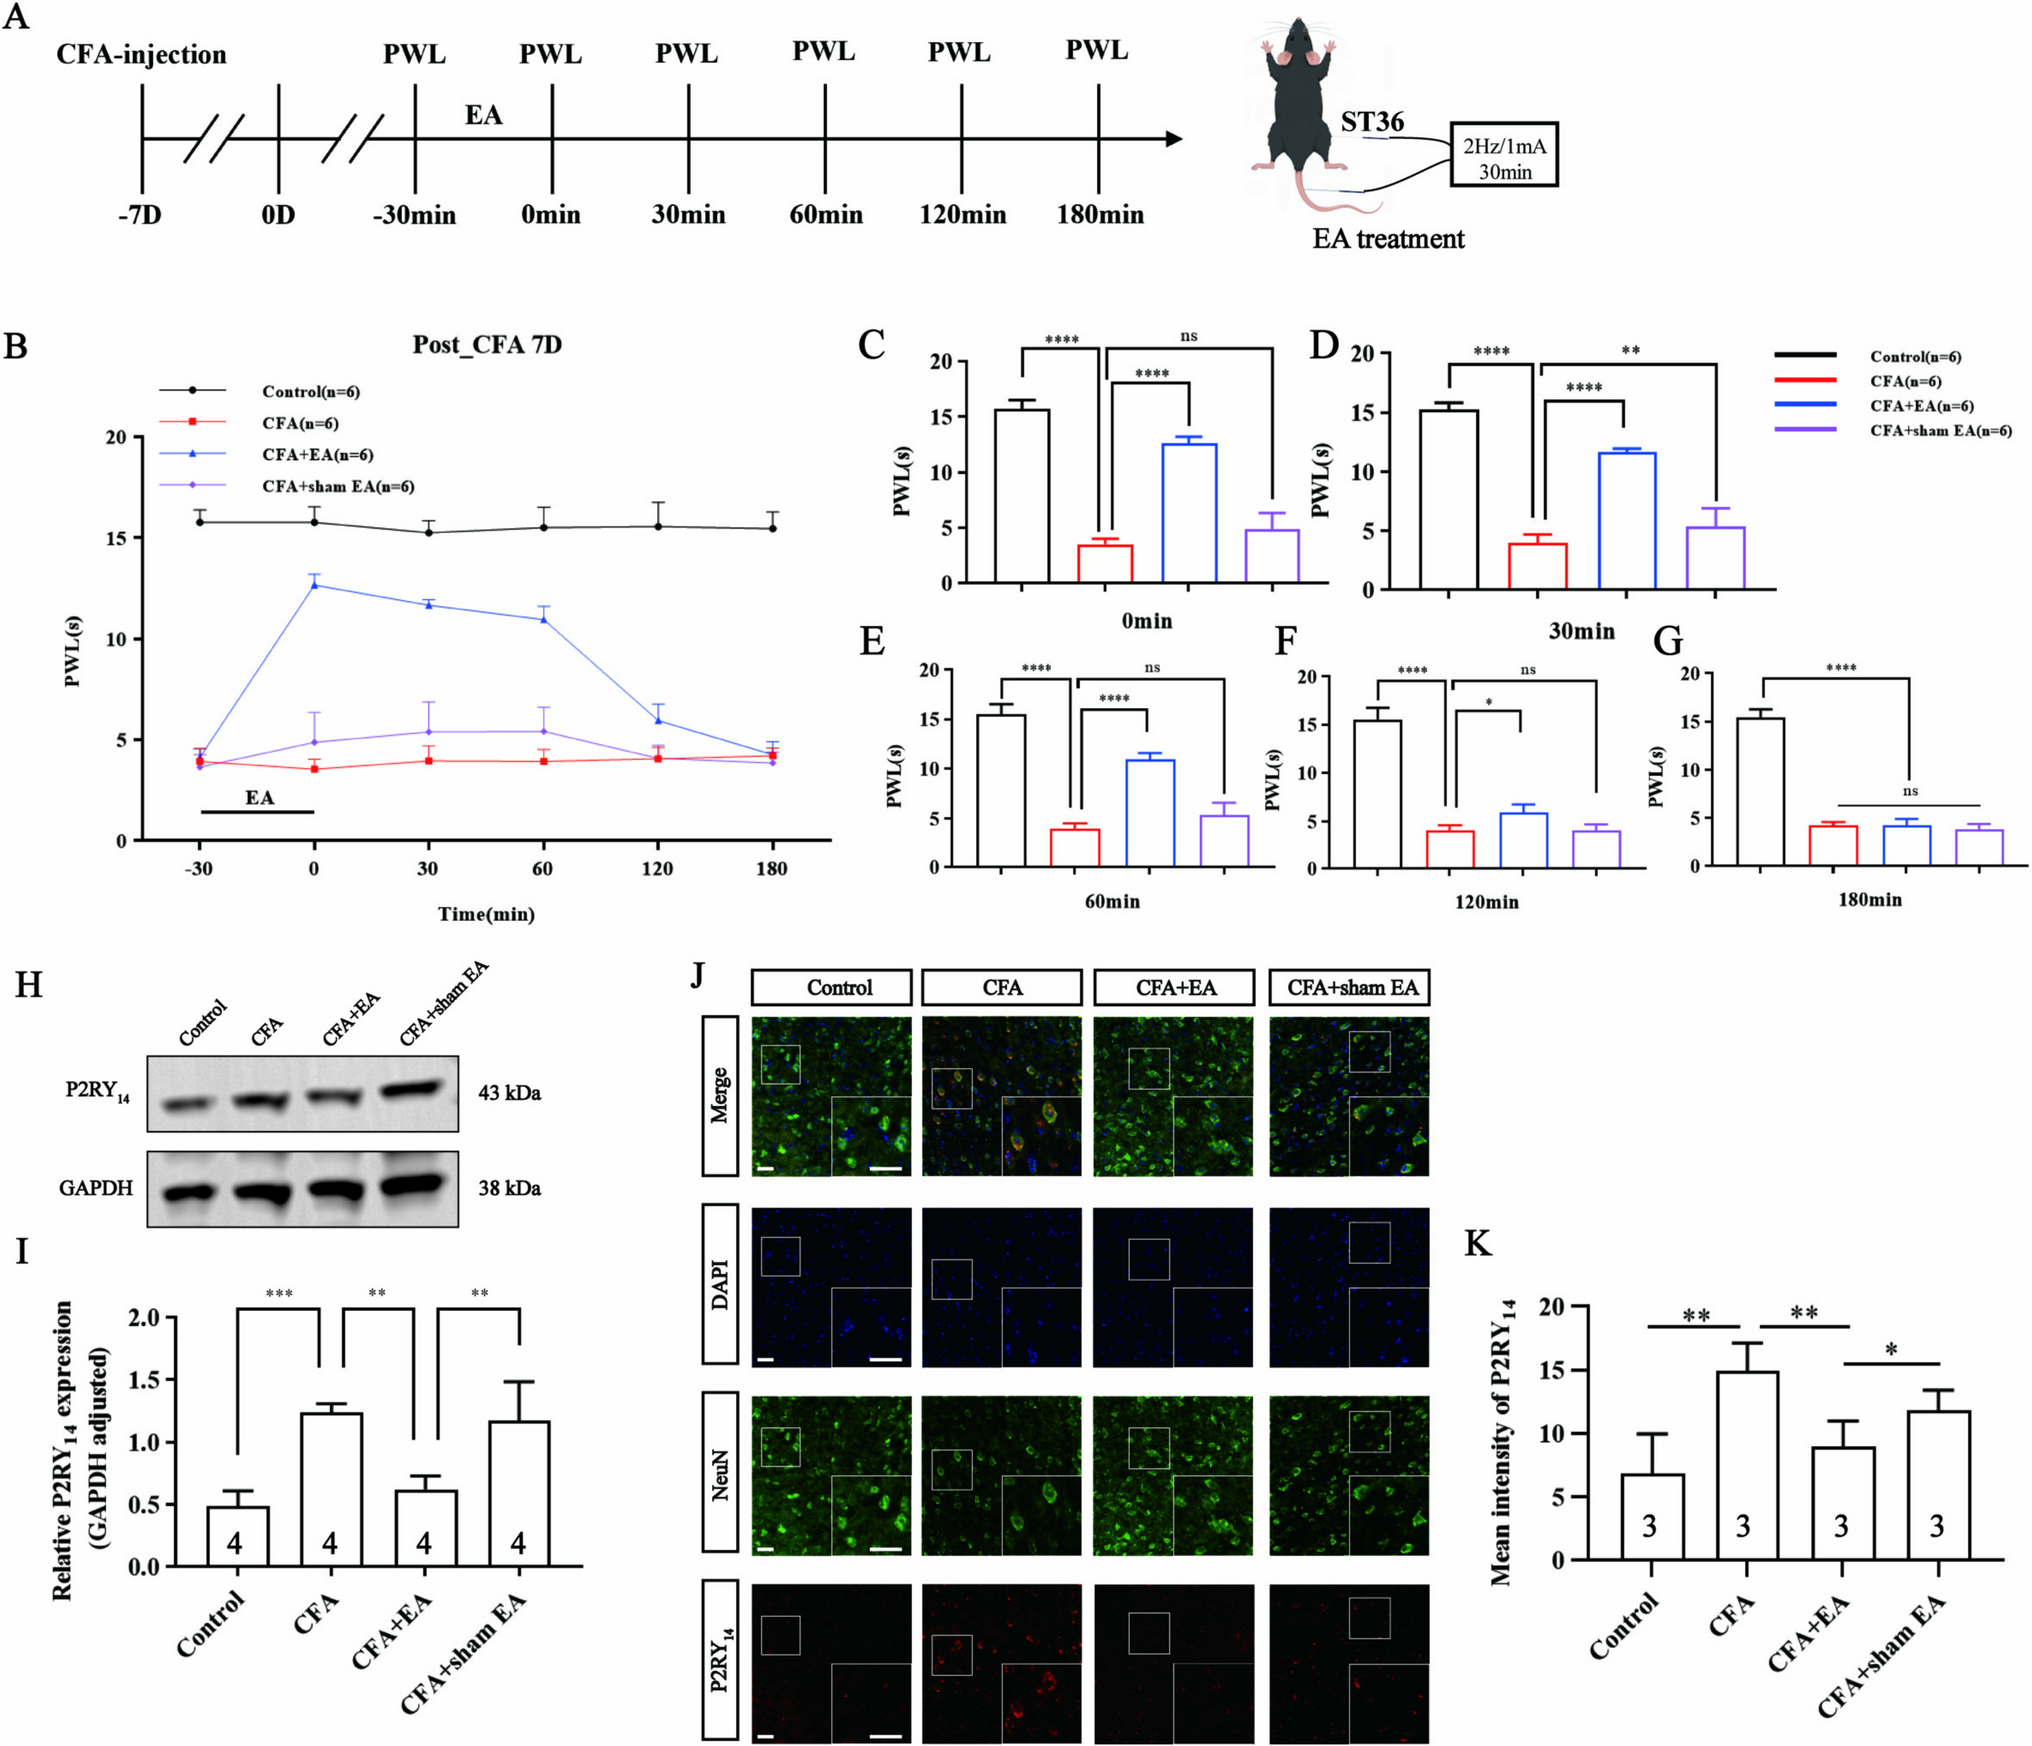
Fig. 1
EA relieved CFA-induced nociceptive hypersensitivity and downregulated the P2RY14expression in S1HL of CFA mice. (A) The study schedule. One week after CFA injection, the Hargreaves test was conducted to establish baseline paw withdrawal latency (PWL). The CFA + EA and CFA + sham EA groups then underwent 30 min of EA and sham EA treatments at ST36, respectively. PWL was measured at 0, 30, 60, 120, and 180 min post-treatment. (B-G) Time-dependent changes in PWL values following different interventions. (H and I) Quantitative protein analysis and comparison of P2RY14 expression in S1HL across groups. (J and K) Immunofluorescence co-localization of P2RY14 (red) with the neuronal marker NeuN (green) and comparison of mean fluorescence intensity of P2RY14 among groups. The short scale bars = 50 μm, and the long scale bars = 20 μm. The sample size is represented by the numbers in the bar graph. ns: not significant; *p ≤ 0.05; **p ≤ 0.01; ***p ≤ 0.001; ****p ≤ 0.0001
Fig. 2
P2RY14in S1HL were downregulated by EA in CFA mice.(A) The study schedule. After a one-week adaptation, catheters were surgically implanted into the bilateral S1HL of each mouse (as shown in the immunofluorescence image) for subsequent drug administration. One week after catheterization, an inflammatory pain model was established by injecting CFA into the right hind paw. A week later, drugs were bilaterally administered through the implanted catheters, and paw withdrawal latency (PWL) was measured 30 min before EA treatment. EA treatment was then performed for 30 min, with PWL measured at the following time points: 0, 30, 60, 120, 180, 240, and 300 min post-treatment. (B-I) Time-dependent changes in PWL following microinjection of DMSO, PPTN, or UDPG into bilateral S1HL, combined with EA treatment at ST36. (J and K) Quantitative protein analysis and comparison of P2RY14 expression in S1HL across group. (L and M) Immunofluorescence co-localization of P2RY14 (red) with the neuronal marker NeuN (green) and comparison of mean fluorescence intensity of P2RY14 among groups. The short scale bars = 50 μm, and the long scale bars = 20 μm. The sample size is represented by the numbers in the bar graph. ns: not significant; *p ≤ 0.05; **p ≤ 0.01; ***p ≤ 0.001; ****p ≤ 0.0001
Inflammatory pain modelThe inflammatory pain model was induced by an intracutaneous injection of 20 µl CFA (Sigma, USA) into the right hind paw. The Control group mice were injected with an equal volume of PBS into the right hind paw. One week later, the thermal pain threshold was measured using the Hargreaves test.
Cannula implantationMice were anesthetized with isoflurane at 0.4 L/min and secured in a stereotaxic frame. A small incision exposed the skull, allowing precise implantation of a 26-gauge guide cannula (0.48 × 0.34 mm) into the S1HL region (AP: -1.06 mm, ML: ±1.5 mm, DV: -0.6 mm). The cannulas were fixed to the skull with dental cement. After surgery, mice received an intraperitoneal injection of ceftriaxone sodium (50 mg/kg) to prevent infection and ensure hydration, followed by a one-week recovery period.
MicroinjectionTen minutes before EA treatment, 1µL PPTN (P2RY14 antagonist) or 1µL UDPG (P2RY14 agonist) were microinjected into S1HL via the implanted cannula with a micro-infusion pump (RMD Life Science, China). PPTN and UDPG (both from Tocris Bioscience, Bristol, UK) were prepared at 10 µmol [9] and 100 µmol [10] in 0.05% dimethyl sulfoxide (DMSO) and infused at 100 nL/min. Mice in the Control + vehicle and CFA + vehicle groups received equivalent volumes of 0.05% DMSO.
Electroacupuncture treatmentEA treatment followed the antagonist or agonist microinjection. The “Zusanli” acupoint (ST36) on the right hindlimb was selected for EA treatment. One acupuncture needle (0.16 × 7 mm, Hwato, China) was inserted 5 mm deep into ST36 as the active electrode and another needle inserted 5 mm deep into the tail as the auxiliary electrode [11] (Fig. 1A). These needles were then connected to a HANS acupoint nerve stimulator (HANS-200 A, China), which was set at 2 Hz frequency, 1 mA intensity, and 30 min duration. For the sham EA group, needles were superficially inserted with 1 mm depth, and were connected to the HANS stimulator without electrical power supply. During the EA session, all mice were restrained and kept awake.
Hargreaves testThermal pain thresholds were measured using a Hargreaves apparatus (PL-200, TaiMeng, China). Each mouse was allowed a 30 min adaptation period on a transparent glass plate before the test. A beam of radiant heat was directed at the right hind paw (the CFA-injected side), and paw withdrawal latency (PWL) was recorded over three tests at 5-minute intervals. Each mouse was tested eight times at the following time points: −30 (baseline), 0, 30, 60, 120, 180, 240, and 300 min. A cut-off latency of 20 s was used to prevent tissue damage.
Western blottingTwo hours after EA treatment, mice were anesthetized and transcardially perfused with PBS, and S1HL tissues were collected. The tissues were homogenized, centrifuged, and protein concentration was measured using the Pierce BCA Protein Assay Kit (Thermo Scientific, USA). Proteins were separated by electrophoresis and transferred to polyvinylidene fluoride membranes (Thermo Fisher Scientific, USA). After blocking with 5% nonfat dried milk for 1 h at room temperature, the membranes were incubated overnight at 4 °C with rabbit anti-P2RY14 (1:1000, Cat #E-AB-63013, Elabscience, China). They were then incubated for 1 h at room temperature with horseradish peroxidase (HRP)-conjugated secondary antibody (1:5000, Cat #56j9958, Affinity Biosciences, USA). GAPDH (1:10000, Cat #60004-1-Ig, Proteintech, China) was used as an internal standard for protein loading normalization. Immunoreactive signals were detected with an enhanced chemiluminescence kit (Cat #P10300, NCM Biotech, China) and recorded by autoradiography. Band intensity was quantified using Image J software.
ImmunofluorescenceThe immunofluorescence technique was utilized to explore the expression of P2RY14 on neurons and astrocytes. Mice were anesthetized with 1% pentobarbital sodium and perfused with 0.9% saline containing 4% paraformaldehyde at 2 h after EA treatment. Next, the brain was removed and preserved in a 4% paraformaldehyde at 4 °C for 6 h. After dehydration in a 30% sucrose solution at 4 °C overnight, a series of 20-µm coronal slices across the S1HL were cut on a cryostat (Leica, CM1950, Germany). After washes three times with PBS for 10 min each, the slices blocked with 0.3%Triton X-100 in PBS containing 2%GSA for 2 h at 37 °C in PBS. Next, the slices were incubated with primary antibodies at 4 °C overnight. The following reagents were used: mouse anti-NeuN (1:400, Cat # ab104224, Abcam, USA), mouse anti-GFAP (1:200, Cat #3670T, Cell Signaling Technology, USA), rabbit anti-P2RY14 (1:200, Cat #ARP-018, Alomone Labs, Israel), coraLite488-conjugated goat anti-mouse IgG(H + L) (1:400, Cat #a SA00013-1, proteintech, USA), coraLite594-conjugated goat anti-rabbit IgG(H + L) (1:400, Cat #a SA00013-4, proteintech, USA), DAPI (Cat #C0065, Solarbio, China). Fluorescence images were captured using laser scanning confocal microscope (FV3000, Olympus Japan) and analyzed with Image J software (NIH, USA).
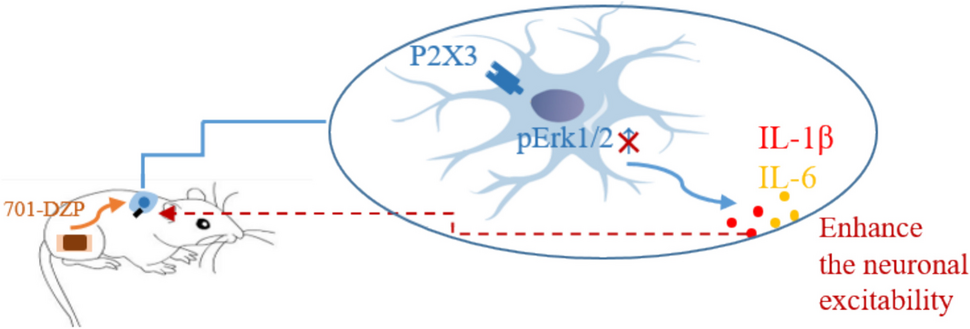
Enzyme-linked immunosorbent assay (ELISA)The contents of Interleukin-1β (IL-1β) and Tumor Necrosis Factor-α (TNF-α) in mouse brain tissues were tested using Mouse IL-1β ELISA kits (#CB10173-Mu) and Mouse TNF-α ELISA kits (#CB10851-Mu), which were obtained from Coibo Bio Technology Co., Ltd. (Shanghai, China). The procedures were followed to the kit instructions.
Statistical analysisAll the data are presented as Mean ± SEM. Statistical significance was analyzed by unpaired, two-tailed, Student’s t test, and one‐way analysis of variance (ANOVA) followed by Bonferroni’s post‐ test, using GraphPad Prism 9.0 (GraphPad Software). Significant differences were accepted at p ≤ 0.05.
Comments (0)