4.1 Materials and reagents
The components and reagents used in this study were sourced from the following companies: RPMI 1640 culture medium (Roswell Park Memorial Institute, Gbico, USA), Penicillin-Streptomycin solution (100 ×) (Hangzhou Jino Company), 10 × PBS (Biyuntian Company), DMSO and Polybrene (Sigma), fetal bovine serum (FBS) (Hyclone, USA), 0.25% trypsin-EDTA, Lipofectamine 3000, and puromycin (Gibco), and D-luciferin substrate (Promega).
4.2 Cell culture
Human pancreatic carcinoma cell lines, PATU8988T and AsPc-1, were obtained from the American Type Culture Collection (Manassas, VA, USA). These cells were cultured at 37 °C in a humidified incubator with 5% CO2, using RPMI 1640 medium supplemented with 10% FBS. Short tandem repeat analysis was performed to verify the identities of the cell lines, all of which were confirmed to be free of mycoplasma contamination.
4.3 Tumor repopulation cell model
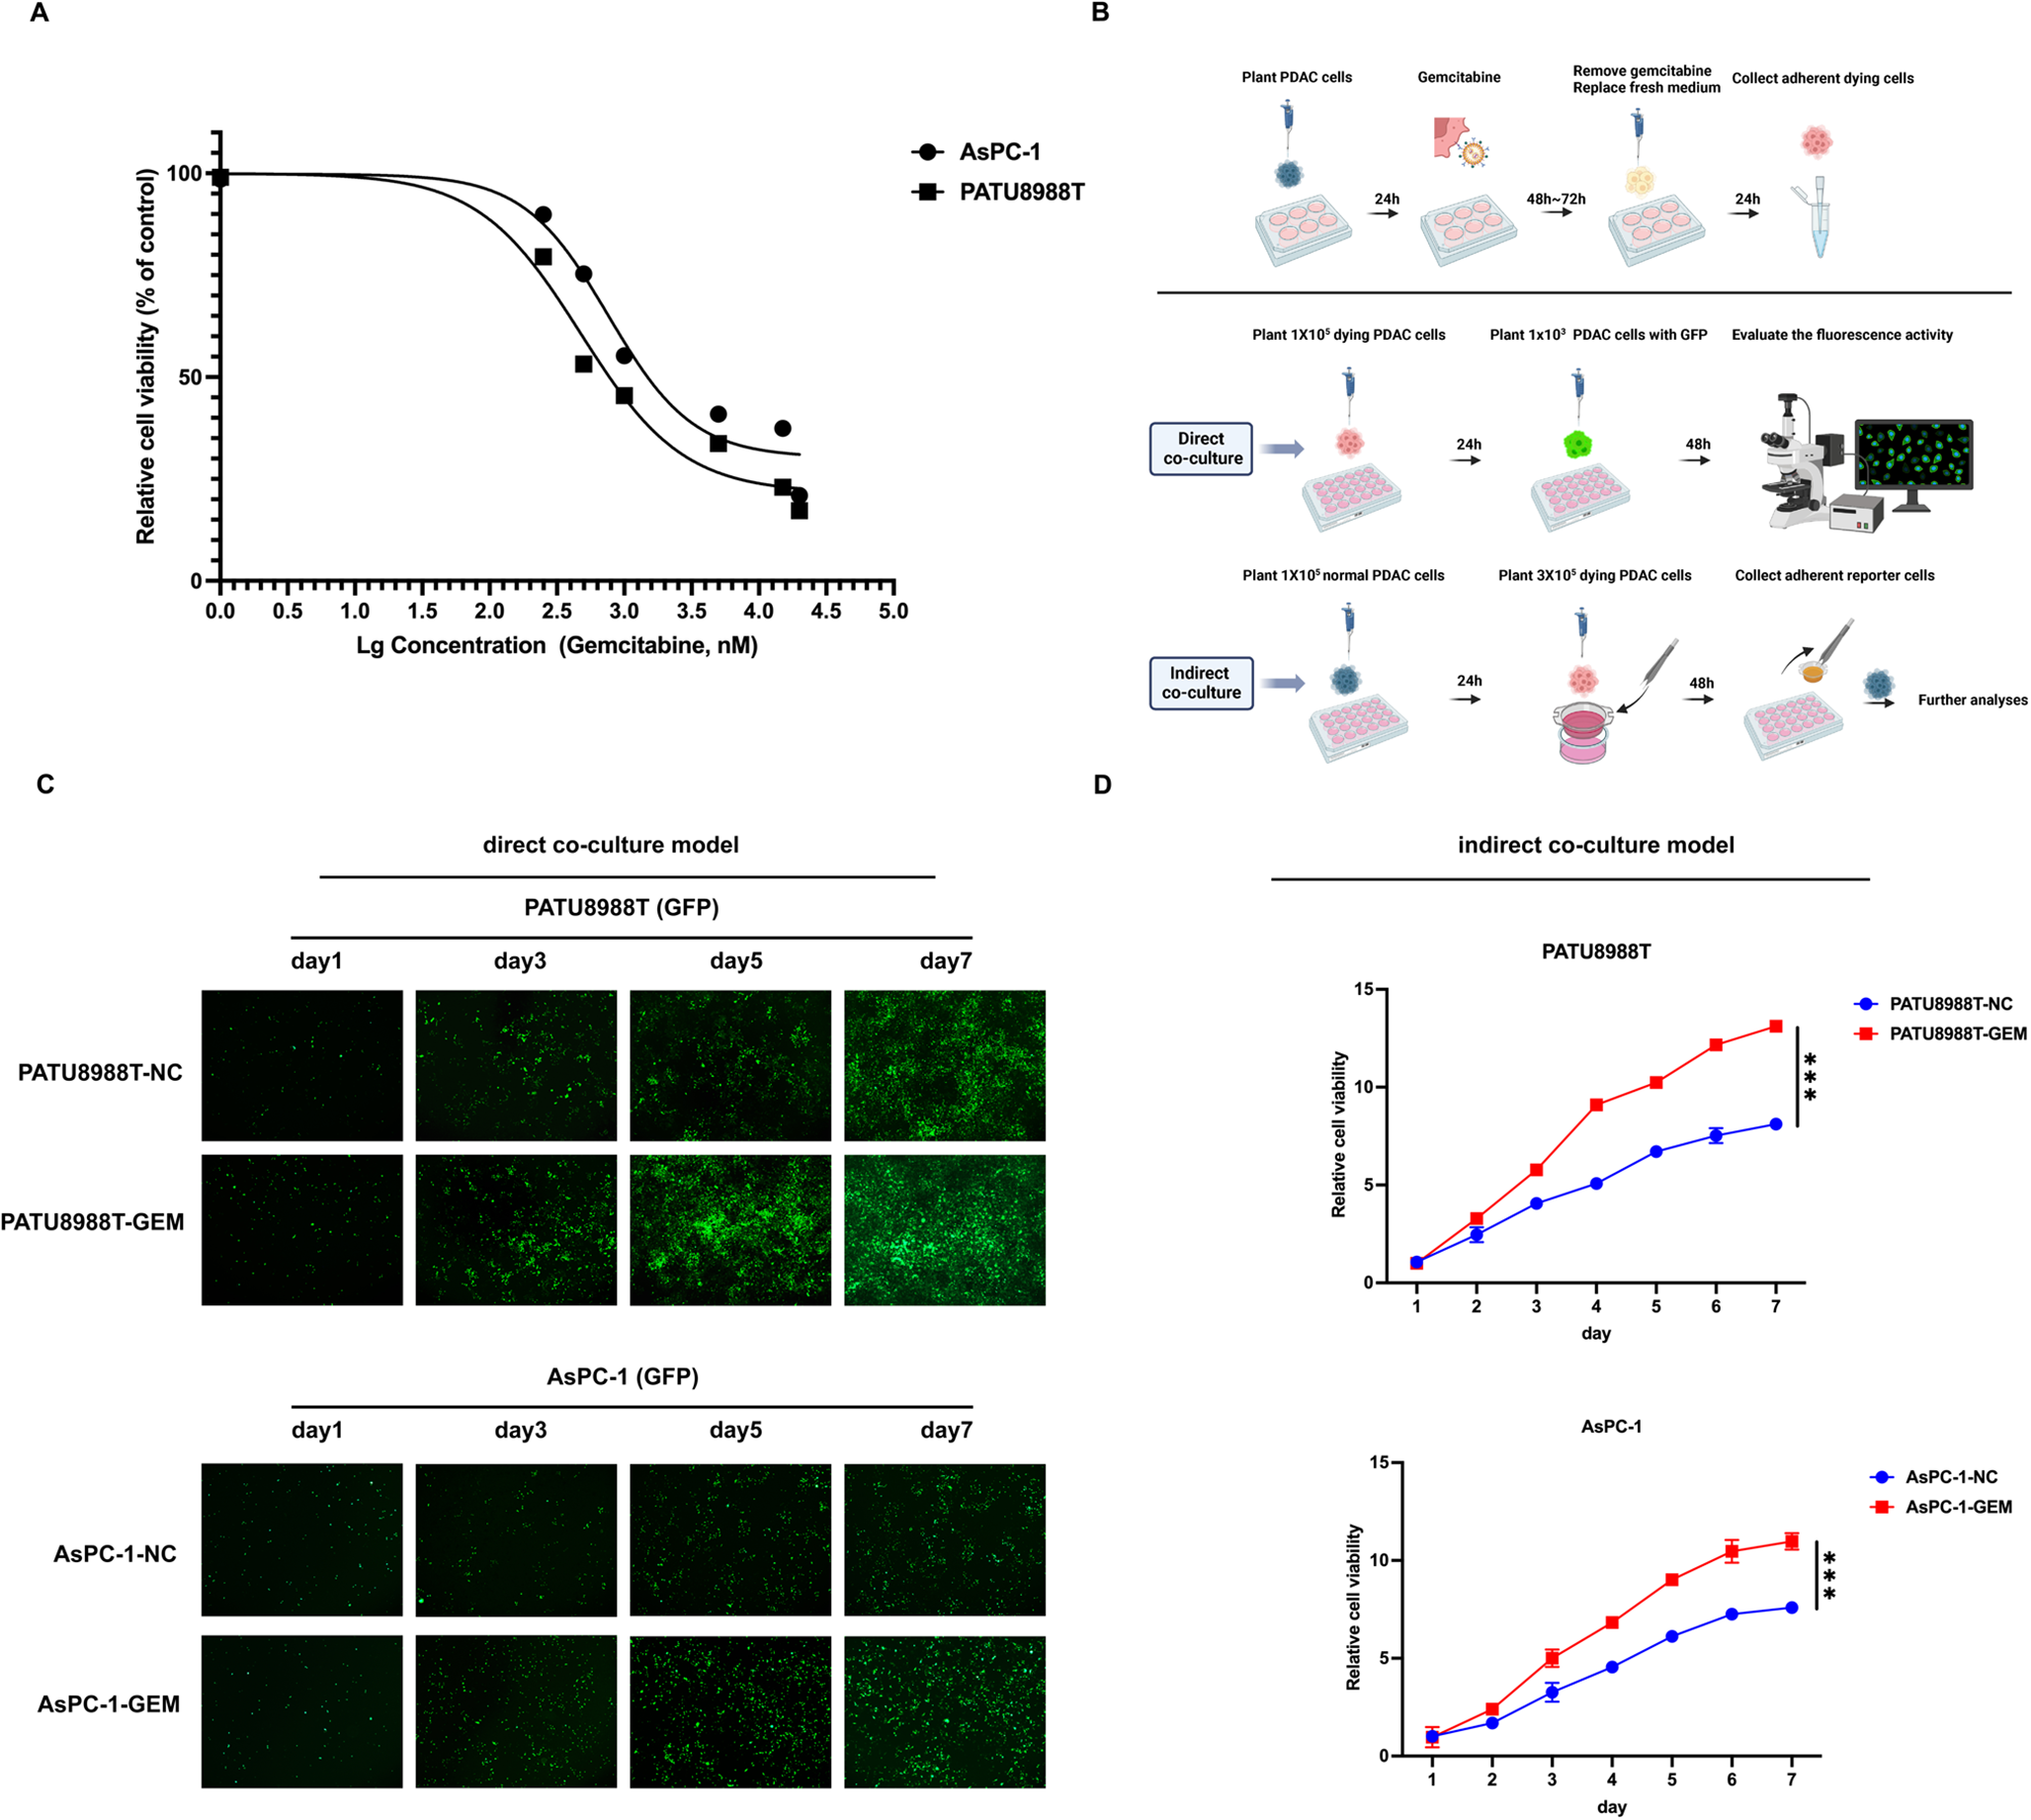
Pancreatic cancer cells were treated with 1 ~ 5 µM gemcitabine (Cat# HY-17026, MedChem Express, NJ, USA) for 48 to 72 h, washed twice with 1 × PBS, and the supernatant was discarded. The medium was then replaced with 2% serum, and the cells were incubated for an additional 24 h. The adherent dying cells were collected and referred to as the experimental group (gemcitabine treatment). The term “dying cell” broadly refers to cells undergoing programmed cell death, which can be characterized by morphological changes, DNA fragmentation, activation of caspase family proteases, and decreased metabolic activity [44]. Classical morphological features indicative of impending cell death, such as cell contraction, detachment from neighboring cells, and altered membrane integrity, can be observed under the microscope. The control group consisted of dying cells treated with DMSO for 48 to 72 h, with subsequent treatment procedures identical to those of the experimental group.
In the direct co-culture model, 1 × 10⁵ dying cells were evenly seeded in 24-well plates. After attachment, 1000 GFP-labeled pancreatic cancer cells (reporter cells) were uniformly seeded on top. The medium containing 2% serum was replaced every 48 h. Images were captured every 48 h using a fluorescence microscope to monitor the proliferation activity of the reporter cells.
In the indirect co-culture model, 1 × 10⁵ normal pancreatic cancer cells were uniformly seeded in 24-well plates. Once the cells adhered, transwell inserts (Cat# 725122, NEST, Wuxi, China) containing 3 × 10⁵ dying cells with a 0.4 μm pore size were placed in each well, ensuring that the lower part of the transwell inserts was submerged in medium containing 2% serum. After 48 h, the adherent pancreatic cells (reporter cells) in the lower chamber were collected, and their proliferation activity was assessed using a CCK-8 assay (Cat# C0037, Beyotime, Shanghai, China).
4.4 Identification of differential lipids using mass spectrometry analysis
Lipidomic profiling of supernatants from pancreatic cancer cells was performed using liquid chromatography-tandem mass spectrometry (LC-MS/MS) in both positive and negative ion modes to detect a range of lipid molecules. The analysis was conducted in the following steps: (1) The samples underwent lipid extraction using the Bligh and Dyer method, ensuring integrity of lipid components. The extracted lipids were dried and dissolved in a dichloromethane/methanol mixture for subsequent analysis. Reverse-phase liquid chromatography was used for chromatographic separation, with an optimized gradient elution program to achieve effective categorization of lipid classes. (2) Full scan and data-dependent acquisition modes were utilized to obtain detailed lipid molecular and fragment information. The analysis system comprised ultra-performance liquid chromatography (UPLC, ExionLC™ AD and tandem mass spectrometry (MS/MS, QTRAP® 6500+ (https://sciex.com.cn/). Raw mass spectrometry data were preprocessed using mass spectrometry-data independent analysis software, including peak extraction, alignment, and noise reduction. (3) Quantification results were normalized using methods such as total ion intensity normalization and principal component analysis. Lipid molecules were subsequently identified and annotated based on the human metabolome database (https://hmdb.ca/). All detection and analyses were provided by Wuhan Metware Biotechnology Co., Ltd.
4.5 Flow cytometry for apoptosis detection
Pancreatic cancer cells (1 × 10⁵ cells/mL) were allowed to grow for 24 h in a 6-well plate containing RPMI 1640 medium supplemented with 10% FBS. Subsequently, the cells were treated with gemcitabine (1 µM). After 48 h, the cells were harvested and washed with cold PBS buffer. They were then resuspended in a binding buffer and stained in the dark with 5 µL of Annexin V-FITC and 5 µL of propidium iodide (Cat# C1383S, Beyotime, Shanghai, China) at 4 °C for 30 min. The stained cells were washed three times with binding buffer to remove excess dye and then resuspended in 500 µL of binding buffer. Untreated cells served as negative controls. The percentage of apoptotic cells was analyzed within 1 h using flow cytometry (BD, FACSCalibur, USA).
4.6 CCK-8 assay for the detection of proliferation
Cell viability was assessed using the CCK-8 following the manufacturer’s instructions. Cells were seeded in a 96-well microplate at a density of 3 × 10³ cells per well in 100 µL of culture medium. Every 24 h, 10 µL of CCK-8 reagent was added to each well, followed by a 1-hour incubation. The absorbance was measured at 450 nm using a microplate reader (Bio-Rad, Hercules, CA, USA).
4.7 Transwell migration assay
Complete medium (1 mL) was added to the lower chamber of the transwell invasion system. Subsequently, pancreatic cancer cells were resuspended in serum-free medium and seeded into the upper chamber at a density of 5 × 10⁴ cells per well. After 24 h of incubation, we quantitatively assessed the number of cancer cells that traversed the membrane using ImageJ software. The images were converted to grayscale, and threshold adjustments were made to separate the cells from the background. The analyze particle function was used to calculate the number of migrated cells. We repeated the experiments multiple times to reduce variability and calculated the average.
4.8 Colony formation assay
Reporter cells were resuspended in RPMI 1640 medium containing 10% FBS and incubated at 37 °C in a 5% CO2 environment for 7 to 14 days. A total of 3000 cells were seeded per well to facilitate colony formation. After incubation, the plates were washed with cold PBS, and the colonies were fixed with 4% paraformaldehyde (Cat# P0099-3 L, Beyotime, Shanghai, China) at room temperature. The fixed colonies were then stained with 1% crystal violet for 30 min at room temperature. Colonies containing more than 100 cells were counted using ImageJ software.
4.9 Lentivirus transduction
1 × 10⁶ pancreatic cancer cells were inoculated in the six-well plate, and the medium was discarded after 24 h when the cell fusion reached about 80%. Next, 1 mL of viral culture medium was mixed with 1 mL of fresh culture medium containing Polybrene (final concentration 1:1000) and added to the cells for continued cultivation. After 24 h of infection, GFP expression in the tumor cells was assessed under a fluorescence microscope. Cells exhibiting uniform GFP brightness were collected and transferred to 10 cm culture dishes for continued cultivation.
To generate stable cells expressing the exogenous gene GFP-Luc, puromycin (1 µg/mL) was added 24 h post-infection for selection. The culture medium was replaced every 3 days, with fresh puromycin added for selection over 2 weeks. This process yielded double-labeled cells, namely AsPC-1/GFP-Luc and PATU8988T/GFP-Luc. The expression of GFP in the cells was accessed and photographed under a fluorescence microscope. The labeled cells were expanded, and corresponding cell lines were stored for future use.
4.10 Western blot
Pancreatic cells were collected by centrifugation and washed twice with cold PBS. The cell pellets were suspended in 100 µL of cold RIPA lysis buffer and incubated on ice for 30 min, with vortexing every 10 min. Cytoplasmic and nuclear protein was separated and extracted using the NE-PER™ nuclear and cytoplasmic extract reagent kit (Cat# 78833, Thermo Fisher, MA, USA). The samples were then centrifuged at 15,000 g for 30 min. Immunoblot analysis was performed using 10 µg of sample proteins on a 12% SDS-PAGE gel. Electrophoresis was conducted at 120 V for 60 min to separate the proteins, followed by transfer to a PVDF membrane in cold transfer buffer using a wet transfer system at 300 mA for 90 min.
The PVDF membrane was blocked for 1 h and then incubated with primary antibodies (diluted 1:1000) overnight at 4 °C. After washing, the membrane was incubated with secondary antibodies (diluted 1:4000) at room temperature for 1.5 h. Protein bands were visualized using an ECL protein blot detection system (Tanon 4200), and band intensities were analyzed using Quantity One software. The antibodies against YAP1 (Cat# 4912 S) and pYAP1 (Ser 397, Cat# 13619T) were obtained from Cell Signaling Technology, Inc. (Boston, USA). The antibody against ATX (Cat# abs116120) was purchased from Absin Bioscience Inc. (Shanghai, China). The antibodies against Lamin B (Cat# ab16048), γH2A.X (Ser 139, Cat# ab26350) and GAPDH (Cat# ab263962) were sourced from Abcam, Inc. (Cambridge, USA). Secondary antibodies against rabbit (Cat# BA1060) or mouse (Cat# BM2002) were purchased from Boster Biotechnology (Wuhan, China).
4.11 Real-time quantitative reverse transcription polymerase chain reaction
According to the manufacturer’s instructions, cDNA was generated using the RevertAid First Strand cDNA Synthesis Kit (Thermo Scientific). Reverse transcription quantitative polymerase chain reaction (RT-qPCR) was performed using PowerUp SYBR Green Master Mix (Thermo Fisher). β-actin was used as the internal control. The primer sequences are listed in Table s2.
4.12 ELISA
Following the manufacturer’s instructions, the levels of LPA in the conditioned medium were assessed using an ELISA kit from Bioo Scientific, Inc. (Cat# EH11121M). Additionally, the concentrations of IL6 and IL8 in the conditioned medium were determined using ELISA kits obtained from eBioscience Inc. (Cat# EH2IL6) and BioLegend Inc. (Cat# 431504), respectively.
4.13 Single-cell sequencing analysis and RNA-sequencing analysis
The pancreatic cancer scRNA-seq data, GSE212966 [45], was downloaded from the Gene Expression Omnibus database (GEO, https://www.ncbi.nlm.nih.gov/geo/). A total of 44 Hippo pathway-related genes were curated from the MSigDB database (https://www.gsea-msigdb.org/gsea/msigdb/human/search.jsp). The detailed processing of the scRNA-seq data was conducted as follows: (1) The scRNA-seq data was preprocessed using the “Seurat” package. The “PercentageFeatureSet” function was employed to determine the proportion of mitochondrial genes, followed by correlation analysis to investigate the relationship between sequencing depth and the proportion of mitochondrial genes or total intracellular sequences. (2) Each gene was required to be expressed in at least 3 cells. (3) Cells were included if they expressed between 300 and 5000 genes, had mitochondrial content below 20%, and the unique molecular identifier (UMI) count exceeding 1000. (4) After filtering, the dataset was normalized using the “LogNormalize” method to ensure consistency in gene expression values.
We analyzed a total of 38,981 cells from six scRNA-seq samples, of which 34,208 cells were retained after quality control (Table s3). As shown in Fig. S2A and B, there is a strong correlation between UMI count and mRNA (r = 0.85). However, no significant correlation was observed between mRNA counts and mitochondrial or ribosomal gene content. The top 2000 highly variable genes were identified for subsequent dimensionality reduction analysis (Fig. S2C). We used the principal component analysis (PCA) to estimate available dimensions and depicted the raw distribution of different samples. The result showed no substantial differences among all cells (Fig. S2D and E). The top 30 most unique principal components were selected for further investigation (Fig. S1F). After removing batch effects, we visualized the combined distribution of the CO (adjacent tissues) and PC (pancreatic cancer) samples (Fig. S2G and H). The gene expression patterns of the top 15 principal components were further examined (Fig. S1I). Guided by the clustering tree, we set the resolution parameter to 1, resulting in the identification of 34 distinct clusters. (Fig. S1J).
The RNA-sequencing expression data and clinical features of PDAC were downloaded from the Cancer Genome Atlas database (TCGA, https://portal.gdc.cancer.gov/). The RNA-sequencing expression profiles in the GSE57495 dataset were also retrieved from the GEO database [46]. The detailed processing of the microarray data was as follows: (1) Gene symbols were obtained by converting probe IDs. (2) Probes that corresponded to multiple genes were removed. (3) When multiple probes corresponded to a single gene, the average value of these probes was considered as the gene expression level.
4.14 Statistical analysis
Statistical analysis was conducted using R (version 4.2.3) and GraphPad Prism 7 (CA, USA). The wilcoxon test was used to compare differences in Hippo signaling activity among various cell types at the single-cell level. Pearson correlation analysis was employed to assess the linear relationships between different genes. Kaplan-Meier analysis and log-rank test were performed to evaluate survival differences between distinct subgroups. Student’s t-test and analysis of variance (ANOVA) were employed to compare quantitative data between groups. All experiments were performed using representative data in triplicate and independently repeated at least three times. Results are presented as the mean ± standard deviation from three or more experimental replicates. P < 0.05 was considered statistically significant.


Comments (0)