
Remember me


This study included 245 pediatric patients aged < 18 years, all diagnosed with ALL and subjected to cardiac MRI examination and standard chemotherapy between January 2018 and December 2021. The exclusion criteria were as follows: (1) patients with cardiac MRI deemed inadequate in quality and unsuitable for analysis; (2) patients with congenital heart diseases; (3) patients who had exhibited cardiac abnormalities on any imaging examination before the confirmed diagnosis of leukemia. Basic patient information, such as age, sex, body mass index (BMI), and other relevant details, was documented. Clinical data for all patients, including risk stratification, clinical types, and disease subtypes, were also recorded. The risk stratification of ALL is classified into low-risk, intermediate-risk, and high-risk groups. Various chemotherapy protocols were administered based on different risk stratifications, according to the Chinese Children’s Cancer Group’s ALL-2015 [11]. (1) Clinical types were categorized as L1, L2, or other subtypes based on the French-American-British classification of ALL [12]. (2) Disease subtypes included early pre-B, pre-B, and B-cell categories, based on differentiation antigens expressed at various stages of B-cell differentiation.
This study recruited 85 healthy children who voluntarily participated in the control group through recruitment posters in the hospital. These children were matched with the study group in terms of sex and age. The exclusion criteria for the control group were as follows: (1) patients with cardiac MRI images that were considered inadequate in quality and unsuitable for analysis; (2) patients with congenital heart diseases, pericardial disease, cardiomyopathy, diabetes, hypertension, or other cardiovascular diseases; (3) patients with a family history of cardiomyopathy; (4) patients with magnetic resonance contraindications, hyperthermia, or claustrophobia. The study was approved by the institutional review board and the clinical trial registration was completed (registration number, ChiCTR1800017054). Both study and control groups were informed of the precautions and research contents before the examination, and the informed consent was obtained from the legal guardians.
Clinical follow-upAll patients who underwent cardiac MRI imaging were followed up either in the outpatient clinic or via telephone call for at least 1 year after the MRI examination, with follow-up conducted annually thereafter. The follow-up aimed to ascertain the occurrence of adverse clinical outcomes and adverse cardiac events as well as the timing of these events. Adverse clinical outcomes were defined as events requiring ICU treatment and those resulting in death. Adverse cardiac events included new malignant arrhythmias (persistent ventricular arrhythmias, high atrioventricular block, accelerated Fugata rhythm), heart failure, or cardiogenic shock. The follow-up time was determined as the duration from the MRI examination to the incidence of adverse clinical outcomes or cardiac events. For patients who did not experience any adverse clinical or cardiac events, the follow-up time was determined as the interval from the date of cardiac MRI to that of the last follow-up.
Magnetic resonance imagingFor imaging purposes, a 1.5-T magnetic resonance scanner (Achieva, Philips Healthcare, Amsterdam, Netherlands) with a 16-channel body coil was used. All participating children underwent imaging with the assistance of a breath-electrocardiogated trigger. For cooperative patients, a breath-holding mode was utilized for image acquisition, while for those unable to cooperate, the sleep deprivation method (staying awake later than usual on the night before the exam) was employed. Navigation technology was applied to enhance image quality when necessary. The specific scanning conditions and parameters were as follows.
For cardiac cine imaging, the true fast imaging with steady-state precession sequence was used, following the standard scanning protocol recommended by the Society for Cardiovascular Magnetic Resonance [13]. The scanning scope encompassed the entire left ventricle, capturing a continuous series of six to ten short-axis images. Subsequently, two-, four-, and three-chamber cardiac images were sequentially obtained. The scanning parameters were as follows: TR 43.94 ms, TE 1.48 ms, flip angle 50°, slice thickness 6–8 mm; FOV 213 × 213 to 40 × 400, matrix 133 × 133 to 250 × 250, with 25 frames per cardiac cycle.
Image analysisCardiac MRI image post-processing was performed using professional software (CVI42, Circle Cardiovascular Imaging, Calgary, Canada). All image analyses were independently conducted by two experienced radiologists (R.X., a pediatric radiologist with 8 years of experience, and Y.K.G., a pediatric radiologist with 25 years of experience). Intra- and inter-observer reproducibility analyses were performed.
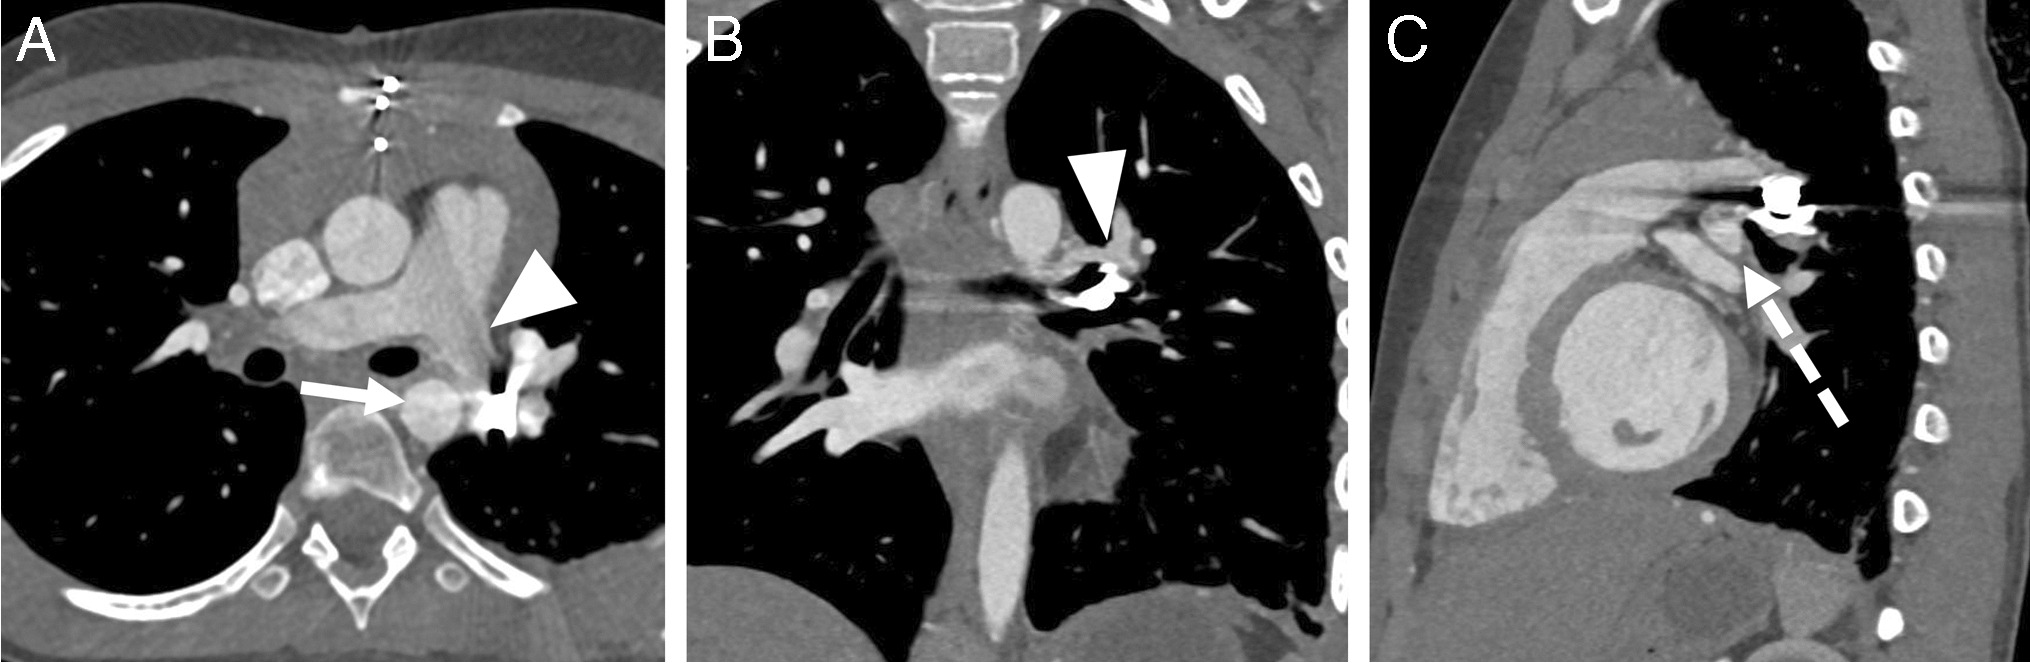
The parameters assessed for left ventricular structure included the following: end-diastolic length (ED-L), end-diastolic short diameter (ED-S), ventricular septum thickness, left ventricular larger diameter (Max ED) and smaller diameters (Min ED), LV longitudinal shortening (L-shorten), and 2-D sphericity index (2-D SI) [14]. ED-L was measured from the midpoint of the mitral valve to the apex of the left ventricle; ED-S was measured from the middle of the left ventricle perpendicular to the ventricular septum at the basal level. The ventricular septal thickness was assessed at the end of the diastole in the mid-segment of the left ventricle. Max ED and Min ED were measured on the short-axis cine at the end of diastole. L-shorten and 2-D SI were derived from the measured data using the formulas: L-shorten = (ED-L–Max ED)/ED-L; \(2-\text=\frac+\text)/2}}\) [15] (Fig. 1).
Fig. 1
Schematic representation of the structural measurements conducted using cardiac magnetic resonance imaging. a Four-chamber end-diastolic short diameter: from the middle of a left ventricle perpendicular to the ventricular septum at the basal level. b Four-chamber end-diastolic length (solid line): from the midpoint of a mitral valve to the apex of a left ventricle; ventricular septum thickness (broken line) assessed at the end of the diastole in the mid-segment of the left ventricle. c Left ventricular short-axis larger (solid line) and smaller diameters (broken line) were measured on the short-axis image (middle section) at the end of diastole
The parameters of the left ventricular function were left ventricular end-diastolic volume (LVEDV), left ventricular end-systolic volume (LVESV), left ventricular ejection fraction (LVEF), left ventricular stroke volume (LV SV), left ventricular cardiac output (LV CO), left ventricular mass (LV mass), and left ventricular remodeling index (LVRI). The software automatically identified the endocardial and epicardial contours of the left ventricle at the end of the diastolic and systolic phases, and the trabeculations and papillary muscles were not included as muscle. LVRI was calculated from the left ventricular end-diastolic volume and myocardial mass, using the formula: LVRI = LV mass/LV EDV [16]. The parameters of left ventricular strain included global radial strain, global circumferential strain, and global longitudinal strain of the left ventricular myocardium.
To account for growth-induced variations, cardiac MRI measurements were adjusted using body surface area, considering the broad range of ages and physical development among children.
Statistical analysisStatistical analyses were performed using SPSS (SPSS, version 23.0, Armonk, NY) and GraphPad (GraphPad version 10, San Diego, CA). For intergroup comparisons, an independent sample t-test was applied, and for correlation analysis, the Pearson test was used. Cox survival analysis was conducted to examine the prognostic effects of cardiac MRI parameters on clinical adverse events and cardiac events. Multivariate analysis was not performed owing to the limited number of negative outcomes. Kaplan–Meier (K–M) analysis was used to estimate the prognostic value of global longitudinal strain, using a cutoff value of 18%. A two-tailed P-value of < 0.05 was considered statistically significant.
Comments (0)