Data source and study design
In this retrospective cohort study, we used data from the China Health and Nutrition Survey (CHNS), which is an ongoing open cohort project launched in 1989 and conducted in 1991, 1993, 1997, 2000, 2004, 2006, 2009, 2011, and 2015 [19]. The survey utilized a multistage, random cluster approach to collect sample from 12 different provinces and autonomous cities, representing nearly half of the Chinese population [4]. It aims to gather demographic, socioeconomic, health, and nutrition information to reflect the transitions of various aspects of life among the general Chinese population [12]. Further details of the CHNS were described elsewhere [20]. The Carolina Population Center at the University of North Carolina at Chapel Hill and the National Institute for Nutrition and Health at the Chinese Center for Disease Control and Prevention approved the study [12]. A written informed consent was obtained from all participants [12].
Given that the latest hypertension data are available only until 2015, and the enhanced version of the China Food Composition Table (FCT) was initially employed in 2004 to obtain nutrient values [21], we used all five rounds of CHNS data between 2004 and 2015 (2004, 2006, 2009, 2011, and 2015). Since the latest available dietary data available was up to 2011, we included four rounds of CHNS data (2004, 2006, 2009, and 2011) in the trajectory analysis. A total of 8589 participants with at least three rounds of complete dietary data between 2004 and 2011 were included (Supplemental Fig. 1). We excluded 1057 participants aged under 18 years and 3297 who had hypertension during the trajectory period. Of the 4235 remaining participants, we further excluded pregnant women, those with diabetes, myocardial infarction, stroke, and extreme total energy intake (≥ 8000 and ≤ 800 kcal/day for men; ≥ 6000 and ≤ 600 kcal/day for women) [4]. Additionally, we excluded 1162 participants with missing data on marital status, income, energy intake, smoking, drinking, and body mass index (BMI) (Supplemental Fig. 1).
Dietary assessment and calculation of the PDIs
The CHNS utilizes a consecutive 3-day 24-hour diet recall method combined with household weighing method to collect dietary data and assess individual diet. The accuracy of the 24-hour dietary recall method has been validated by the literature [22]. A detailed description of dietary assessment has been provided elsewhere [23]. In short, at each survey round, each participant was asked by qualified interviewers to report the amounts and types of foods consumed on the day before the survey for three consecutive days, which were randomly allocated from Monday to Sunday [4]. We calculated the three-day average intake (g/day) of foods and nutrients for each participant in each survey round (2004, 2006, 2009, and 2011) using the FCT [21]. Since hypertension is believed to be associated with certain nutrient intakes [24,25,26,27], we calculated the intakes of sodium, potassium, magnesium, calcium, fiber, saturated fats, unsaturated fats, folic acid, vitamin B6, and vitamin B12 during the trajectory period. The methods of calculating PDI, hPDI, and uPDI have been documented previously [9]. Briefly, by referring to the food codes and descriptions in the FCT [21], as well as food group classification from prior research [12], we created 17 food groups according to their nutrient and culinary characteristics. These food groups were further classified into three larger categories: healthy plant foods (whole grains, fruits, vegetables, nuts, legumes, tea and coffee, vegetable oil), unhealthy plant foods (refined grains, potatoes, sugar-sweetened beverages, sweets and deserts, fermented foods), and animal foods (animal fat, dairy, eggs, fish, meat). The 17 food groups in our study aligned with previous research that considered the unique characteristics of Chinese plant-based diets [12]. Specifically, we modified Satija et al.’s original 18 food groups [9] by removing “miscellaneous animal-based foods” and “fruit juices” due to virtually no reported consumption, and adding “fermented food” to the list. Following the basic scoring methods described in previous studies [9,10,11,12], we divided each food group into quintiles of intakes and assigned integer scores ranging from 1 to 5. For PDI, all plant foods were scored positively, with the lowest quintile receiving a score of 1 and the highest quintile receiving a score of 5. Conversely, all animal foods received reverse scores, with the highest quintile receiving a score of 1 and the lowest quintile receiving a score of 5. Thus, a higher PDI score indicates a diet higher in plant foods and lower in animal foods. For hPDI, all healthy plant foods were scored positively, while all unhealthy plant foods and animal foods were scored reversely, meaning that a higher hPDI score indicates a diet higher in healthy plant foods and lower in unhealthy plant foods or animal foods. For uPDI, all unhealthy plant foods were scored positively, while all healthy plant foods and animal foods were scored reversely, so a higher uPDI score indicates a diet higher in unhealthy plant foods and lower in healthy plant or animal foods. The total score for each index was the sum of the scores across all 17 food groups, with potential values ranging from 17 to 85 [12].
Baseline covariates
In line with the literature [2], the following confounders were included in the analysis due to their established association with hypertension: age, sex, urban or rural residence, marital status (married and others), education level (primary school and below, middle school, high school, college degree and above), income, physical activity (PA), drinking, smoking, daily energy intake, and body weight status. The information on these sociodemographic factors and lifestyle factors was obtained from the questionnaires at baseline. Individual income was categorized into three levels: ≤ 16,000 Chinese yuan (CNY), > 16,000 and < 32,000 CNY, and ≥ 32,000 CNY based on annual income [28]. The total metabolic equivalents of tasks (METs) of PA were calculated according to the reported hours per week of activity across four domains: occupational, transportation, leisure, and domestic [29]. Smoking status was classified into three categories: former smoker, current smoker, and non-smoker. Drinking status was divided into two categories: participants who drank beer/liquor in the year before and those who did not. Anthropometric parameters, such as participants’ height and weight, were measured using standard procedures without wearing shoes or heavy clothing [4]. Body Mass Index (BMI) (kg/m2) was calculated by dividing weight in kilograms by the square of height in meters [4]. Body weight status was categorized based on cutoff points recommended by the literature: underweight (BMI ≤ 18.5 kg/m2), normal (BMI > 18.5 and < 24 kg/m2), overweight (BMI ≥ 24 and < 28 kg/m2), and obese (BMI ≥ 28 kg/m2) [30, 31].
Outcome assessment
The primary outcome of the study was new-onset hypertension. Participants’ sedentary blood pressures were measured by qualified investigators using a mercury sphygmomanometer three consecutive times at each round. The mean of the three independent measurements of diastolic blood pressure (DBP) and systolic blood pressure (SBP) on the same arm was calculated respectively [4]. Participants were considered having hypertension if they met at least one of the following conditions: a mean DBP ≥ 90 mmHg and/or a mean SBP ≥ 140 mmHg, a self-reported diagnosis of hypertension, or a prescription for anti-hypertension drugs [4]. For those identified with new-onset hypertension, follow-up time was calculated from the entry year until the year of first diagnosis of hypertension. For those free of hypertension, follow-up time was calculated from the entry year to the year before loss to follow-up or the study end year in 2015.
Statistical analysis
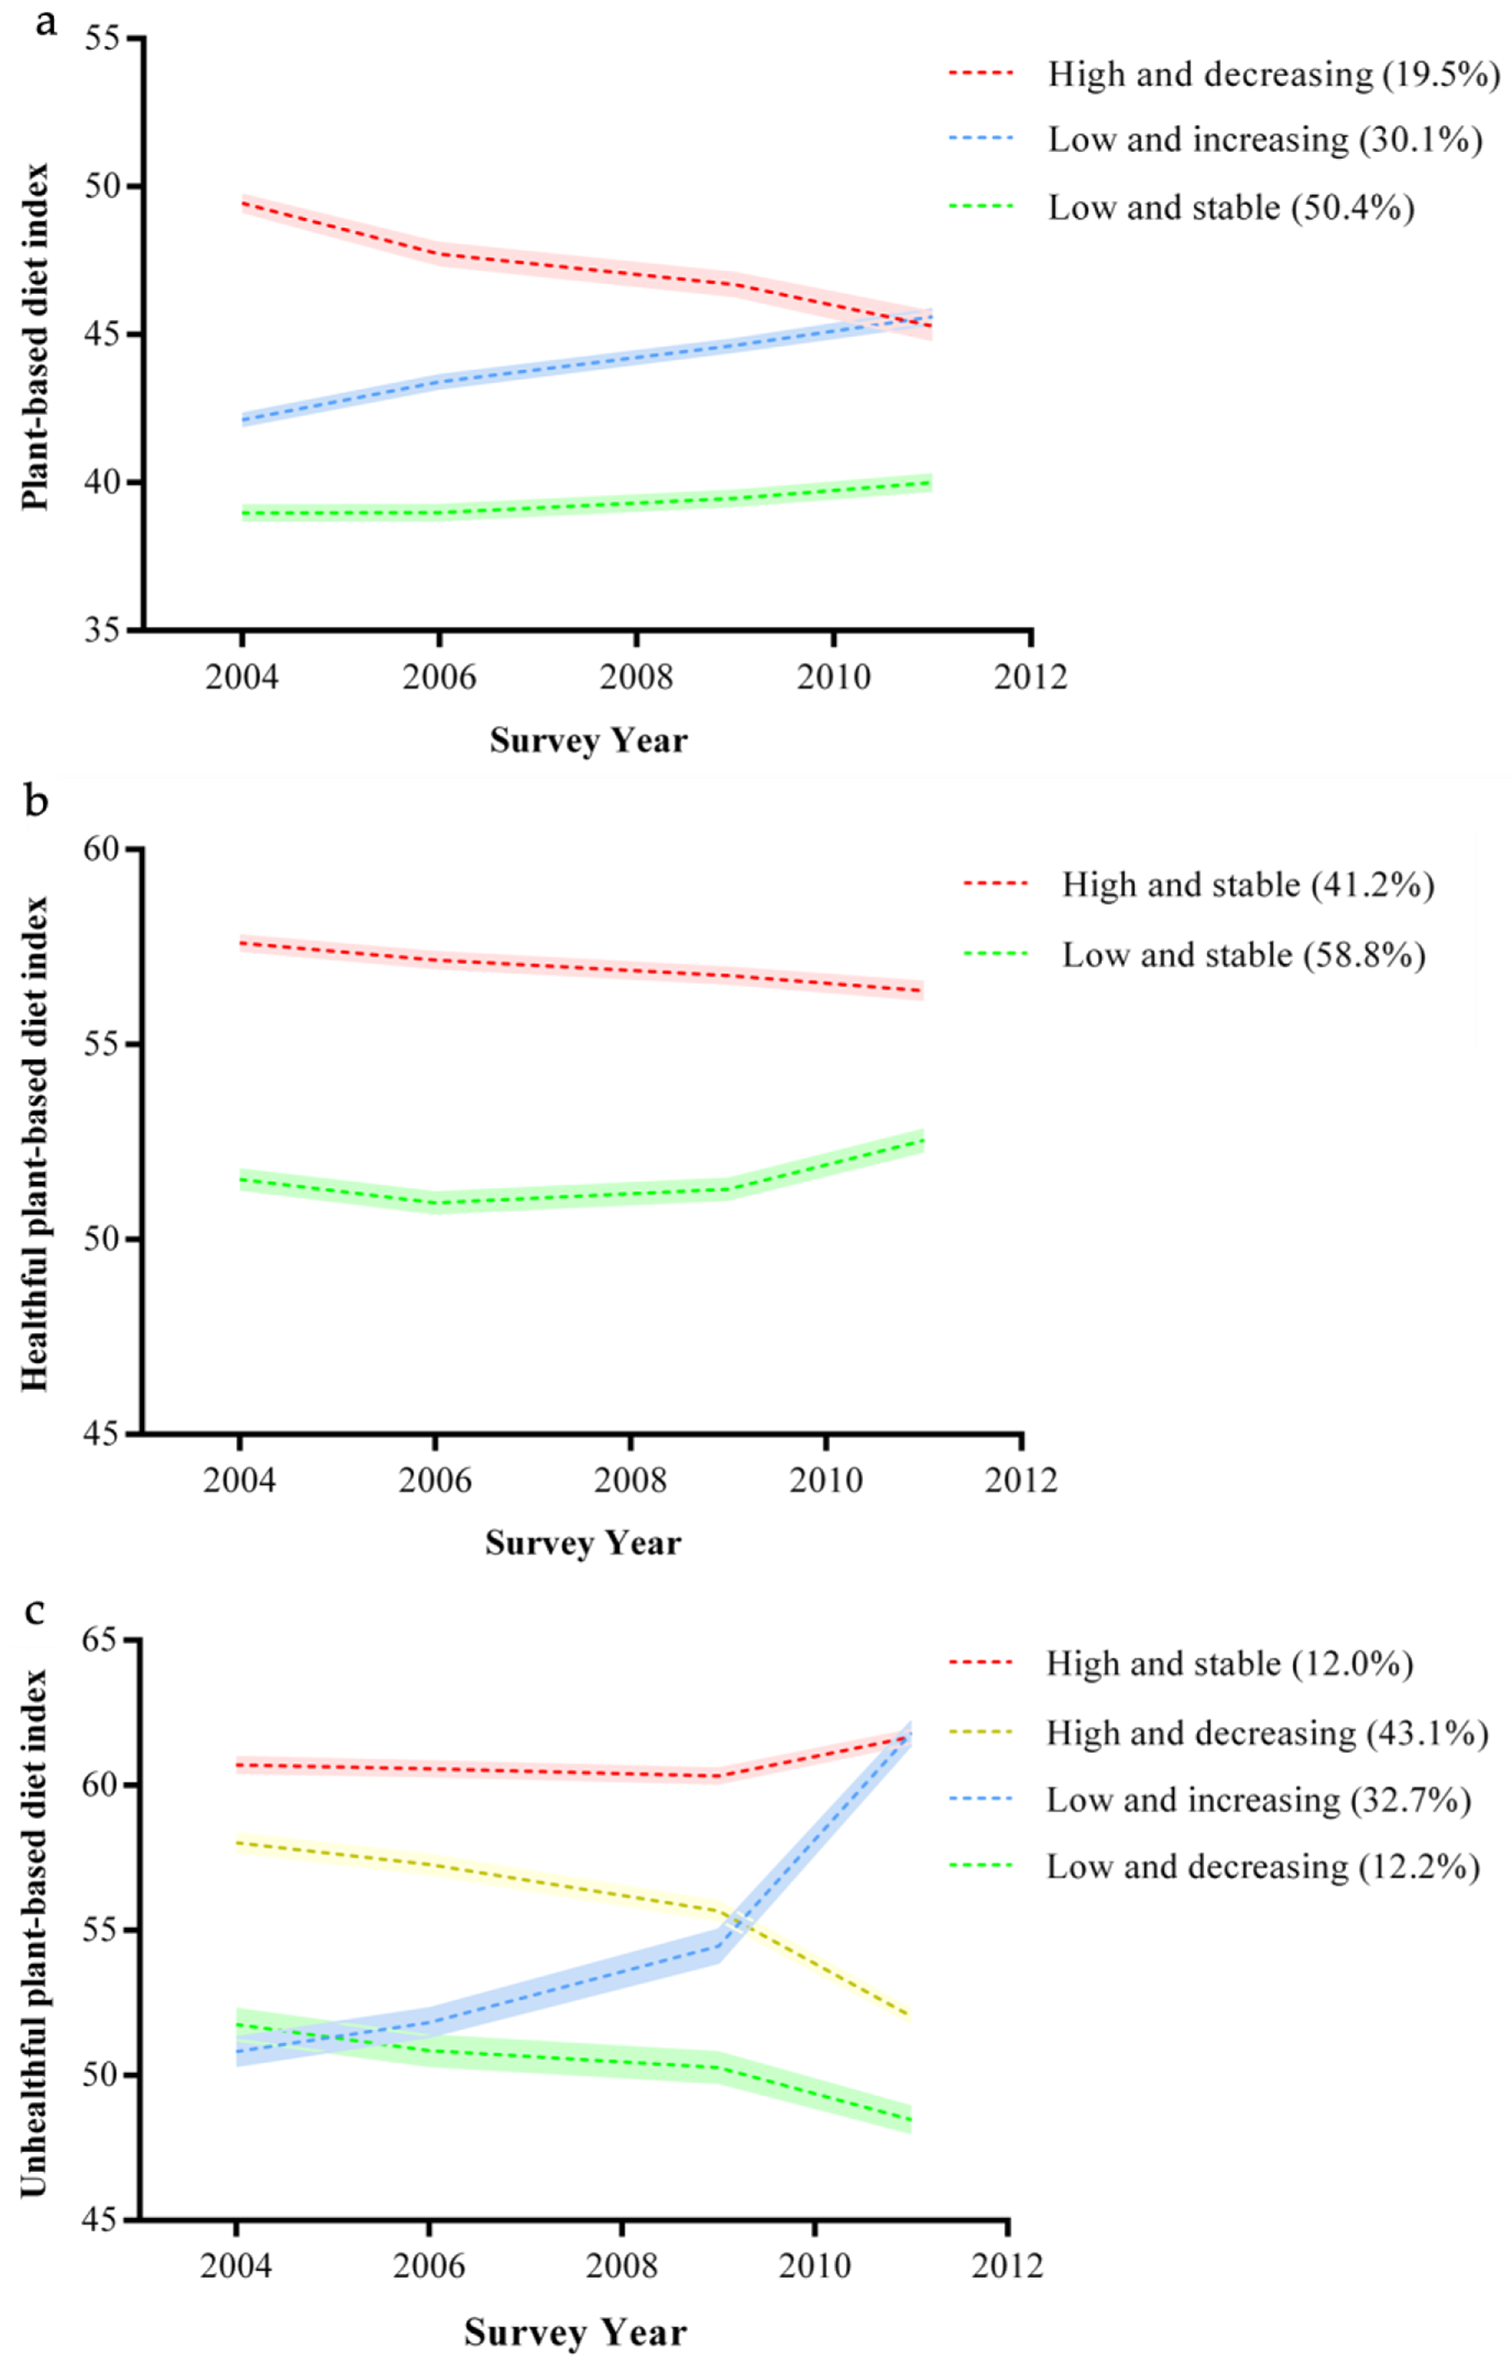
We used a group-based trajectory model (GBTM) to construct trajectories of PDIs. This model allowed us to capture longitudinal growth curves of unknown shape within each class of participants sharing similar traits of interest and following a similar developmental trajectory [32]. To determine the appropriate shape of trajectories, we evaluated both linear and quadratic growth parameters. To choose the optimal number of classes for each trajectory, we mainly used the following model fit indices as suggested by the literature [33]: the adjusted Bayesian Information Criterion (aBIC), the Lo-Mendell-Rubin Likelihood Ratio Test (LMR-LRT), and the average posterior probability (APP). A lower absolute value of aBIC indicates a better fit. The LMR-LRT was used to compare the goodness-of-fit between the model with k classes and the model with k + 1 classes. A P-value < 0.05 suggests that the model with k classes has a better goodness of fit [33]. Additionally, an APP ≥ 0.7 indicates a more accurate classification. Furthermore, to ensure the robustness of our models, any model with a trajectory class constituting < 5% of the total sample size was excluded [34]. Details of the model selection criteria are shown in Supplemental Table 1.
We summarized baseline characteristics and average nutrient intakes according to trajectory classes of PDI, hPDI, and uPDI. Between-group comparisons were examined using chi-square tests for categorical variables and either Student’s t-tests or analysis of variance for continuous variables, as appropriate.
We used Cox proportional hazards models to estimate HRs and 95% CIs for new-onset hypertension in relation to the trajectory classes of PDIs. The proportional hazards assumption of the covariates was tested using Schoenfeld residuals. The test results show that the model satisfies the proportional hazards assumption (P = 0.06). We adjusted the potential covariates in three different models: Model 1 adjusted for age and sex; Model 2 further adjusted marital status, urban residence, education, and income; Model 3 added adjustments for smoking, drinking, BMI, MET, and daily energy intake.
In addition, we conducted stratified analyses to explore the possible effect modifications of other major risk factors for hypertension. These included sex, baseline age (< 45 vs. ≥ 45 years), urban residence (urban vs. rural), marital status (married vs. unmarried), smoking status (non-smokers vs. smokers), drinking status (non-drinkers vs. drinkers), body weight status (non-overweight [< 24 kg/m2] vs. overweight [≥ 24 kg/m2]), and physical activity (MET < 25 h/wk [median] vs. MET ≥ 25 h/wk). P values for interactions were obtained from the product term of the trajectory classes of PDIs and binary variable, which was added as an independent variable to the multivariable models.
Sensitivity analyses were conducted to examine the robustness of our results. We employed the multiple imputation of chained equations method to impute missing values for the covariates, with the number of imputations set to 20. We also used Cox proportional hazard analysis to examine the association between PDIs at baseline and the risk of hypertension. We repeated analyses to include participants with baseline history of chronic diseases, such as diabetes, myocardial infarction, stroke, and cancer. Furthermore, for participants with new-onset hypertension, follow-up time was recalculated using the midpoint date between the survey of the first hypertension diagnosis and the nearest preceding survey [4, 35].
All statistical analyses were conducted using the Mplus version 8.3 and R version 4.0.3. A two-sided p < 0.05 was determined as statistical significance.


Comments (0)