
Remember me


Our study included a cohort of 261 patients with ICH (mean age 69.6 ± 16.5 years, 39.1% female, median National Institutes of Health Stroke Scale [NIHSS] score on admission 6 [IQR 2–12], median ICH score 1 [IQR 0–2]) and data on functional outcome at follow-up after 3 months. A large proportion of the patients had arterial hypertension (80.8%), and other prevalent risk factors included diabetes mellitus (18.8%) and atrial fibrillation (25.7%). Upon admission, the median ICH volume was 17.4 ± 24.6 mL, and a notable percentage of patients were under anticoagulant therapy (24.9%), reflecting the complex medical profiles typically associated with ICH (for further details, see Table 2).
Table 2 Descriptive comparison of baseline characteristics, interventions, and functional outcome of patients with ICH, based on good functional outcome (mRS 0–2) at 90 days’ follow-upPrimary End Point/Good Functional Outcome at 90 Days’ Follow-upPatients with ICH with good outcomes (n = 106) at follow-up were younger than those with poor outcomes (n = 155) (63.2 ± 16. vs. 74.0 ± 12.5, p < 0.001). The good outcome group also had significantly lower mRS scores before the index event and better baseline clinical variables, such as a lower median NIHSS score (3 vs. 9), a higher Glasgow Coma Scale score (15 vs. 14), and a lower ICH score (1 vs. 2, all p < 0.001). Cardiovascular risk factors, such as DM, atrial fibrillation, obesity (body mass index > 30), and coronary heart disease, as well as chronic renal failure were less prevalent in the good outcome group. Further, patients with poor outcome were more likely to have been on anticoagulation therapy upon admission (15.1% vs. 31.6%, p = 0.002). Consequently, patients with good outcome had smaller ICH volumes on admission (10.6 ± 17.6 vs. 22.0 ± 4.3, p < 0.001) and a lower incidence of intraventricular hemorrhage, both on admission and secondary during the clinical course (each p < 0.001). However, early hematoma expansion was not significantly different between the groups (p = 0.147). In terms of interventions, patients with poor outcomes had more frequent acute interventions using medication for coagulation/clotting (p < 0.001) and had longer stays in the ICU and the hospital (both p < 0.015).
Overall, mortality rates were significantly higher for patients with poor outcomes at both discharge and follow-up (p = 0.011 and p < 0.001, respectively), whereas good functional outcome was more likely in the other group (p < 0.001) (for further details, see Table 2). All patients who died within the 90-day follow-up period passed away because of withdrawal of life support. Except for one patient, the patients died at discharge or were transferred with palliative intent. In addition, the mRS score distribution between discharge and 90-day follow-up is shown in Fig. 3 in the supplement.
First BP on Admission and Absolute BP Indices Throughout the First 72 Hours Post AdmissionPatients with ICH with a good outcome had significantly lower systolic BP on admission (mean 150.9 ± 23.7 vs. 162.1 ± 29.7 mm Hg, p = 0.002), whereas diastolic BP was numerically but not significantly higher (mean 86.4 ± 19.4 vs. 84.7 ± 20.5 mm Hg, p = 0.525). As time progressed, the difference with lower systolic BP and higher diastolic BP became more pronounced (for further details, see Table 3), whereas there were no differences in MAP. Within the first 2 h, systolic BP mean values were significantly lower for patients with good outcomes (mean 147.1 ± 20.8 vs. 154.5 ± 23.1 mm Hg, p = 0.009), and this pattern persisted, with significant differences observed in every subsequent time frame up to 72 h. Furthermore, the analysis of the absolute proportion of systolic BP values exceeding 140 mm Hg revealed that patients with good outcomes consistently showed lower proportions across all time frames, particularly notable during the initial 72 h (0.47 ± 0.27 vs. 0.57 ± 0.20, p < 0.001). Diastolic BP values also reflected significant differences, particularly in the earlier periods (0–2 h, 0–8 h, and 0–12 h), when patients with good outcomes had higher mean diastolic BP, indicating a potential trend toward better outcomes with a slightly elevated diastolic pressure during acute management phases. For instance, during the 0–12-h time frame, diastolic BP was significantly higher for those with good outcomes (mean 74.6 ± 13.0 vs. 70.1 ± 10.7 mm Hg, p = 0.003).
Table 3 Descriptive comparison of absolute blood pressure in patients with ICH, based on good functional outcome (mRS 0–2) at 90 days’ follow-upRelationship Between Patient-Related Risk Factors, Acute ICH Treatment, and Good Functional Outcome at Follow-upKey findings from the univariate analysis examining factors associated with a good functional outcome after ICH were as follows: age (odds ratio [OR] 0.950, 95% confidence interval [CI] 0.932–0.968, p < 0.001) and cardiovascular risk factors as indicated by CHA2DS2VAsc Score (OR 0.638, 95% CI 0.540–0.755, p < 0.001) were inversely associated with good outcome. Higher NIHSS score (OR 0.801, 95% CI 0.750–0.855, p < 0.001), higher ICH score (OR 0.419, 95% CI 0.311–0.563, p < 0.001), and higher ICH volume on admission (OR 0.972, 95% CI 0.957–0.988, p < 0.001) were significantly linked to worse outcomes. Early HE showed a nonsignificant trend to reduce the odds of good functional outcome. Any acute intervention using antagonization for anticoagulation showed a strong positive association with a good outcome (OR 0.221, 95% CI 0.114–0.430, p < 0.001), whereas complications during hospital stay reduced the likelihood for good outcome (for further results, see Table 4).
Table 4 Univariate logistic regression analysis for association of baseline characteristics, interventions, BP parameters, and good clinical outcome at follow-upRelationship Between Absolute BP and Good Functional Outcome at Follow-upA significant association was observed between lower average systolic BP and better outcomes in the first 0–2, 0–8, and 0–24 h, with ORs of 0.985, 0.981, and 0.975, respectively, suggesting that lower systolic BP values in these early time windows are associated with a higher likelihood of a good outcome (p = 0.012, 0.013, and 0.007, respectively). Higher average diastolic BP values in the first 0–8, 0–2, and 0–48 h showed a significant association with better outcomes (ORs of 1.029, 1.036, and 1.044; p = 0.007, p = 0.003, and p < 0.001). Further, a lower proportion of systolic BP values exceeding 140 mm Hg showed a significant association (OR 0.228, p = 0.006) with a good outcome. In the long-term observation up to 48 and 72 h after admission, results continued to indicate that both lower systolic and higher diastolic average values were associated with better outcomes (ORs for systolic BP: 0.968 and 0.965; ORs for diastolic BP: 1.044 and 1.050) (for further results, see Table 5).
Table 5 Descriptive comparison of blood pressure variability indices in patients with ICH, based on good functional outcome (mRS 0–2) at 90 days’ follow-upBPVBPV was different regarding patients with ICH with good outcome vs. poor outcome throughout the first 72 h after admission. In detailed analysis of the first 24 h after admission, there was a clear trend of lower systolic and diastolic BPV without reaching statistical significance during the first 2 h after admission, whereas in the time periods 0–8 h, 0–12 h, and especially 8–16 h, the differences were significantly different. Across the initial 2-h period, systolic BP SV showed a numerical but not significant difference (15.5 ± 17.6 vs. 19.3 ± 17.9 mm Hg, p = 0.101); however, SD of systolic BP was significantly different (14.2 ± 13.9 vs. 18.3 ± 13.6 mm Hg, p = 0.021). In the time period 0–8 h, this trend persisted, now also showing significant differences in diastolic BPV regarding CV (0.17 ± 0.09 vs. 0.18 ± 0.10 mm Hg, p = 0.011) and SD (14.1 ± 10.4 vs. 16.7 ± 10.2 mm Hg, p = 0.041). This trend persisted across most metrics, with systolic and diastolic BPV indicators similarly reflecting differences between outcome groups at various time intervals (for further details, see Table 3).
Relationship Between BPV Indices and Good Functional Outcome at Follow-upThe univariate analysis for good outcome in ICH with different BPV indices showed a consistent pattern: lower variability in BP, particularly in systolic BP, was associated with better outcomes. Lower SD values at various time intervals (0–2 h, 0–8 h, 0–12 h, 0–24 h, 0–48 h, and 0–72 h) were significantly associated with a good outcome, indicating that less fluctuation in systolic BP is beneficial. The statistical significance of these associations strengthened over longer periods, especially notable at 0–8 h (OR 0.955, p = 0.001) and beyond. Extremely low CV values (indicative of very little relative variability) across different time intervals (0–8 h, 0–12 h, 0–24 h, 0–48 h, and 0–72 h) were strongly associated with good outcomes, with ORs close to zero and highly significant p values, suggesting that relative stability in systolic BP is crucial for recovery. Similar to systolic BP, lower diastolic BP CV at 0–8 h and 0–12 h was associated with better outcomes, although the association was less consistent across all time frames. There was a nonsignificant trend toward lower SV at 0–24 h and 0–72 h being associated with better outcomes, indicating that less immediate fluctuation in systolic BP might be beneficial, although the evidence was less robust compared to SD and CV measures.
Multivariate Analysis of Absolute BP and BPV Indices and Their Independent Association with Good Functional OutcomesIn the baseline model, significant predictors of good functional outcome were the NIHSS score on admission, the mRS score before the index event, and the presence of preanticoagulation treatment. These factors were associated with a decrease in the likelihood of a good outcome. Further, each unit increase in systolic BPV on admission was associated with a slight statistically significant decrease in the likelihood of good outcome (OR 0.978, p = 0.012) (see Fig. 1a). In model 2, adding different BPV indices for different time frames, these results persisted, whereas individual BPV indices (each systolic and diastolic) showed no significant effects, indicating that systolic and diastolic BPV are not individually. The only exemption was the model with diastolic BPV (SV) during 0–72 h (OR 1.092, 95% CI 1.008–1.184, p = 0.032). Clinically, this result suggested that a greater variability in diastolic BP within the first 0–72 h may be indicative of a more favorable prognosis. This could influence clinical decisions regarding the monitoring and management of BP in patients to optimize their chances of a better clinical outcome. Given the fact that individual BPV indices did not show convincing significant associations with good outcome in ICH, we decided to run a full model including systolic and diastolic BPV indices during the first 0–24 h after careful consideration. The SD of systolic BP over the first 24 h post ICH showed a negative association with good outcomes (OR 0.931, p = 0.044), and the SD of diastolic BP demonstrated a positive association (OR 1.123, p = 0.035), indicating that higher systolic variability is associated with a slight decrease in the likelihood of a good outcome, whereas higher diastolic variability appears to increase the likelihood slightly (see Fig. 1b). In a further analysis including mean systolic and diastolic BP during the first 24 h, systolic and diastolic BPV (OR 0.935 and 1.117, p = 0.063 and 0.051, respectively) showed a similar nonsignificant trend, whereas the absolute mean values of systolic and diastolic BP over the same period do not appear to be significant predictors of the clinical outcome in this analysis (see Fig. 1c). In further analysis for the time period 0–72 h (see Fig. 2a–d), systolic BPV regarding SD did not show a consistent or significant association with the likelihood of good clinical outcome. The p values across the models (0.040, 0.078, and 0.056) hovered around the threshold of significance, suggesting a potential trend but not a definitive conclusion. Diastolic BPV (SD) showed a positive and significant association with a good clinical outcome across all models, with ORs indicating an 11.7% to 20.8% increase in the likelihood of good outcome per unit increase in the SD. The consistency of statistical significance (p values of 0.005, 0.007, and 0.008) across the models strengthened the evidence that greater diastolic BPV is associated with better clinical outcomes. Mean systolic and diastolic BP showed no significant association with the outcome.
Fig. 1
Forest plots with different models regarding good functional outcome after intracerebral hemorrhage (ICH)
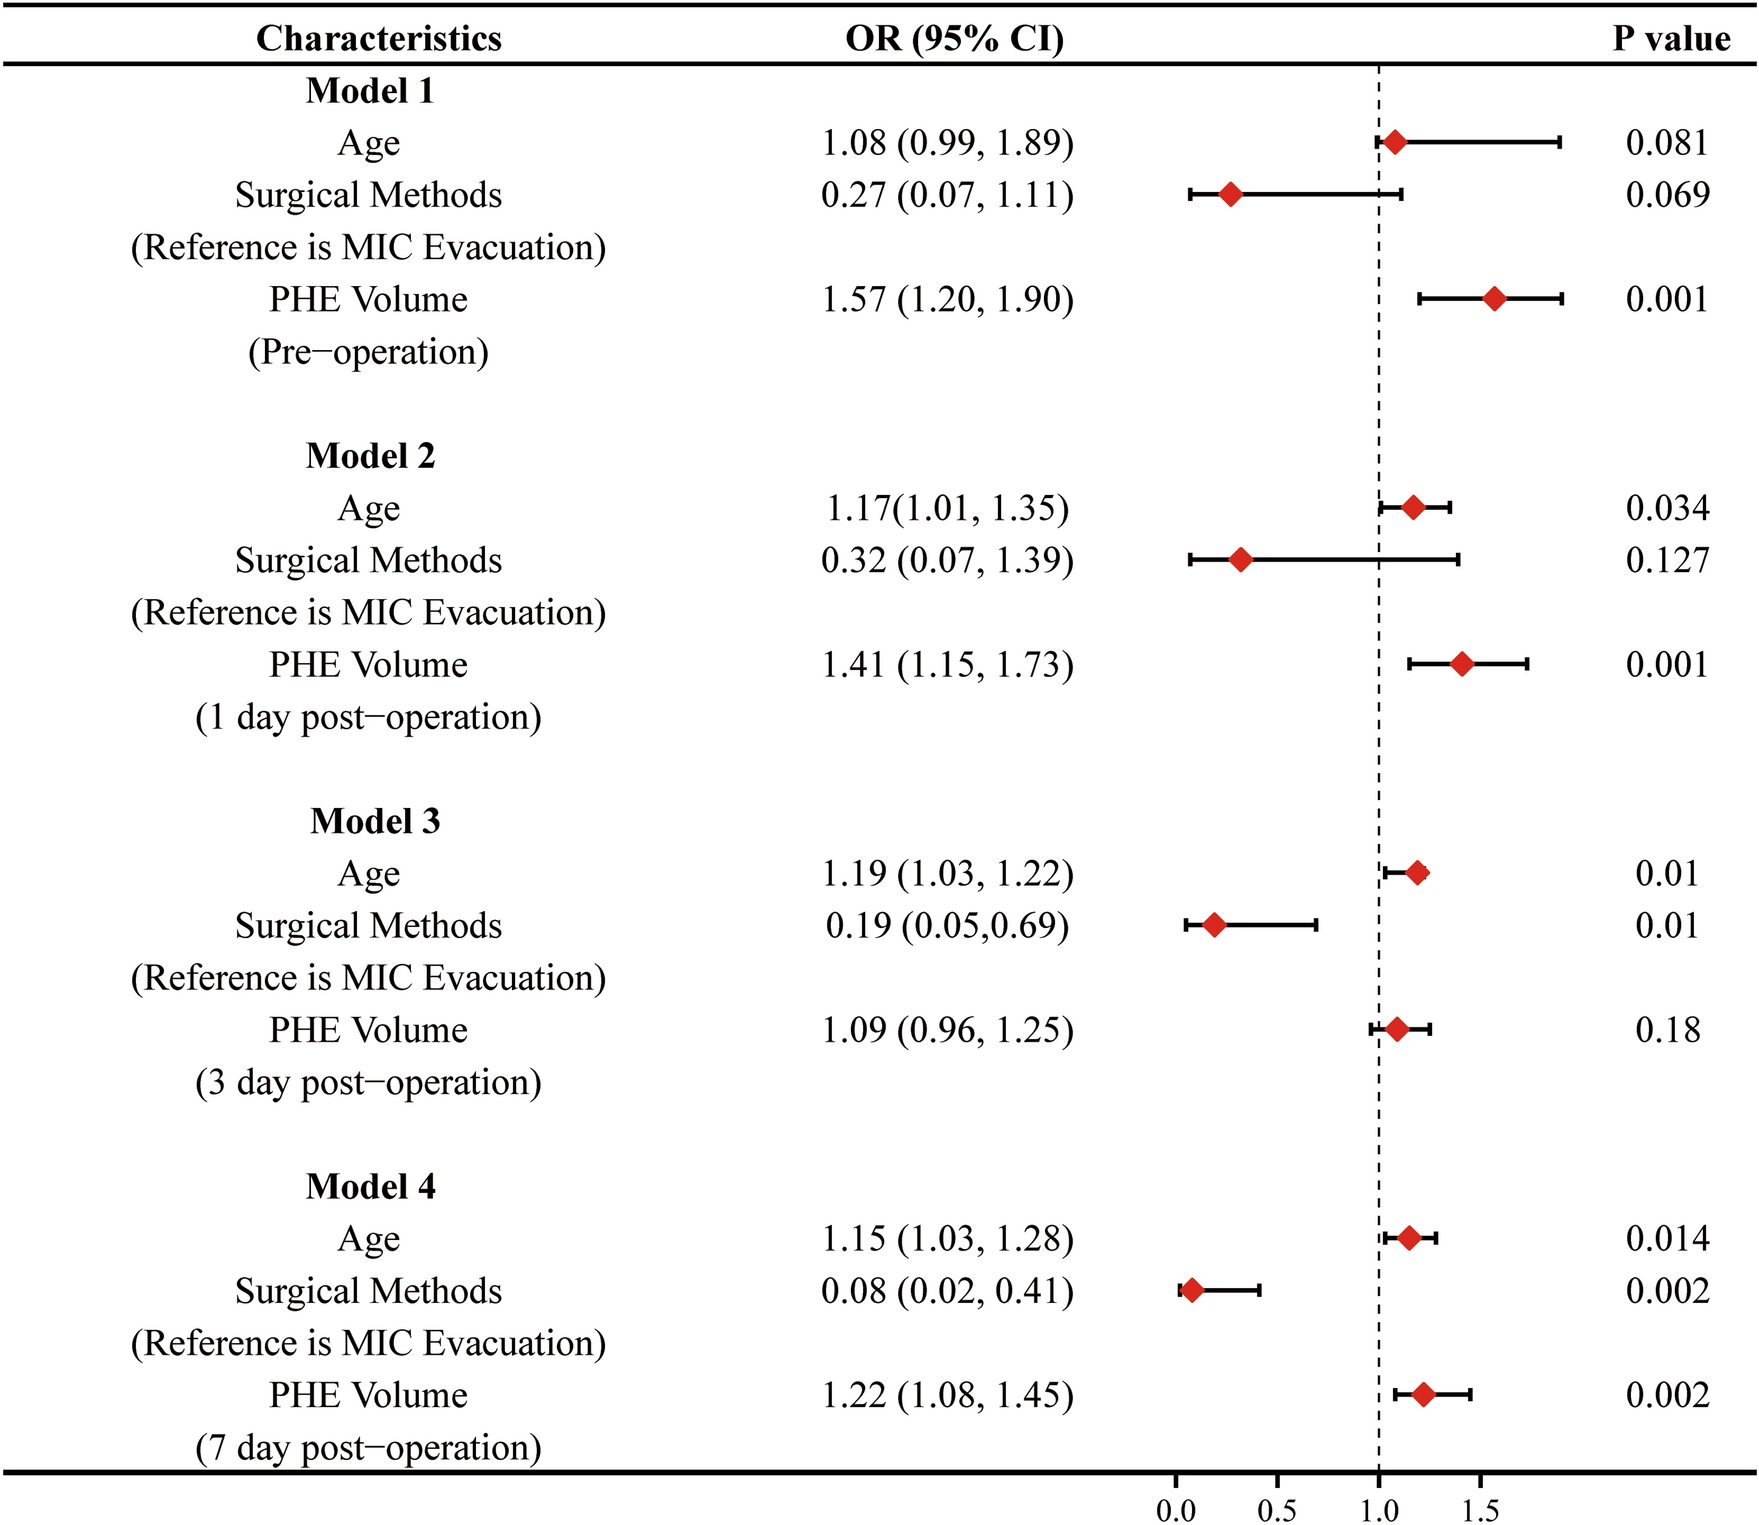
Fig. 2

Forest plots with full model and regarding good functional outcome after intracerebral hemorrhage (ICH)
Comments (0)