
Remember me


In this study, we performed an in-depth analysis of gene expression profiles from patients with T2DN and normal controls using data from the GSE166239 dataset. Specifically, we examined RNA expression data from six T2DN patients and six matched normal controls (Fig. 1A). We then conducted differential expression analysis using DESeq2, a robust statistical tool for detecting changes in gene expression levels. This analysis identified 1204 DEGs, comprising 865 up-regulated and 339 down-regulated genes in the T2DN group compared to the controls, as detailed in Supplementary Data S2. The distribution of these DEGs is visualized in volcano plots (Fig. 1B), which highlight the genes with the most significant changes in expression.
Fig. 1
Identification of DEGs between the DN and control groups. A PCA plot after batch correction. B Volcano plot of DEGs in the expression profiling datasets
Screening of EP-DEGsIn total, we screened 332 DEGs from the UniProt database and 207 DEGs from the HPA, identifying 162 overlapping genes (EP-DEGs) exhibiting consistent expression patterns (Fig. 2A). The distribution of these EP-DEGs was visualized using a volcano plot (Fig. 2B), which revealed 124 up-regulated and 38 down-regulated genes (Supplementary Data S3). Additionally, Fig. 2C provides a detailed illustration of the expression patterns of the EP-DEGs.
Fig. 2
Identification of DEGs that encode EP-DEGs. A Venn diagrams showing a total of 162 EP-DEGs identified. B Volcano plot displaying EP-DEGs. C Heatmap illustrating EP-DEGs
Function enrichment analysis of EP-DEGsGO analysis revealed significant enrichment of EP-DEGs in BP (e.g., extracellular matrix organization), CC (e.g., collagen-containing extracellular matrix), and MF (e.g., extracellular matrix structural constituent) (Fig. 3A, Supplementary Data S4). Concurrently, KEGG analysis indicated that EP-DEGs were predominantly enriched in pathways involving complement and coagulation cascades, cytokine–cytokine receptor interaction and protein digestion and absorption (Fig. 3B, Supplementary Data S5).
Fig. 3
Functional enrichment analysis of EP-DEGs. A Enrichment analysis results of EP-DEGs corresponding to three GO levels: BP, CC, and MF. B KEGG pathways analysis of EP-DEGs
Establishment of the PPI network and identification of key genesA PPI network comprising 162 EP-DEGs was constructed using the STRING database and visualized with Cytoscape software. The resulting PPI network, shown in Fig. 4A, includes 27 nodes and 105 edges, representing 21 up-regulated genes and 6 down-regulated genes. To identify key hub genes, we applied three topological methods, namely, MCC, MNC, and Degree, using the CytoHubba plug-in (Fig. 4B–D). Figures 4B–D illustrate the top ten hub genes identified by each method. The intersection of these three methods revealed five key genes: FN1, TNF, MMP9, TGFB1, and COL1A1.
Fig. 4
Screening the key EP-DEGs via the PPI network. A PPI network constructed using Cytoscape, with network nodes representing proteins. Top ten EP-DEGs obtained using the MCC (B), MNC (C), and Degree (D) methods
ROC curves for the diagnostic value of key EP-DEGs in DN patientsAs shown in Figs. 5A, the AUC values for TNF, COL1A1, and MMP9 were close to 1, indicating high diagnostic accuracy for DN. In contrast, TGFB1 (AUC = 0.7778) demonstrated moderate diagnostic accuracy, while FN1 (AUC = 0.5) exhibited limited diagnostic capability for DN. We conducted a further validation study using another independent dataset to confirm the accuracy of the ROC analysis (GSE142153), showing a similar results (Figs. 5B).
Fig. 5

A, B ROC curves for the diagnostic values of five key EP-DEGs in DN patients. A The same dataset (GSE166239); B another dataset (GSE142153)
Correlations among key EP-DEGs and infiltrating immune cellsBased on the immune cell infiltration matrix, the expression of TNF exhibited strong positive correlations with resting dendritic cells (r = 0.85, P < 0.001) and M1 macrophages (r = 0.62, P < 0.05), while exhibiting a negative correlation with regulatory T cells (r = − 0.62, P < 0.05). FN1 expression was positively correlated with M1 macrophages (r = 0.73, P < 0.05) and also showed another positive correlation with M1 macrophages (r = 0.6, P < 0.05). COL1A1 expression was negatively correlated with resting CD4 memory T cells (r = − 0.66, P < 0.05). MMP9 expression exhibited positive correlations with monocytes (r = 0.8, P < 0.01) and B cell memory (r = 0.64, P < 0.05). Lastly, TGFB1 expression was negatively correlated with naive B cells (r = − 0.65, P < 0.05). These correlations are illustrated in Fig. 6 and detailed in Supplementary Data S6.
Fig. 6
Associations of the expression of five key EP-DEGs and infiltrating immune cells
Correlation analysis between key EP-DEGs and eGFRTo further elucidate the clinical relevance of key EP-DEGs in DN, we performed a correlation analysis between their expression and estimated glomerular filtration rate (eGFR) using Nephroseq v5. The results demonstrated a significant negative correlation between TNF expression and eGFR (r = − 0.7300, P = 0.0255, Fig. 7A). Although TGFB1, FN1, and COL1A1 showed a negative trend, their correlations with eGFR were not statistically significant. Conversely, MMP9 exhibited a mild positive correlation with eGFR (Fig. 7B–E).
Fig. 7
Correlations of the expression of TNF, FN1, COL1A1, MMP9 and TGFB1 with eGFR
GSEA based on TNF expressionBased on diagnostic value, correlations with infiltrating immune cells and eGFR, TNF was identified as a key gene, so six kidney tissues from DN patients were categorized into two subgroups based on the median expression level of TNF for GSEA. Notably, the high-TNF subgroup displayed significant enrichment in pathways related to glycosaminoglycan (GAG) degradation, the Fanconi anemia pathway, steroid biosynthesis, and glycosylphosphatidylinositol (GPI)-anchor biosynthesis (Fig. 8, Supplementary Data S7). This suggests a potential association between elevated TNF expression and alterations in these key metabolic pathways, highlighting their potential role in the pathogenesis of DN.
Fig. 8
GSEA based on TNF expression levels
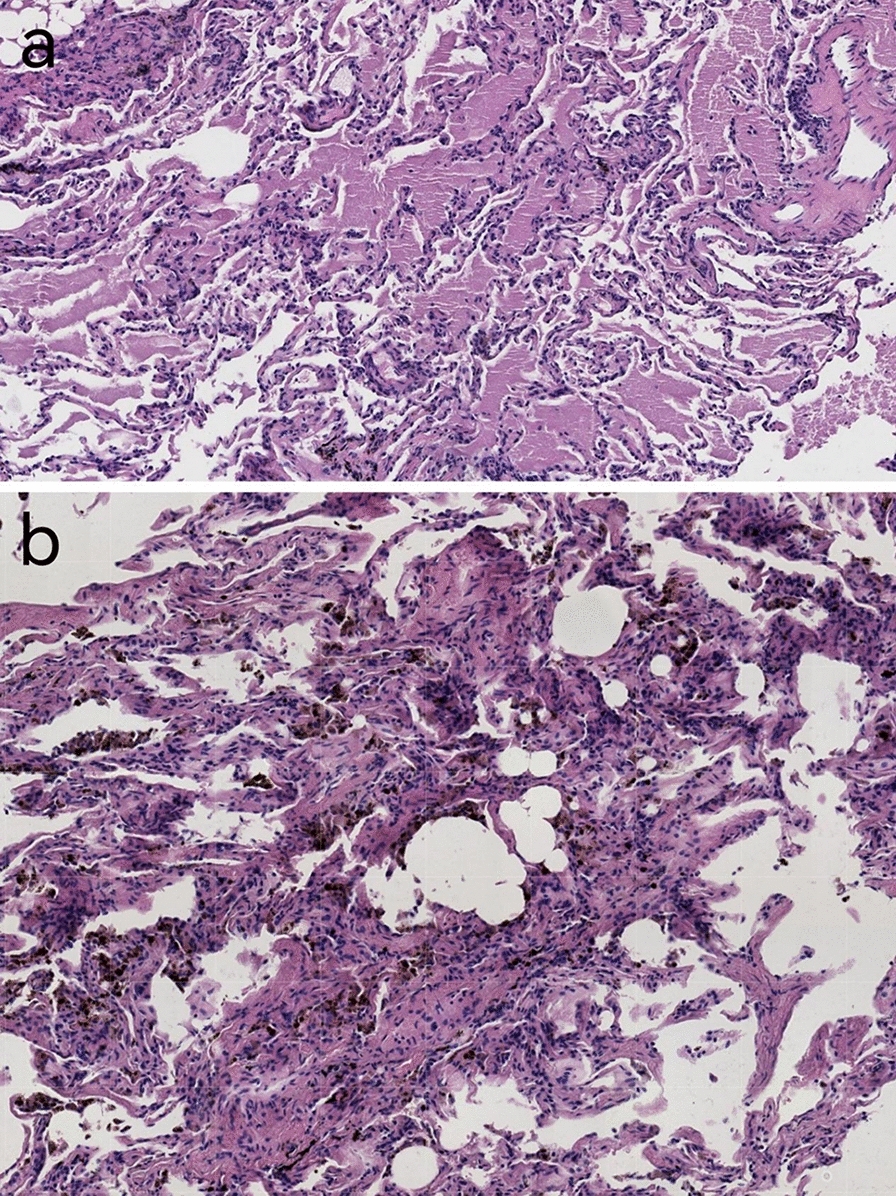
Immunohistochemistry validationA total of 10 paraffin-embedded renal tissue samples from patients with DN and 10 samples from non-tumor renal tissue adjacent to renal tumors, matched for gender and age, were collected for IHC staining. As illustrated in Fig. 9A–D, TNF-α immunostaining was prominently observed in mesangial regions and tubular epithelial cells, with only sparse TNF-α detected in mesangial cells in the control group. Conversely, HA immunostaining showed abundant presence in the nuclei of glomerular interstitial cells and tubulointerstitial cells in the control group, while reduced staining was observed in the mesangial regions of the DN group. The expression levels of TNF-α and HA were significantly higher and lower, respectively, in the DN group compared to the control group (Fig. 9E, both P < 0.05). Furthermore, a negative correlation was found between TNF-α and HA expression in the DN group (r = − 0.691, P = 0.026, Fig. 9F).
Fig. 9
Immunohistochemistry validation. A–D Immunostaining of TNF-a and HA in DN tissues and normal renal tissues (magnification ×400). E The expression of the TNF-a and HA in the DN and control group. (F)TNF-a was negatively correlated with HA in the DN group
Comments (0)