
Remember me
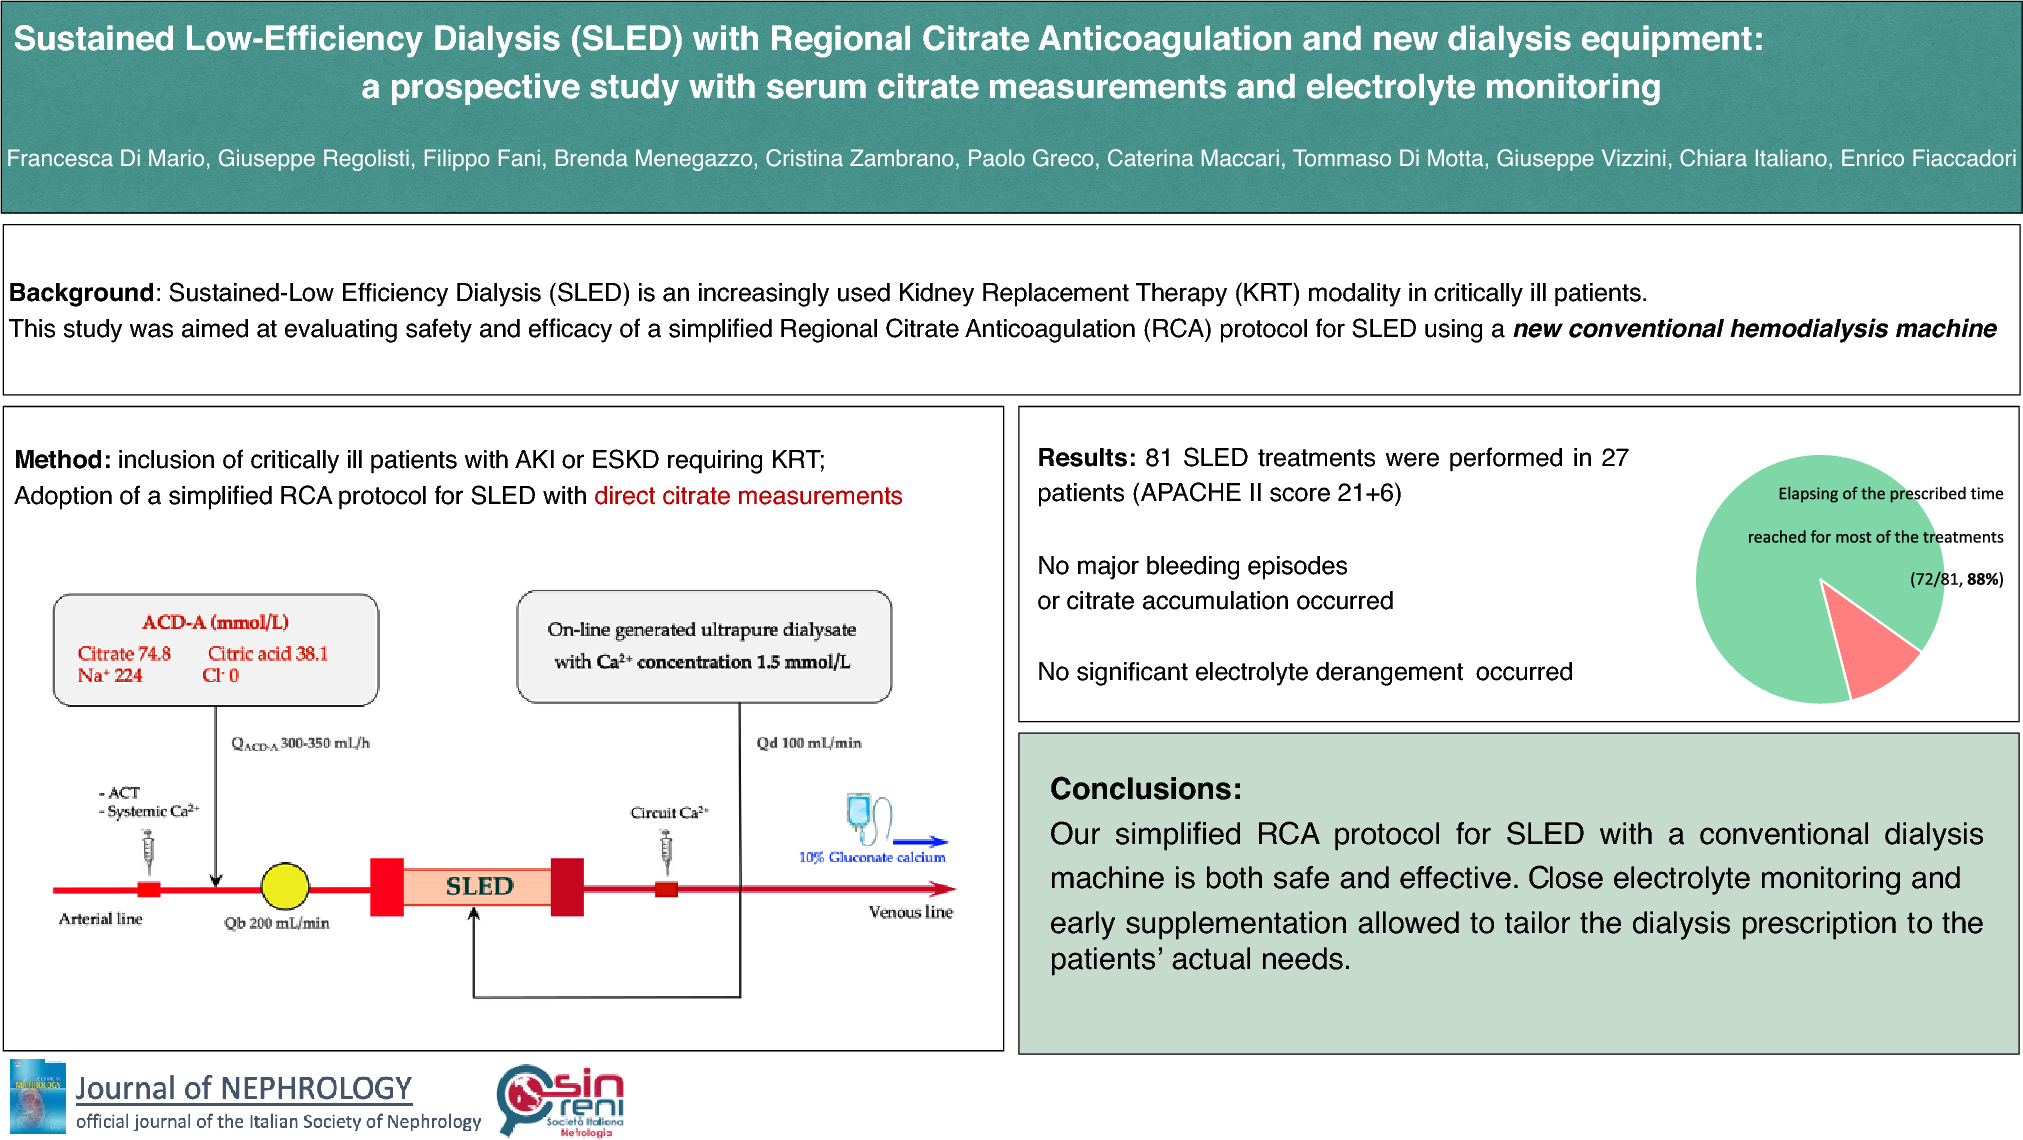


We retrieved 1162 published articles using the defined search criteria and nominated databases. One additional study was identified from reference lists. After removal of duplicates, eligibility screening excluded articles based on title and/or abstract. The remaining 410 articles were reviewed based on eligibility criteria of which 37 were included for analysis. The Preferred Reporting Items for Systematic Reviews and Meta-Analyses (PRISMA) flow diagram (Fig. 1) details the selection process. Details of excluded studies are supplied in Online Resource 1, Supplemental Table 2.
Fig. 1
PRISMA flow diagram of the study selection
CharacteristicsTable 1 provides detailed characteristics of the 26 RCTs comprising 37 published articles, with 1248 participants in total (635 assigned to exercise groups and 613 to control groups). The mean age of the participants was 61 yrs ranging from 44.5 to 78.3 years, with 68.6% being male. Thirteen of these studies were conducted in the United States of America, eight in Brazil, four in Australia, three each in Japan and the Republic of China, two each in Canada and the United Kingdom, and one each in Belgium and Denmark. Most of the studies included a single exercise intervention group and a control group. However, two studies [36, 37] included both home and centre-based exercise groups in addition to the control group, resulting in 39 intervention groups.
Table 1 Characteristics of included studiesThe primary reported main causes of CKD were hypertensive nephropathy, diabetic nephropathy, polycystic kidney disease and glomerulonephritis [39,40,41,42,43]. Within the pool of studies, 18 specifically enrolled participants in CKD stages G3a and b to G4. An additional five studies exclusively targeted participants in stages G2 to G4 of CKD. Furthermore, five studies concentrated on stages G3a and b to pre-dialysis G5, and eight studies encompassed participants across stages G3a and b, G4 or within the G3a and b to pre-dialysis G5 range. One study [44] initially omitted specific CKD stage information; however, subsequent communication with the authors clarified that only individuals with pre-dialysis were included. As a result, this study has been analysed to encompass stages G1 to pre-dialysis G5 of CKD.
Type of interventionFor detailed intervention characteristics, please refer to Supplemental Table 3 in Online Resource 2. Among the intervention groups, aerobic training was employed in 19, combined training in 15, resistance training in four and mind–body exercise in one. The duration of interventions varied, lasting anywhere from 12 to 78 weeks. Exercise session frequency ranged from twice to seven times weekly, with the majority (25 studies) being three. Session durations ranged from 10 to 90 min.
Supervision of the exercise intervention varied across studies, with 14 intervention groups having supervised sessions, ten starting as supervised and transitioning to unsupervised, seven being entirely unsupervised, and six employing a combination of both supervised and unsupervised sessions. Exercise intensity also varied, ranging from 50 to 80% of peak VO2 for aerobic and up to 80% of 1 repetition maximum for resistance training. Of the studies, 22 indicated a progressive exercise program, while 11 mentioned that the exercise intervention was individualised.
Heterogeneity and publication biasUpon examination of the I2 values, we observed predominately low to moderate levels of heterogeneity across most outcomes. However, certain outcomes displayed higher heterogeneity, suggesting some degree of bias. These outcomes encompassed the sit to stand and two-minute step test, serum albumin and blood glucose levels, blood pressure outcomes, and body weight.
Our assessment using Egger funnel plots indicated minimal evidence of publication bias (Online Resource 3, Supplemental Figures [SF] 1 to 9). Nevertheless, we did detect some potential bias in the reporting of lipid parameters, asymmetric dimethylarginine, body fat percentage and lean body mass.
Study qualityWhen applying the Cochrane Risk of Bias assessment tool, the majority of the included studies raised ‘some concern’, primarily due to the absence of intention-to-treat analysis (Online Resource 4, Supplemental Table 4). It is noteworthy that we categorised none of the studies as having low-quality using this assessment tool. These findings contrast with those of Nakamura [13]. Of the same included studies, Nakamura reported a high risk in the ‘missing outcome data’ domain for three papers [42, 45, 46], one paper in the ‘measurement of outcome data’ domain [40], and in the ‘selection of reported results’ domain for four papers [41, 43, 45, 47]. Consequently, Nakamura assigned an overall high risk for these papers, ultimately leading to the conclusion of low-quality. The authors of Nakamura [13] decisions regarding the level of risk using the Cochrane Risk of Bias tool are unknown, however, we are confident our thorough assessment is appropriate for the outcomes we have included in this review.
The median TESTEX score, which evaluates both study quality and reporting, found 12 of the 37 studies to be of low-quality with a score of less than 10 out of a possible 15. Specifically, aspects such as blinding of assessors (observed in 8 out of 37 studies), intention to treat (found in 4 of 37 studies) and monitoring activity of the control group (evident in only 3 of 37 studies studies) were observed (Online Resource 4, Supplemental Table 5). We used the TESTEX data for our sub-analyses via removing low-quality studies.
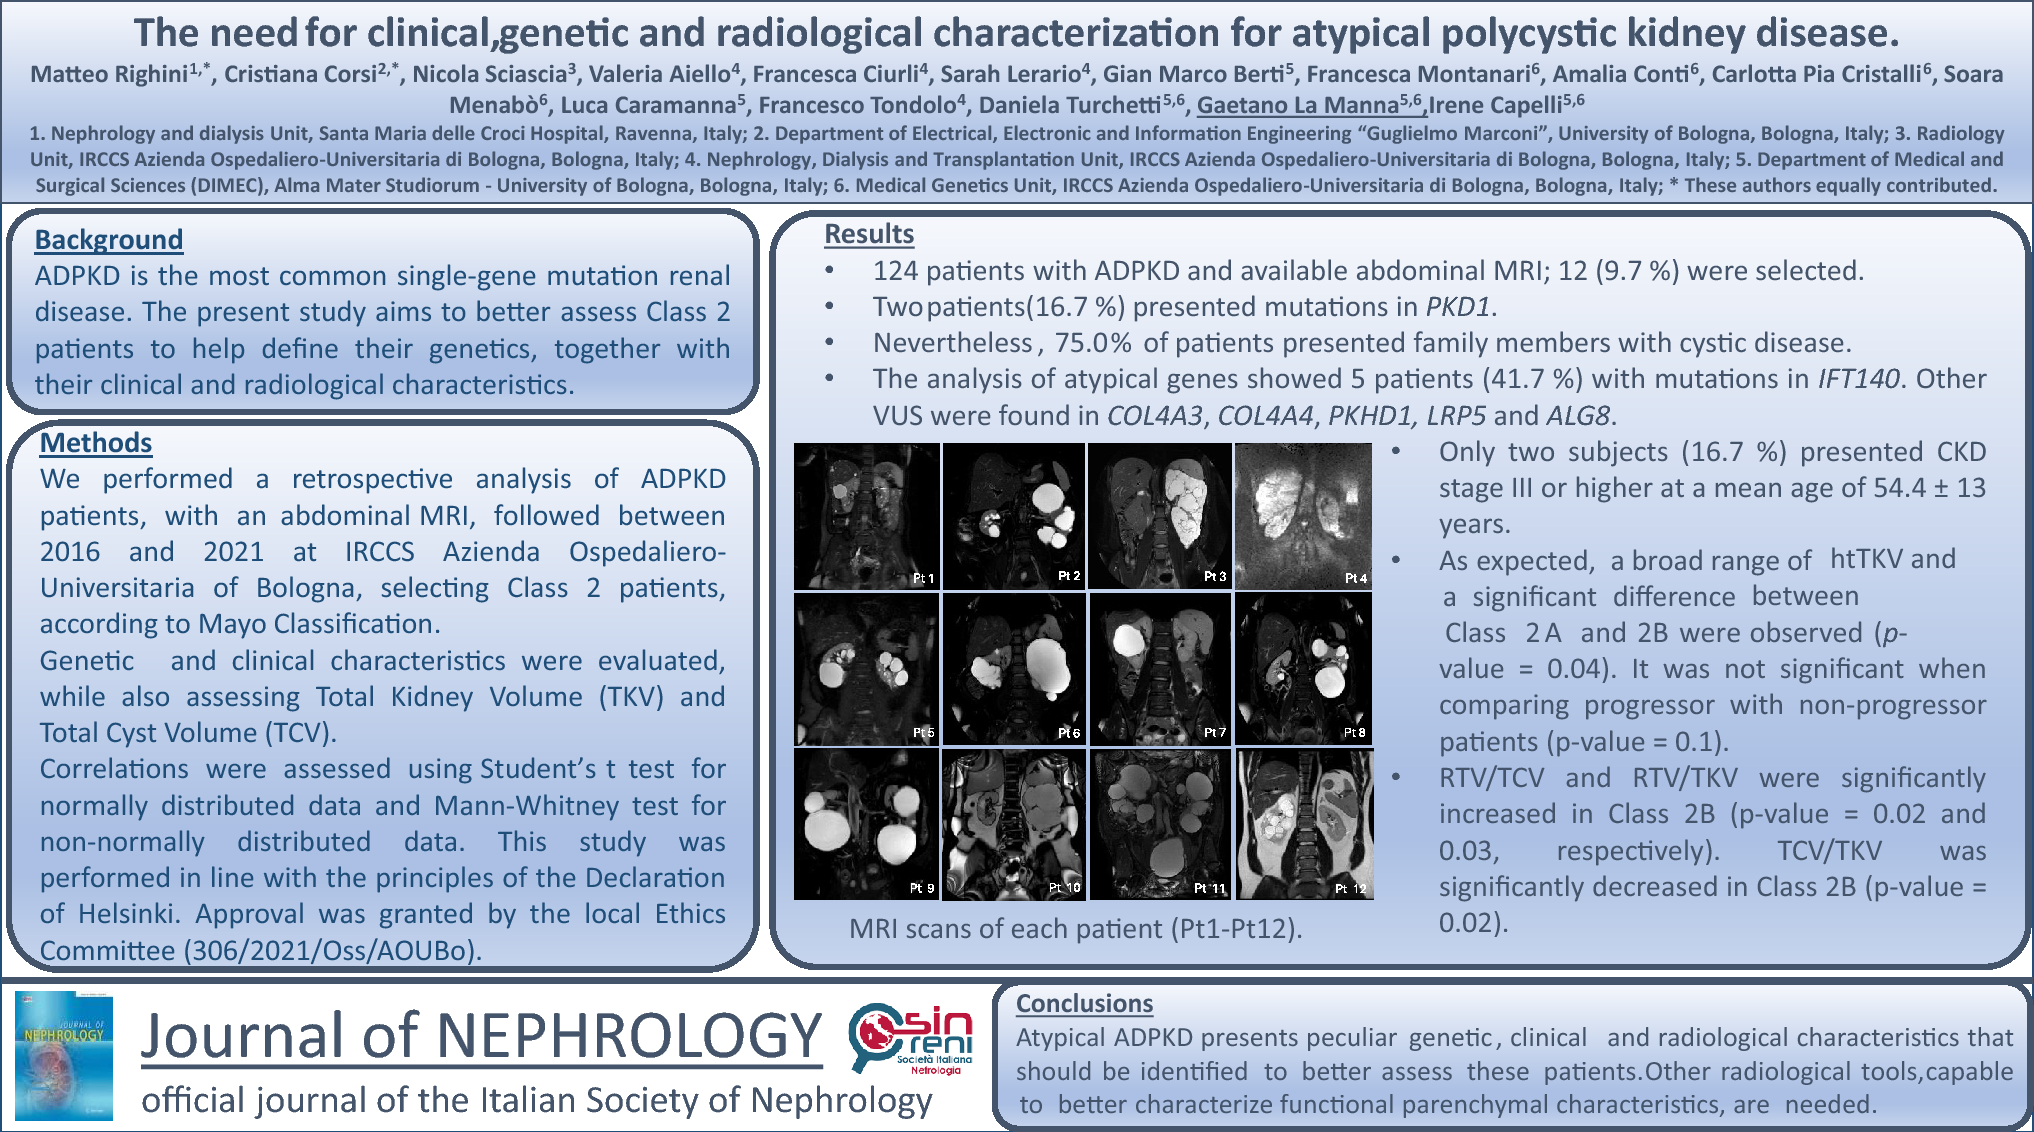
OutcomesA summary of all meta-analyses is provided in Table 2. Further results, including sub-analyses, are available in Online Resource 6, Supplemental Table 6.
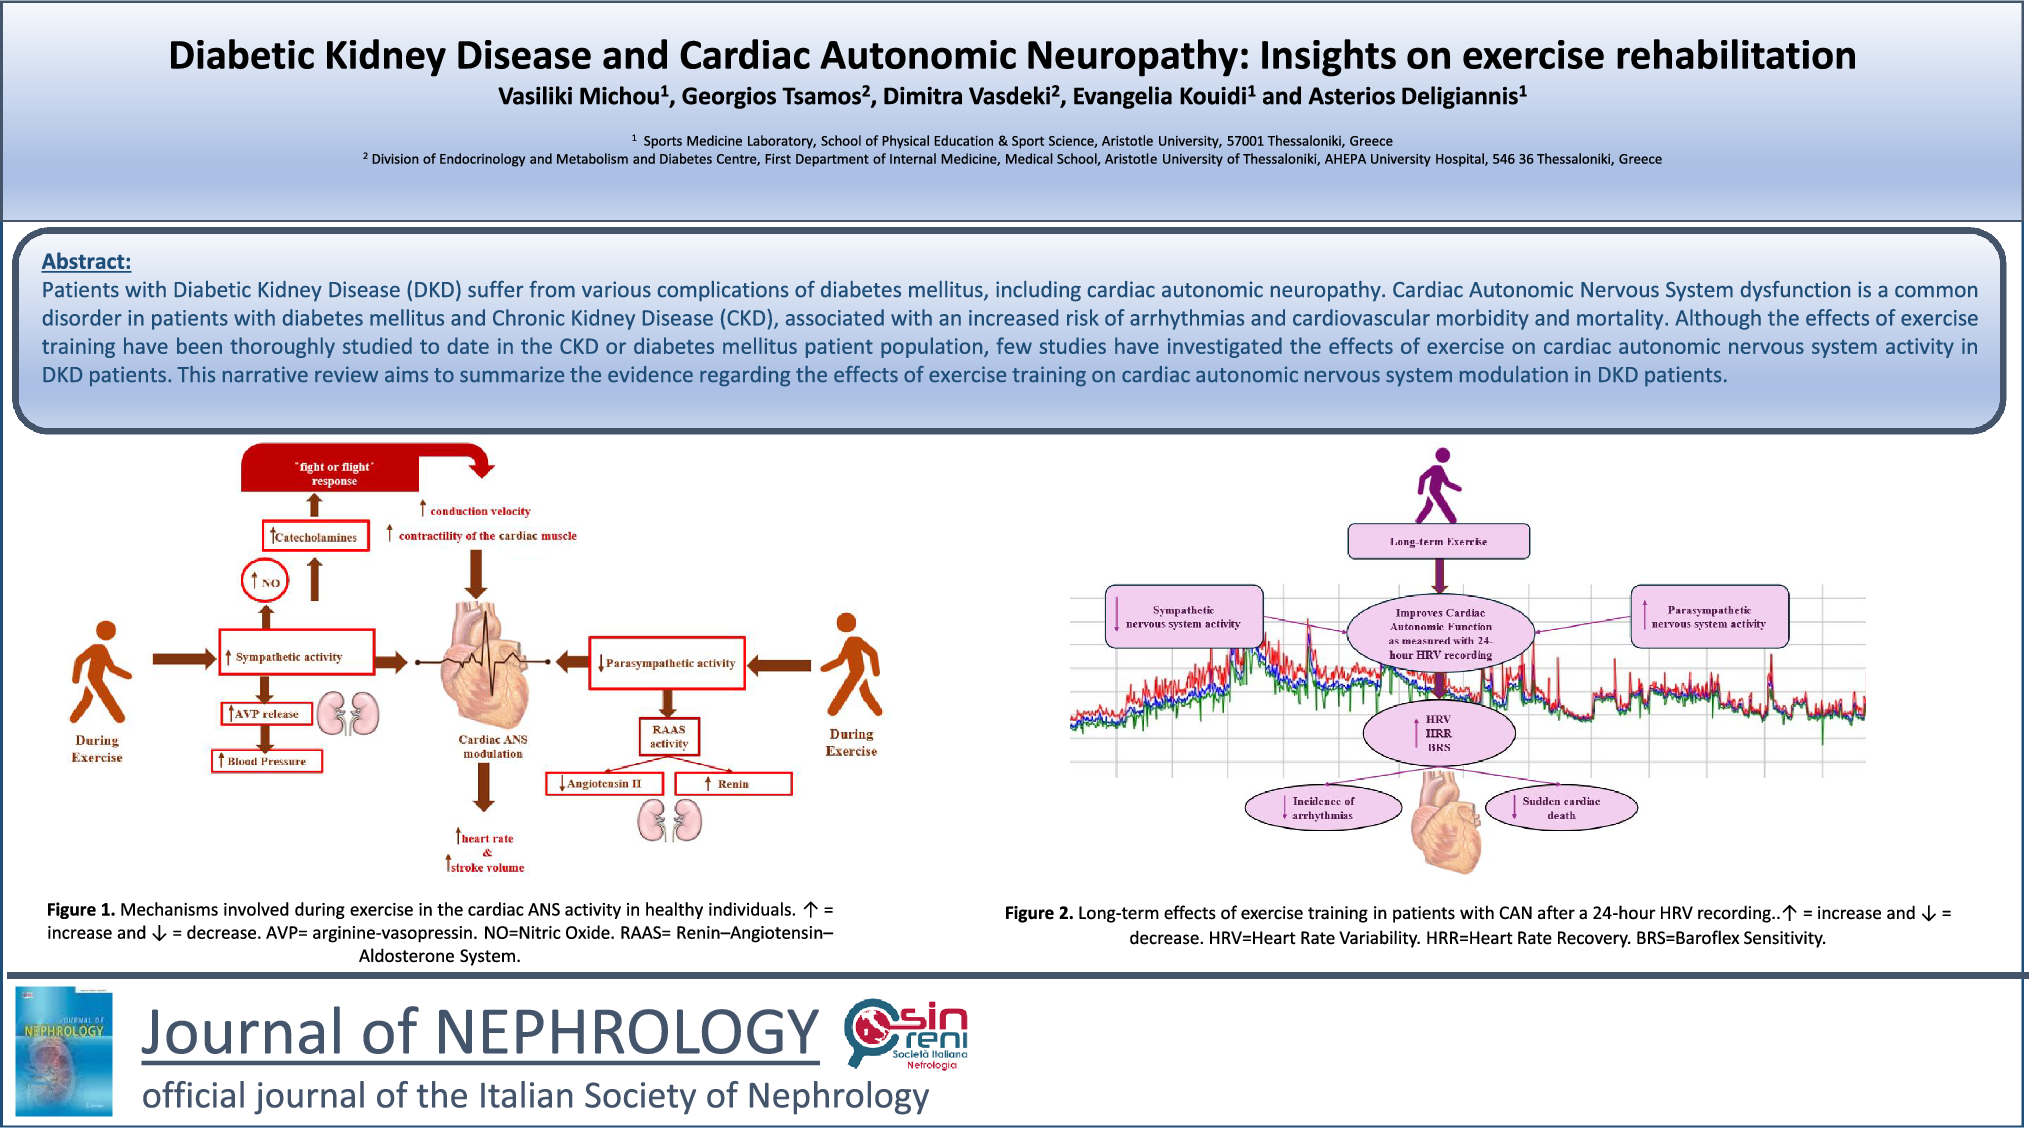
Table 2 Summary of meta-analyses: aerobic capacity, functional ability, quality of life, renal parameters, cardiovascular risk factors, and inflammatory markersAerobic capacity and functional abilityPeak VO2 data were available in 14 studies comprising 15 intervention groups and 547 participants [23, 25, 39,40,41,42, 45, 48,49,50,51,52,53,54]. Our pooled analysis demonstrated a significant improvement in peak VO2 (and hence aerobic capacity) for the exercise group when compared to the control group (MD 2.66 mL/kg/min; 95% CI 1.48 to 3.83; p < 0.00001) (Fig. 2). Sub-analysis removing low-quality studies from pooled analyses continued to display a significant improvement in peak VO2 in favour of the exercise group (Online Resource 5, Supplemental Fig. 10a).
Fig. 2
Change in aerobic capacity via Peak VO2 [mL/kg/min] in people with pre-dialysis CKD by modality i) and by CKD stage ii)
Sub-analysis based on exercise modality demonstrated a significant improvement in peak VO2 for the exercise group when compared to the control group for both the aerobic and combined training interventions (OR 6, ST 6). Sub-analysis based on intervention duration revealed significant improvement in peak VO2 for the exercise group when compared to the control group when the exercise intervention lasted less than 12 weeks or extended beyond 6 months, with no statistically significant difference observed in either group for interventions spanning between 12 weeks and 6 months (Online Resource 6, Supplemental Table 6). The sub-analysis considering supervision of intervention showed a significant improvement of peak VO2 for the exercise group compared to the control group within the studies employing supervised sessions, the one study using unsupervised sessions, and the studies incorporating a combination of regular supervised and unsupervised sessions (Online Resource 6, Supplemental Table 6). In our sub-analysis based on frequency of intervention, a significant improvement in peak VO2 was noted for the exercise groups undertaking 3 sessions per week, as well as those undertaking 2–3 and 1–4 sessions per week, and daily sessions when compared to the control group (Online Resource 6, Supplemental Table 6). It is worth noting that these last three categories each included one study only. The sub-analysis examining the impact of exercise on peak VO2 within the sub-groups of CKD revealed significant improvements for the exercise group in the sub-groups CKD 3–4 and CKD 3, 4, 3–5 when compared to the control group (Online Resouorce 6, Supplemental Table 6).
Peak respiratory rate data were available in 4 studies [20, 53, 55, 56] involving 148 participants (Online Resource 7 Supplemental Fig. 15a and b). Our pooled analysis did not reveal any significant differences between the intervention and control groups (Table 2). Sub analyses based on intervention modality, duration, supervision, and CKD stage also failed to demonstrate statistical significance for either group (Online Resource 6, Supplemental Table 6).
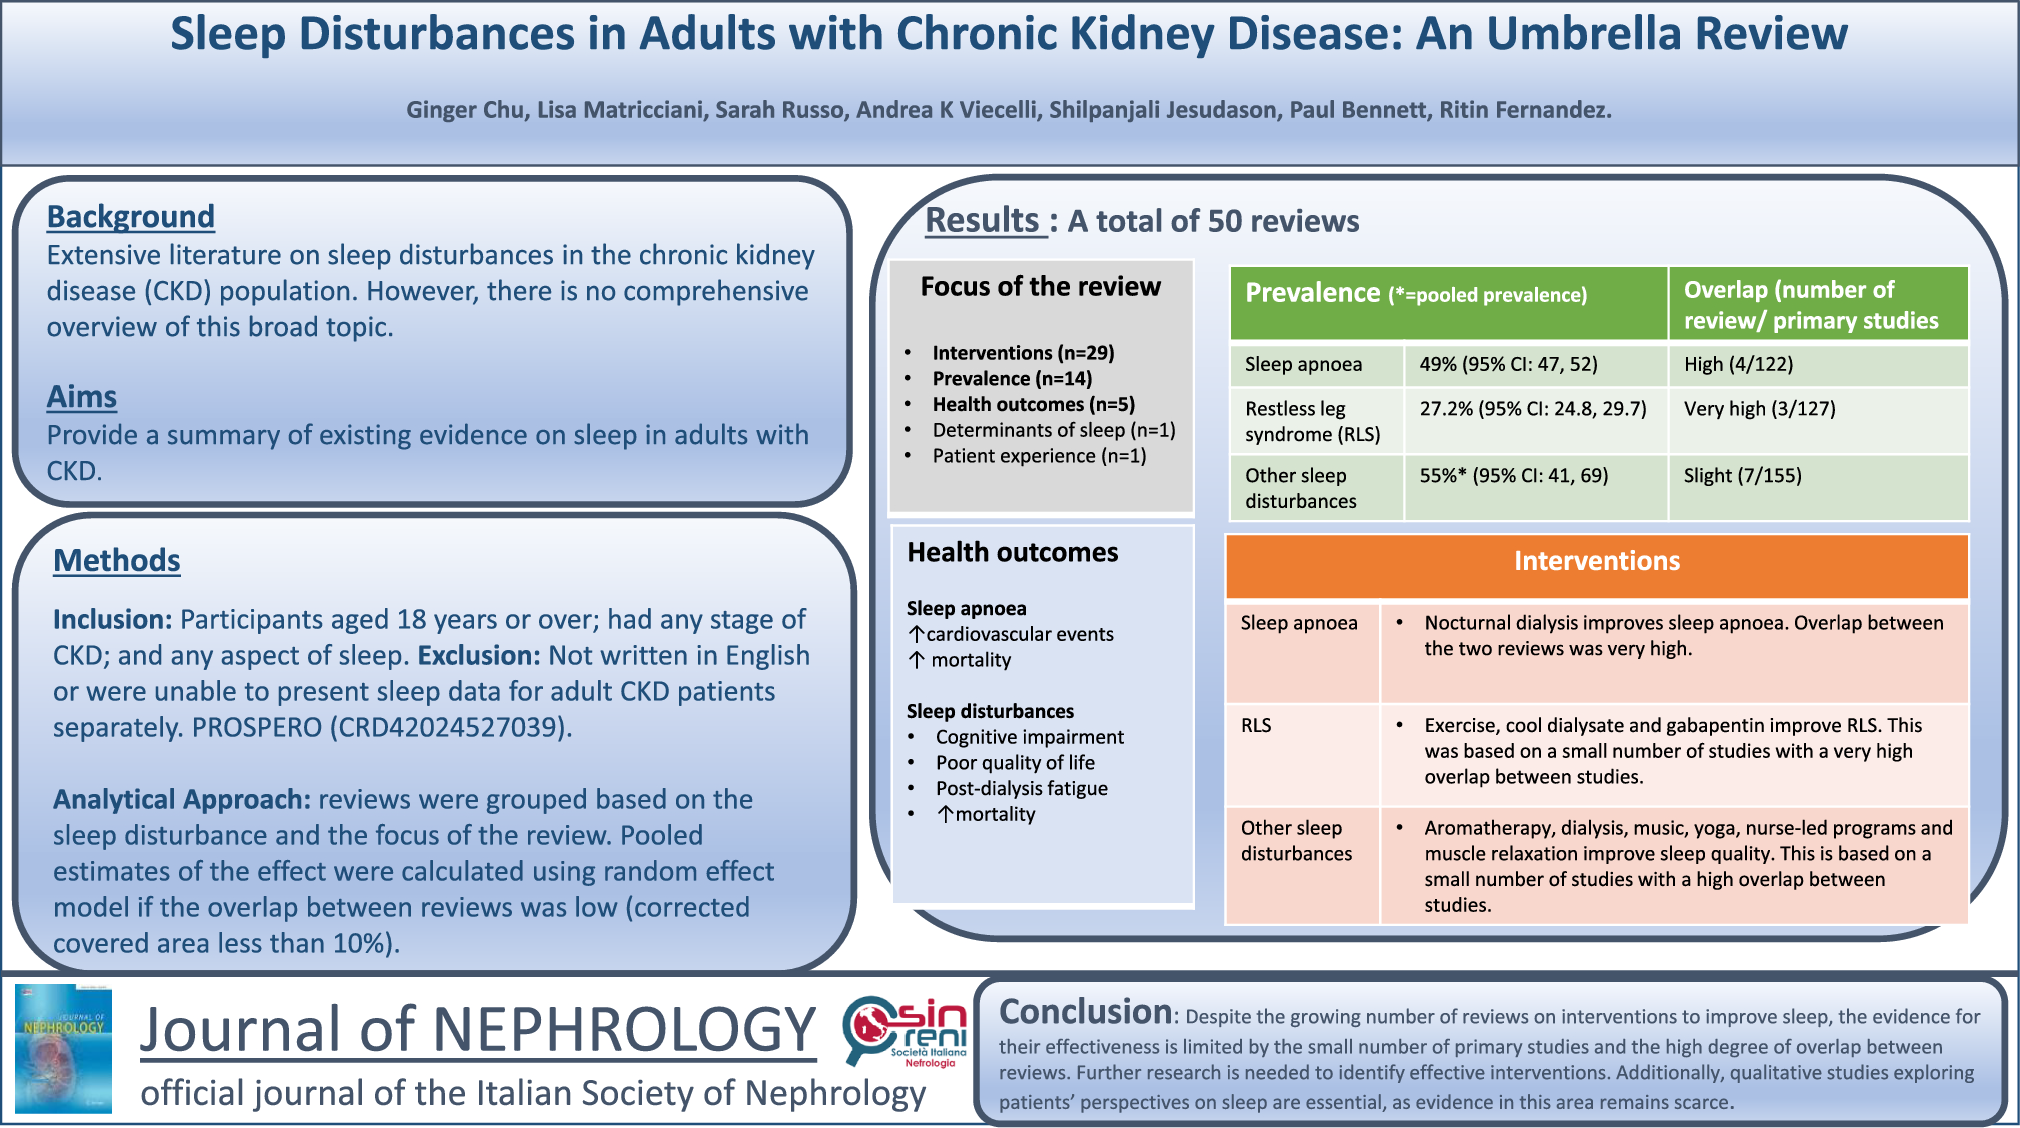
The six-minute walk test was reported in seven studies involving 8 intervention groups and 489 participants [18, 25, 39, 46, 49, 51, 57]. Our analysis revealed a statistically significant increase in the distance walked in six minutes for the exercise group compared to the control group (MD 58.83 m; 95% CI 35.26 to 82.41; p < 0.00001) (Fig. 3a). Sub-analyses removing low-quality studies from pooled analyses continued to show an improvement in the 6MWT for those participants in the intervention group compared to the control group (Online Resource 5, Supplemental Ffigure 10b).
Further sub-analyses of the aerobic, resistance which included one study only and combined training, all durations, and both the supervised and unsupervised (one study only) intervention sub-groups demonstrated significant improvements in the distance walked by the exercise intervention group compared to the control group (Online Resource 6, Supplemental Table 6). The sub-analysis of CKD stages indicated a significant improvement in the distance covered in the 6MWT for the exercise group compared to the control group for the sub-groups CKD 2, 1–3, and CKD 3–4. These findings mirror the results observed for peak VO2 (OR 6, ST 6).
Pooled analyses of the timed up and go test involving six studies, 7 intervention groups, and 408 participants [18, 25, 39, 47, 49, 51] indicated a significant decrease in the time required to perform the test for the exercise group compared to the control group (SMD − 0.35; 95% CI − 0.54 to − 0.15; p = 0.0006) (Fig. 3b). Typically, the timed up and go test test involves a three-meter distance. However, the study by Barcellos [47] measured timed up and go test over a distance of 8 feet (2.44m). Consequently, we analysed this particular outcome using the standard mean difference (SMD) due to the variation in measurement units between studies. Our sensitivity analysis revealed a loss of significant benefit when the study by Barcellos was removed, with p = 0.07 (Online Resource 8, Supplemental Fig. 20a).
The change in time taken to perform the timed up and go test remained significantly decreased in the exercise group compared to the control group with low-quality studies removed (Online Resource 5, Supplemental Fig. 10c). Further sub-analyses of timed up and go test also revealed a significant decrease in the time required to perform the test for the exercise group in both resistance (one study only) and combined training, as well as training durations spanning more than 12 weeks to less than 6 months, and over 6 months (Online Resource 6, Supplemental Table 6). These improvements in timed up and go test were consistent for both supervised and initially supervised exercise interventions versus the control group (Online Resource 6, Supplemental Table 6). Sub-analysis of the sub-groups involving CKD stages revealed a significant decrease in time taken to perform the test by the exercise group compared to the control group for sub-groups CKD 2, 1–3 (one study only), CKD 2–4, and those in CDK 3–4 (Online Resource 6, Supplemental Table 6).
The two-minute step test comprising two studies, 3 intervention groups, and 139 participants [47, 58] (MD 57.48 steps; 95% CI 27.80 to 87.16; p = 0.0001) (Fig. 3c) and the 30-s sit to stand test involving three studies, 4 intervention groups, and 165 participants [20, 47, 58] (MD 4.55 repetitions; 95% CI 1.49 to 7.60; p = 0.004) (Fig. 3d), both showed significant improvements in the performance of the tests by the exercise groups compared to the control group. The sensitivity analysis for the sit to stand test failed to continue this improvement when the study by Barcellos [47] was removed, leading to p = 0.06 (Online Resource 8, Supplemental Fig. 20b).
Sub-analyses of the two-minute step test and sit to stand test tests revealed significantly improved changes in performance by the intervention group for the aerobic and combined (one study only) training sub-groups as well as for training duration of more than 12 weeks but less than or equal to 6 months when compared to the control group (Online Resource 6, Supplemental Table 6). Significant improvements in two-minute step test and sit to stand test were also observed in the exercise sub-groups that were supervised and initially supervised (one study only) compared to the control group (Online Resource 6, Supplemental Table 6). Additionally, participants in CKD sub-groups of stages CKD 2–4 and CKD 3–4 (one study only for each) displayed significant improvements in the two-minute step test and sit to stand test compared to the control group (Online Resource 6, Supplemental Table 6).
Handgrip strength was assessed in seven studies [18, 20, 24, 26, 43, 49, 59] with 372 participants. The analysis did not reveal any significant gain in strength or differences between intervention and control groups (Online Resource 7, Supplemental Fig. 15c and d). The removal of one study [25] deemed low-quality, however, resulted in attainment of a statistically significant gain in strength for the exercise intervention group (p = 0.0003) (Online Resource 5, Supplemental Fig. 10d).
Sub-analyses of handgrip strength based on exercise modality, revealed a significant improvement in strength in favour of resistance training. Similarly, significant results for handgrip strength emerged in favour of the exercise intervention group for duration spanning more than 12 weeks to less than 6 months, and also for the sub-groups undergoing supervised sessions, when compared to the control group (Online Resource 6, Supplementary Table 6). However, the sub-analysis of exercise versus control based on CKD stage sub-groups failed to demonstrate statistical significance for either sub-group (Online Resource 6, Supplemental Table 6). Handgrip strength also displayed a significant improvement in favour of the exercise group (p = 0.04) on sensitivity analysis when the study by Beetham [49] was removed (Online Resource 8, Supplemental Fig. 21a).
Fig. 3


Change in functional ability in people with pre-dialysis CKD by modality i) and CKD stage ii)—exercise versus control: a six-minute walk test (6MWT) [meters]; b timed up and go (TUG) [minutes]; c two-minute step test (2MST) [number of steps achieved in two minutes]; d sit to stand (STS) [number of repetitions in 30 s]
Quality of lifeThe included studies employed comparable versions of the short form (SF)-36 questionnaire [60], with lower scores indicating poorer quality of life [61]. Three studies used the Kidney Disease Quality of Life SF-36 [24, 53, 57], two the Health Related Quality of Life SF-36 [50, 52], two the Ki
Comments (0)