
Remember me


A 52-year-old male patient with type II diabetes and bilateral non-proliferative diabetic retinopathy complicated by diabetic macula oedema presented with a 4-day history of suddenly reduced and patchy vision in his right eye. This occurred 35 days after the last intravitreal injection of Faricimab (Vabysmo). His visual acuity in the right eye had declined from 20/25 at the time of the last injection to 20/63, while the visual acuity in his left eye remained stable at 20/32. Over the course of his treatment for diabetic macular oedema, both eyes had received six Faricimab injections, with the right eye treated over 8 months and the left over 7 months, resulting in the complete resolution of macular oedema in both eyes. The patient had been treatment-naïve before Faricimab injections were initiated. The patient's HbA1c was 7.9% (63 mmol/mol).
Ophthalmic examination showed no cells in the anterior chamber or vitreous in either eye. Fundus examination of the right eye revealed new blot hemorrhages in the temporal periphery and attenuation of both peripheral and central retinal arteries and veins, as seen on Optos widefield-imaging (Optomap P200; Optos plc, Dunfermline, UK) in Fig. 1 and on fluorescein angiography in Fig. 3, A-B. Optical coherence tomography (OCT) imaging of the macula revealed signs consistent with paracentral acute middle maculopathy in the right eye (Fig. 2). The left eye showed mild fluorescein leakage from peripheral veins but was otherwise unremarkable.
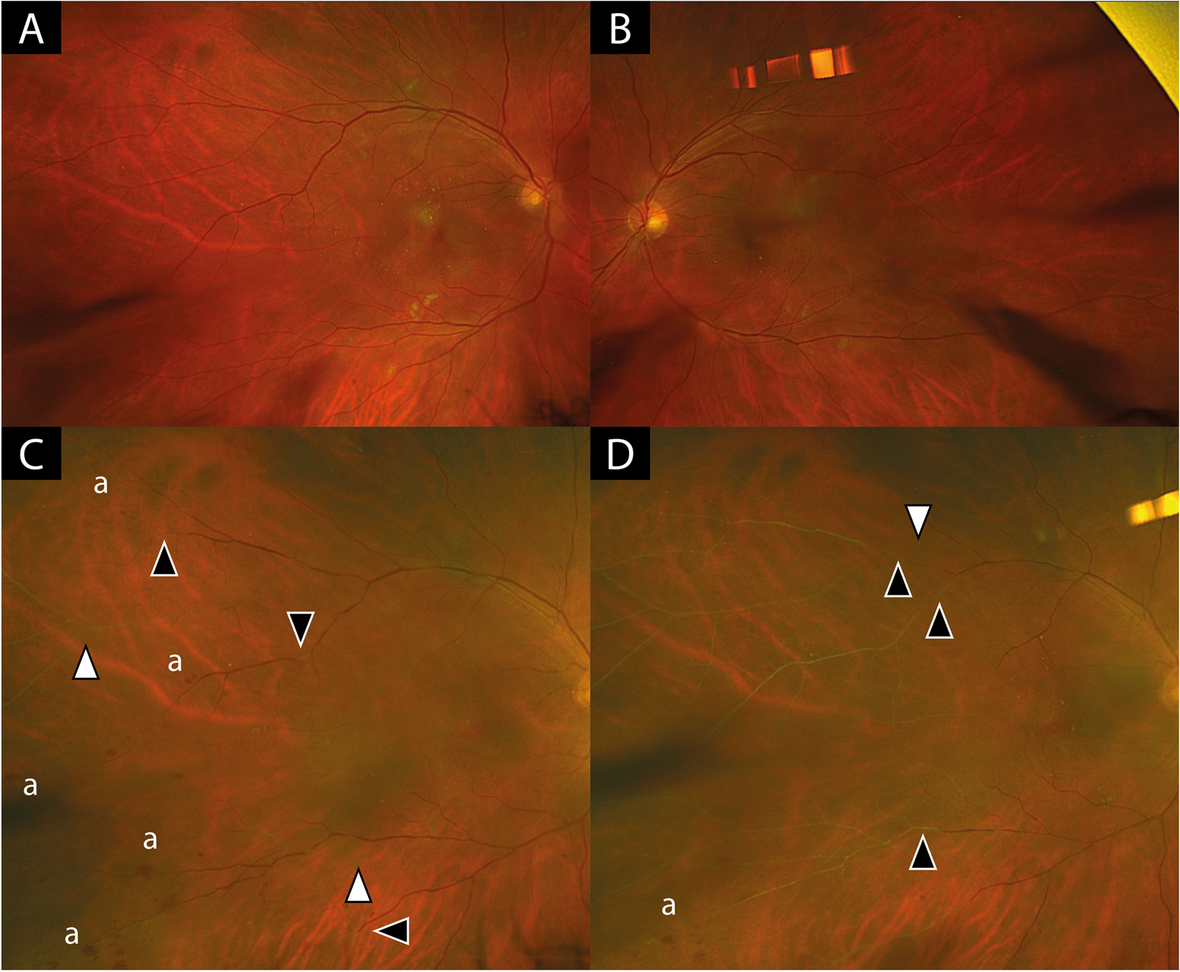
Fig. 1
Widefield-fundus imaging (Optomap P200) of right (A, C, D) and left eye (B). A and B shows fundus imaging at last follow-up 3 months before patient became symptomatic with findings of mild to moderate non-proliferative diabetic retinopathy but no signs of vascular occlusion. C shows fundus image of right eye of patient at presentation with new blot hemorrhages (a) in the temporal periphery, severe attenuation of arterial vessels (white arrow heads) and veins (black arrow heads). D: shows progression of vessel occlusion 4 weeks after initiation of treatment. Arrow heads indicating progression of vessel occlusions compared to C
Fig. 2
Infrared reflectance (IR) images with optical coherence tomography (OCT) scans (Spectralis Heidelberg) of right eye at 3 months before the patient became symptomatic (A), at initial presentation (B) and 4 weeks later (C). White arrow heads denote hyperreflectivity consistent with paracentral acute middle maculopathy (PAMM) as a sign of ischemia in the intermediate and deep retinal capillary plexuses. In the infrared images on the left side dark arrow heads mark the progression of vessel attenuation compared to the previous image
The patient had no history of vascular occlusive disease, a normal coagulation profile, normal blood pressure and no clinical or laboratory signs of giant cell arteritis. Comprehensive retinal vasculitis screening results including chest X-ray, Quantiferon test, serology for Syphilis, Human Immunodeficiency Virus, Hepatitis B/C Virus, cryoglobulins, rheumatoid factor, angiotensin-converting enzyme, antineutrophilic cytoplasmic antibody and antinuclear antibody were all unremarkable. CT-Angiography of the head and neck revealed conventional anatomy, normal opacification and no stenosis of aortic arch, extracranial neck vessels, major intracranial vessels and the ophthalmic arteries bilaterally. Given the diagnosis of an occlusive vasculitis, the patient was treated with oral Prednisolone at 1 mg/kg bodyweight, tapering down at weekly intervals. Despite treatment, after 4 weeks the vascular occlusions had further progressed towards the centre. However, the oral prednisolone therapy was still tapered due to worsening blood sugar levels and instead the right eye received an intravitreal injection of a Dexamethasone implant (Ozurdex). Three weeks later the area of vascular occlusion had stabilized (Fig. 3, C-D) and visual acuity slightly improved to a final visual acuity of 20/40 in the right eye and 20/25 in the left eye.
Fig. 3
Fluorescein angiography in the right (A; at 6 min 39 s) and the left (B; at 3 min 53 s) eye at initial presentation confirming significant ischemia in the right eye, staining of optic discs (#), and fluorescein leakage of retinal veins especially in the left eye (asterisks). Fluorescein angiography 4 weeks after treatment initiation (right—C; at 4 min 6 s and left—D; at 4 min 24 s) shows slight progression of vascular occlusions in the right eye and no occlusions in the left eye
Comments (0)