
Remember me


Dyslipidemia is a metabolic disorder characterized by elevated levels of total cholesterol (TC), low-density lipoprotein cholesterol (LDL-C), and triglycerides (TG), as well as reduced levels of high-density lipoprotein cholesterol (HDL-C).[1] Dyslipidemia is the leading cause of morbidity and mortality worldwide, as they have the potential to impair endothelial function.[2] Although dyslipidemia may not exhibit symptoms at its onset, it can play an important role in cardiovascular diseases such as coronary heart disease and stroke.[2] Increased levels of TC, LDL-C, and TC/HDL-C ratio, along with reduced levels of HDL-C, are strong indicators of coronary heart disease.[3] Furthermore, dyslipidemia was found to be associated with various disorders, such as obesity, hypertension, and type 2 diabetes.[4–6] Zheng et al[7] found that high levels of LDL-C caused 1.47 and 1.41 times more deaths and disability-adjusted life-years globally in 2019 compared to 1990. The rates were higher in males and increased with age, with Eastern Europe having the highest rates. High-income North America, however, experienced a decrease in risk. Moreover, the authors found a positive correlation between the age-standardized rate and the sociodemographic index.
It is important to identify patients who require treatment for dyslipidemia, as the condition typically presents them with no symptoms. All adults above the age of 21, as well as those with additional risk factors, such as a family history of early cerebrovascular diseases (CVDs) and severe dyslipidemia, should undergo a fasting lipid test every 4 to 6 years to screen for dyslipidemia.[8] This test measures levels of TC, triglycerides, HDL-C, LDL-C (calculated using the Friedewald equation or done directly when triglyceride level is below 400 mg/dL), and non-HDL-C.[9,10] The 2018 guidelines from the American Association of Clinical Endocrinologists and American College of Endocrinology suggest that individuals with atherosclerotic CVDs should be placed in the extreme risk category, and their target LDL-C level should be set at 55 mg/dL or lower. In addition, patients with diabetes, stage 3 or 4 chronic kidney disease, heterozygous familial hypercholesterolemia (heFH), or a history of premature atherosclerotic CVDs (men under 55 years, women under 65 years) are also considered to be at high risk.[10]
Saudi Arabia ranks second in the Middle East and seventh worldwide in terms of the prevalence of diabetes mellitus.[11] In Saudi Arabia, research was conducted among individuals aged 30 to 70 years. Out of the 16,917 survey respondents, 4,004 individuals (23.7% of the population) had been diagnosed with diabetes.[12] However, Saudis have a higher prevalence rate of diabetes ranging from 26.0 to 61.8%.[13,14] It is essential to screen for diabetes and its complications including dyslipidemia. The International Diabetes Federation emphasizes lifestyle modifications like increased physical activity and adopting a healthy diet as effective measures to prevent or delay the onset of DM and associated dyslipidemia.[15]
Iron is an essential mineral for human health. However, too much iron can be harmful to the cells and cause disease by promoting oxidative stress and pathogenic catalytic processes.[16] When body consume iron-rich foods, it is absorbed through the small intestine and transported to the tissues that need it through transferrin. Any excess iron is stored as ferritin, which is a clinical biomarker for assessing iron status and controlling iron homeostasis.[17,18] Ferritin is an acute-phase protein that increases when there is tissue injury or inflammation.[19] Elevated iron levels could affect cholesterol levels and worsen cardiovascular disease or increase its risk by increasing pro-inflammatory cytokines, lipid oxidative stress, and other processes.[20] High serum ferritin (SF) levels have been linked to obesity, metabolic syndrome, atherosclerosis, diabetes, dyslipidemia, and cancer.[21,22] Additionally, dietary iron intake affects ferritin levels, and some research suggests that a higher total dietary iron level may be associated with an increased risk of CVDs and cancer mortality.[23]
Li et al[24] examined the link between SF levels and dyslipidemia in American adults. They found that dyslipidemia was highest in the fourth quartile of SF in both males and females. The risk of high TC and high LDL-C increased progressively in both genders, but the risk was higher in females. The study also found a significant association between total daily iron intake and dyslipidemia, and with high-triglycerides dyslipidemia in females.
It is crucial to understand the association between ferritin levels and lipid profile in identifying individuals who are at risk of dyslipidemia and related metabolic disorders. By discovering this association, clinicians can evaluate the cardiovascular risk profile of diabetic patients more effectively and implement targeted interventions to reduce the risk of metabolic syndrome and CVDs. This study aimed to investigate the association between SF levels and dyslipidemia in diabetic patients. Therefore, the primary objective of this investigation was to examine the relationship between SF levels and lipid profile among patients with diabetes, given their increased susceptibility to metabolic syndrome and CVDs. Additionally, we explored differences in ferritin levels among male and female diabetic patients.
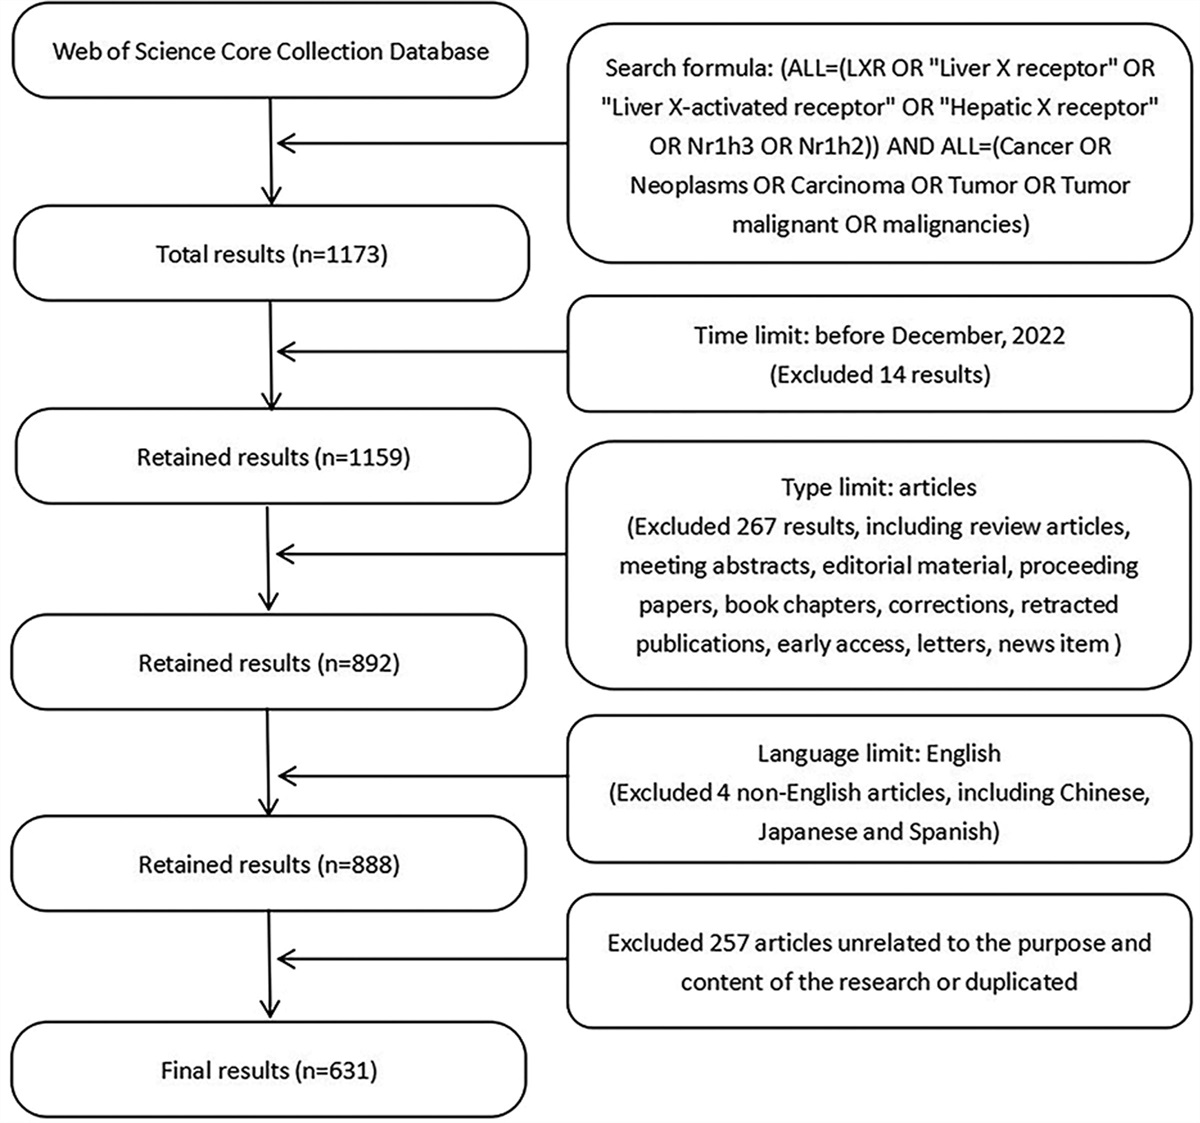
2. Materials and methods 2.1. Study designThis cross-sectional study included electronic medical records of all eligible patients from 2010 to 2020. The data were collected from 3 main locations in Saudi Arabia namely Abha, Khamis Mushyt, and Jeddah. We included adult patients aged 18 years or above with DM as indicated by HbA1c ≥ 6.5. We excluded pregnant females, those patients using antihyperlipemia drugs, and those with high C-reactive protein. The SF and blood lipid values which we utilized in this study were derived from the existing datasets.
2.2. Sample size calculationUsing G*power software, we determined the minimum required sample size to be 3321 based on the following assumptions: a power of 95%, an alpha error of 0.05, the null hypothesis set at 0, and the alternative hypothesis at 0.06. (correlation between SF and lipid profile).
2.3. Studied outcomesThe dependent variable was the lipid profile including cholesterol, triglycerides, LDL, and HDL. The predictors were SF, age, sex, blood pressure, and complete blood picture profile.
2.4. Data collectionFrom the records, we collected the following data: systolic and diastolic blood pressure; complete blood count (platelet count, total leukocytic count, basophils, eosinophils, lymphocytes, monocytes, neutrophils, hemoglobin, red blood cell count (RBCs), reticulocyte distribution width, mean corpuscle hemoglobin, mean corpuscle hemoglobin concentration, mean corpuscle volume) lipid profile (cholesterol, triglycerides, cholesterol/HDL, HDL-C, LDL/HDL, LDL-C), HbA1c %, erythrocyte sedimentation rate (ESR), C-reactive protein, blood urea nitrogen (BUN), blood urea, SF, and serum iron.
2.5. Study confoundersThe potential confounders in this study encompass age, sex, blood pressure, components of the complete blood count, HbA1c %, markers of inflammation (ESR), renal function markers BUN, and serum iron levels. These factors may influence both SF levels and lipid profiles, thereby potentially confounding the association between SF and lipid profile among diabetic patients.
2.6. Statistical analysisWe used R version 4.2 for doing statistical analysis. Categorical variables were summarized using frequencies and percentages, while quantitative variables were described using mean and standard deviation. In cases where the data were skewed, median and interquartile range were utilized instead. Spearman correlation was used to test the correlation between nonnormally distributed data, while Pearson correlation was utilized for normally distributed data. The Kruskal-Wallis test and the Mann–Whitney U test, nonparametric statistical tests, were used to analyze differences between groups when the assumptions of parametric tests were violated. Wilks’ Lambda, a multivariate statistical test, was used to assess the significance of the overall relationship between age, gender, residence, SF (predictors), and the dependent variables (LDL-C, HDL-C, cholesterol, and triglycerides). Levene’s Test of Equality of Error Variances was used to see if the variances of the residuals (or errors) were roughly equal across groups.
2.7. Ethical approvalThis study was conducted under the approval of the ethical committee of King Khalid University (ECM#2021-4405), adhered to stringent ethical standards in accordance with the Declaration of Helsinki. Data analysis was carried out with a commitment to anonymity, where all personal identifiers were carefully removed, and participants’ confidentiality was strictly maintained.
3. ResultsTable 1 presents a comprehensive overview of data collected from a sample of 3674 individuals, categorized by region, gender, and age. Most of the population hailed from Jeddah, comprising 2810 individuals (76.5%), followed by Khamis Mushyt with 544 individuals (14.8%), and Abha with 320 individuals (8.7%). Males constituted 26.6% of the sample, totaling 977 individuals. The mean age of the studied population was 48.2 ± 18.4 years. Table 1 presents various laboratory test findings.
Table 1 - Sociodemographic characteristics of patients with diabetes mellitus (N = 3674). Variables Level Mean ± SD Median [q1–q3] Region Jeddah 2810 (76.5%) Khamis Mushyt 544 (14.8%) Abha 320 (8.7%) Gender Female 2697 (73.4%) Male 977 (26.6%) Age (years) 48.2 ± 18.4 49.0 [35.0–62.0] Blood pressure Systolic (mm Hg) 136.0 ± 20.1 132.0 [121.0–149.0] Diastolic (mm Hg) 78.6 ± 10.3 80.0 [71.0–85.0] CBC Platelet count (×103/μL) 288.2 ± 81.1 279.0 [234.0–331.0] Total leucocytic count (×103/μL) 7.2 ± 2.3 6.9 [5.6–8.5] RBCs (×106/μL) 4.7 ± 0.5 4.7 [4.4–5.1] Hematocrit (%) 38.4 ± 4.2 38.6 [35.9–41.2] Hemoglobin (g/dL) 12.8 ± 1.6 12.8 [11.8–13.9] MCH (pg) 27.1 ± 2.9 27.6 [25.7–29.0] MCHC (g/dL) 33.2 ± 1.6 33.3 [32.2–34.3] MCV (fL) 81.5 ± 7.1 82.5 [78.2–86.0] RDW (%) 14.5 ± 2.0 14.0 [13.2–15.1] Lipid profile Cholesterol (mg/dL) 193.0 ± 46.0 190.0 [160.0–220.0] LDL-C (mg/dL) 121.2 ± 41.7 117.0 [91.0–147.0] Triglycerides (mg/dL) 153.9 ± 84.7 136.0 [101.0–184.0] HDL-C (mg/dL) 49.1 ± 13.2 47.0 [40.0–57.0] Iron profile Serum iron (μg/dL) 70.4 ± 30.1 68.0 [49.2–88.0] Serum ferritin (ng/mL) 88.9 ± 56.4 116.0 [24.0–108.5] Transferrin (mg/dL) 270.9 ± 83.7 265.5 [231.5–301.2] Blood urea nitrogen (mg/dL) 48.2 ± 8.7 49.0 [35.0–48.2] HbA1c 8.8 ± 1.6 8.4 [7.6–9.7]CBC = Complete blood count, HbA1c = hemoglobin A1c, HDL-C = high-density lipoprotein cholesterol, LDL-C = low-density lipoprotein cholesterol, MCH = mean corpuscular hemoglobin, MCHC = mean corpuscular hemoglobin concentration, MCV = mean corpuscular volume, q1 = first quartile, q3 = third quartile, RDW = red cell distribution width.
Table 2 shows that the median [interquartile range] level of SF level was higher among females compared to males 60.0 [23.4–125.8] versus 55.4 [24.0–113.4], however, this difference was not statistically significant P = .204. On the other hand, age and region were significantly associated with SF (P = .032 and 0.035). Interestingly increasing in HbA1c level was significantly associated with SF.
Table 2 - association between serum ferritin and different factors including diabetes control. Variable Level N Median q1 q3 P Region Abha 320 59.5 24.4 140.7 .035* Khamis 544 64.5 25.7 125.0 Jeddah 2810 54.1 23.8 112.9 Sex Female 2697 60.0 23.4 125.8 .204† Male 977 55.4 24.0 113.4 Age (years) 18– 532 53.2 20.5 23.2 .032* 30– 797 49.7 21.1 102.8 40– 555 56.6 23.9 124.0 50– 658 54.3 24.5 117.5 60– 108 58.9 20.6 128.4 70– 61 46.7 163.4 97.6 Above 70 years 407 63.8 27.7 132.0 HbA1c <7 168 48.5 19.6 101.6 .001* 7– 2697 53.8 23.3 110.3 ≥10 809 68.1 29.5 142.2HbA1c = hemoglobin A1c, q1 = first quartile, q3 = third quartile.
*Kruskal-Wallis test.
†Mann–Whitney U test.
Table 3 presents the correlation coefficients (r) and their corresponding P values, indicating the correlations between SF and various other variables. SF showed a weak positive correlation with cholesterol (r = 0.081, P < .001), LDL-C (r = 0.087, P < .001), triglycerides (r = 0.068, P < .001), ESR (r = 0.065, P < .001), and BUN (r = 0.103, P < .001). There was an intermediate positive correlation between SF and serum iron (r = −0.316, P < .001). However, SF showed a statistically negative correlation with HDL-C (r = −0.126, P < .001), platelets (r = −0.190, P < .001), and transferrin (r = −0.426, P < .001).
Table 3 - Correlation between serum ferritin and different laboratory parameters. Age SBP DBP Platelets RBCs WBC Cholesterol LDL chol TG HDL chol Transferrin Hb A1c BUN S. iron ESR Ferritin r 0.019 0.031 0.029 –.190 .040 –0.014 .081 .087 .068 –.126 –.426 .089 .103 .316 .065 P .246 .084 .110 .0001 .015 .387 .0001 .0001 .0001 .0001 .0001 .0001 .0001 .0001 .518BUN = blood urea nitrogen, DSP = diastolic blood pressure, ESR = erythrocyte sedimentation rate, RBCs = red blood cells, SBP = systolic blood pressure, TG = triglycerides.
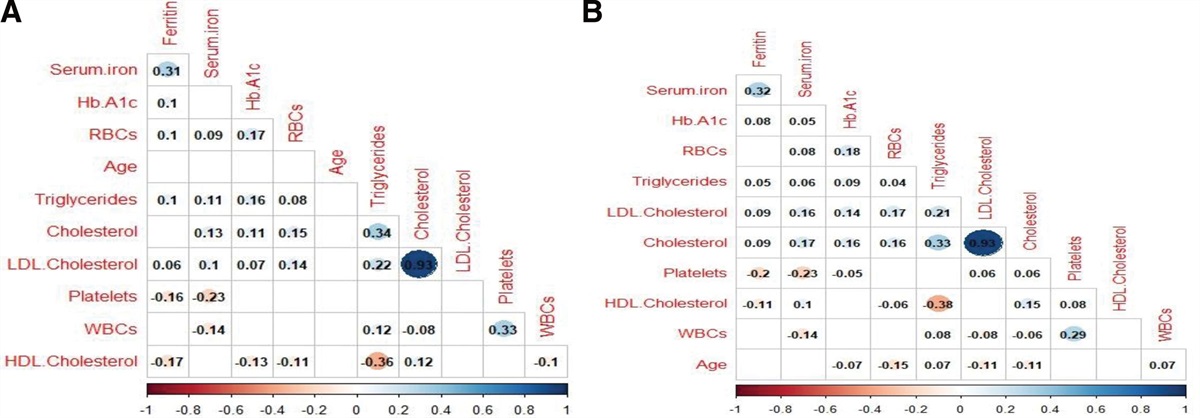
Figure 1 illustrates a significant positive correlation between SF and triglycerides, LDL-C, and TC, alongside a negative correlation with HDL-C, observed across both male and female participants.
 Figure 1.:
 The correlation between ferritin and different lipid profile components among males (A) and females (B).
Among males, SF showed a statistically significant association with triglycerides (r = 0.05), LDL-C (r = 0.09). On the other hand, SF and HDL-C showed negative correlation (r = −0.11) (Fig. 1A). Among females, SF and cholesterol showed a positive correlation (r = 0.09). SF and LDL-C had positive correlation (r = 0.09). Furthermore, SF and triglycerides were positively correlated (r = 0.05). On the other hand, SF and HDL-C had a negative correlation (r = −0.11) (Fig. 1B).
The Wilks’ Lambda test of the overall model is significant (P < .0001), indicating that the overall model is statistically significant. Age, sex, residence, and HbA1c significantly affected the lipid profile (Table 4).
Table 4 - Multivariate analysis of factors associated with lipid profile parameters. Source Dependent variable F P Corrected model Cholesterol 15.678 .0001 LDL cholesterol 13.329 .0001 Triglycerides 9.395 .0001 HDL cholesterol 29.511 .0001 Intercept Cholesterol 1180.668 .0001 LDL cholesterol 524.484 .0001 Triglycerides 93.099 .0001 HDL cholesterol 1333.595 .0001 Age (years) Cholesterol 13.667 .0001 LDL cholesterol 16.944 .0001 Triglycerides 11.686 .001 HDL cholesterol 1.752 .186 Sex Cholesterol 1.206 .272 LDL cholesterol 0.119 .730 Triglycerides 1.16 .281 HDL cholesterol 0.587 .444 HbA1c Cholesterol 63.471 .0001 LDL cholesterol 47.136 .0001 Triglycerides 45.415 .0001 HDL cholesterol 2.323 .128 Ferritin Cholesterol 17.957 .0001 LDL cholesterol 22.604 .0001 Triglycerides 11.633 .001 HDL cholesterol 54.564 .0001 Region Cholesterol 2.252 .105 LDL cholesterol 0.868 .420 Triglycerides 0.373 .688 HDL cholesterol 66.007 .000 Sex × region Cholesterol 1.116 .328 LDL cholesterol 0.42 .657 Triglycerides 0.246 .782 HDL cholesterol 0.262 .770HDL = high-density lipoprotein, LDL = low-density lipoprotein.
In this study, our objective was to assess the association between SF and dyslipidemia among patients with diabetes in Saudi Arabia. SF levels were higher among men compared to women; however, no statistically significant difference was observed across genders. We found a significant positive correlation between all components of the lipid profile (cholesterol, LDL, and triglycerides), with the SF level. Conversely, HDL exhibited a significant negative correlation with SF. Additionally, except for cholesterol level among males, there was a significant association between ferritin and different components of the lipid profile across genders. In multivariate analysis, ferritin emerged as a significant predictor of cholesterol, LDL, HDL, and triglycerides.
4.2. Interpretation of the study findings 4.2.1. Age and sex.SF is widely recognized as a marker of iron reserves in the body and serves as an acute-phase protein, influenced by dietary iron intake.[25] Previous studies have consistently shown that elevated SF is associated with an increased risk of cardiovascular disease.[26,27] Moreover, heightened ferritin levels have been associated with dyslipidemia,[28] elevated blood glucose, fasting insulin levels,[29] and have been identified as a predictor for the development of type 2 diabetes.[30,31] In this study, we found that age was significantly associated with SF. In the same vein, the findings of Cankurtaran et al[32] study suggest that ferritin levels may increase with aging. This is a component of the ongoing asymptomatic chronic systemic inflammatory state known as inflammaging. In our study, despite observing higher SF levels among females, we did not identify a statistically significant association between SF levels and gender. This finding contrasts with the results of a study conducted by Han et al[33] which reported a significant difference in SF levels between male and female diabetic patients. Specifically, the study by Han et al found that SF levels were tripled in male diabetic patients compared to females. This discrepancy in findings may stem from variations in study populations, sample sizes, or other factors influencing SF levels in different contexts. It is essential to consider these factors when interpreting and comparing results across studies.
4.2.2. Diabetes control and ferritin level.We found a significant association between HbA1c, a proxy of diabetes control, and SF. Higher HbA1c levels were significantly associated with higher ferritin levels. This association could imply potential links between glycemic control and iron metabolism, which could be explored further in the context of diabetes management and its complications. Indeed, several studies have suggested a potential association between elevated body iron stores and serum insulin levels[34] as well as glucose levels.[29] These findings imply a possible role of iron metabolism in glucose homeostasis and insulin regulation, which could have implications for conditions such as diabetes and metabolic syndrome.
4.2.3. Dyslipidemia.Dyslipidemia is estimated to account for over one-third of deaths resulting from ischemic heart disease or ischemic stroke in both developed and developing countries.[35] Consequently, we investigated the potential of SF as a preventive indicator for dyslipidemia. Our findings suggest that higher SF levels were more likely to be associated with dyslipidemia in diabetic Saudi adults. The correlation coefficient ranged from 0.068 to 0.128. Higher correlation was reported by Srivastav et al.[36] Similarly, Li et al[37] (0.39 for cholesterol, 0.46 for triglycerides, 0.60 for LDL-C, and −0.60 for HDL) explored the independent relationship between SF levels and dyslipidemia. They used data from the China Health and Nutrition Survey (2009 CHNS). They concluded that the SF level was significantly associated with lipid parameters, regardless of glucose metabolism disorders and components of metabolic syndromes. Likewise Li et al[24] examined the association between SF level and dyslipidemia in American adults. Data from the National Health and Nutrition Examination Surveys before the pandemic (NHANES) were used to analyze the correlation between lipid and SF concentrations. The study found that dyslipidemia was highest in the fourth quartile of SF in both males and females. The risk of high triglycerides was 2.16 times higher in women. SF concentrations were significantly associated with dyslipidemia, and daily dietary iron intake, and it was associated with high-triglycerides dyslipidemia in females. Al Akl et al[
Comments (0)