
Remember me


The incidence of ESKD in the United States has changed substantially over the past four decades. The Medicare End Stage Renal Disease (ESRD) benefit program began on July 1, 1973, with 11,000 patients; by 1979, it had an enrollment of 56,000 patients; and by 2019, there were 809,103 prevalent patients with ESKD in the United States.1,2 The impressive growth of the ESKD population over these decades has substantially affected the nation's health care system and, most importantly, the people and families directly affected by the disease.
A 1984 analysis showed variation in the incidence of treated kidney failure by age, race, sex, and state.3 Americans older than 65 years have the highest rates of ESKD, and the growth in the overall incident count from 1980 through 2019 is partly the result of an aging US population.2,4 Racial disparities in the progression of CKD to ESKD have long been recognized and lead to substantially higher ESKD incidence in marginalized racial and ethnic groups, especially Black Americans.5–7 There have been successes in mitigating disparities, with a decrease in the incidence of diabetes-related ESKD among groups with disproportionately high rates, including Black, American Indian, and Alaska Native people.2,8–10 However, addressing these disparities remains a public health priority.
We sought to gain insight into temporal patterns of KRT initiation over nearly four decades by using a new format to present trends in kidney disease and to define time points of significant change. A specific focus on Black and White male and female patients of different ages could inform our understanding of how racial disparities in ESKD have evolved over time. Inclusion of individuals initiating KRT in their teenage years, where diabetes mellitus and hypertension are not causes of ESKD, expands our understanding of incidence trends across both age and disease types.
Methods Data SourcesWe analyzed United States Renal Data System (USRDS) data from 1980 through 2019 from mandated, validated submissions of the ESRD Medical Evidence Report (Centers for Medicare & Medicaid Services [CMS] form 2728).2,6 Incident ESKD is defined by filing a CMS form 2728, reflecting the physician's decision to enter a patient into KRT care. Death before KRT is not captured as incident disease. In 1980, CMS began requiring form 2728 for all new patients regardless of insurance coverage, even for patients with insurance coverage other than Medicare, thus enhancing completeness of USRDS data collection. We ended the analysis period in 2019, before the onset of the coronavirus disease 2019 pandemic, which had a dramatic effect on mortality among patients with advanced CKD, affected patient and clinician decisions regarding timing of KRT initiation, and thus might have affected our conclusions.11
AnalysisThis study was limited to residents in US states and the District of Columbia. ESKD incidence per 1,000,000 persons was calculated from new cases as the numerator and the corresponding population size on the basis of US Census Bureau data as the denominator, by year, race, and age group defined as adolescent (13–17 years), adult (18–64 years), and older adult (65 years and older). Race-specific incidence curves were fitted to the data using a quadratic polynomial regression model to display changes over decades by age group.
In addition to the incidence of ESKD (i.e., the crude incidence) in each age group, we also generated age-standardized incidence for adults and older adults to consider the changes in age distribution across the broad age range of the 18–64 and ≥65 years groups of the US population over 40 years, on the basis of the age categories used in the USRDS Annual Data Report (ADR) as 18–44 and 45–64 years in adults and 65–74 and 75+ years in older adults (Supplemental Table 1). The direct standardization method was used—for example, age category–specific incidence was weighted according to the age distribution in the 2000 US population, and then age-standardized incidence of ESKD was evaluated. A similar standardization was not performed for adolescents because the distribution of the US population in this narrow age range was considered to be constant, on the basis of ages 13, 14, 15, 16, and 17 (Supplemental Table 1); therefore, this age group did not merit age standardization.
We applied the National Cancer Institute Joinpoint Regression Program Version 4.9.1.0,12 a technique used in many health care analyses, including cancer incidence, surgical trends, and health disparities research.13–16 Joinpoint analysis allows one to describe annual percent change (APC) in incidence rate and to find inflection points and slopes for different time periods.17 The software uses linear spline regression to evaluate APC and determines whether the changes in incidence over time are best described by a straight line or by multiple linear segments. Instead of using preidentified inflection years to define periods of increasing or decreasing incidence of ESKD, the software evaluates the data to identify joinpoints, which are points in time where a statistically significant change in slope occurs using model selection procedures.17 Permutation tests, which shuffle the sampled observations and evaluate the likelihood of the observed sample compared with the possible permutations of the sampled observations, were used with an overall significance level of 0.05 and 4499 permutations (default options) to select the final models.18 To simplify the description of trends, we specified modeling procedures to keep a maximum of two joinpoints (i.e., maximum of three time periods defined by changes in slope).
In addition to estimating the slopes of the time period lines and testing for zero slope (i.e., flat trend or no significant change) for each segment between joinpoints, the software also determines the APC within each linear segment with 95% confidence intervals (CIs) using log-transformed data to describe the relative differences in slope between time periods.19 Incidences are assumed to change at a constant percentage from the previous year within each time period. A significantly positive or negative APC denotes a significant increase or decrease in ESKD incidence, respectively. When comparing the slope of APC between groups, we evaluated the differences using a test for parallelism.20 We assessed the patterns of increasing and decreasing incidence by age group, race, and sex.
Sensitivity AnalysesBecause the age range of adults is broad, we divided that age group into 18–44 and 45–64 years, on the basis of the age categories in USRDS ADR, and fitted race-specific curves that show temporal trends of crude incidence for four groups (13–17, 18–44, 45–64, and 65+ years).
Then, we excluded patients with ESKD of Hispanic ethnicity and repeated the temporal trend analysis to show curves of race–ethnicity-specific crude incidence for three age groups (13–17, 18–64, and 65+ years). Joinpoint analysis was also performed to show the APC slope of age-standardized incidence in non-Hispanic White and non-Hispanic Black populations because many Hispanic people with ESKD are categorized or self-identify as White, despite the marginalization and racism often experienced by the Hispanic community.21
We also performed joinpoint analysis to show the APC slope using the crude incidence data for all groups listed above, and those results are presented in Table 1 and Supplemental Figures.
Table 1 - Joinpoint-defined periods of ESKD incidence per million, by age group and race: United States, 1980–2019 Age Group, yr Period 1 Period 2 Period 3 Years APC Lower CI Upper CI Years APC Lower CI Upper CI Years APC Lower CI Upper CI On the basis of crude ESKD incidence 13–17 Black 1980–1993 5.9a 4.3 7.4 1993–2004 −1.2 −2.9 0.5 2004–2019 −3.6a −4.6 −2.6 White 1980–2001 0.6a 0.1 1.1 2001–2006 3.7 −1.9 9.7 2006–2019 −2.4a −3.3 −1.4 18–64 Black 1980–1993 8.7a 8.2 9.2 1993–2006 1.3a 1.0 1.6 2006–2019 −1.5a −1.8 −1.3 White 1980–1992 6.6a 6.1 7.1 1992–2000 3.4a 2.5 4.2 2000–2019 1.8a 1.7 2.0 65+ Black 1980–1992 13.1a 12.0 14.3 1992–2002 4.1a 3.2 5.0 2002–2019 −1.9a −2.2 −1.6 White 1980–1992 12.7a 11.9 13.5 1992–2002 6.0a 5.3 6.6 2002–2019 −0.9a −1.1 −0.7 On the basis of age-standardized ESKD incidence 18–64 Black 1980–1993 8.9a 8.3 9.4 1993–2005 0.1 −0.3 0.5 2005–2019 −1.7a −2.0 −1.5 White 1980–1993 6.8a 6.3 7.3 1993–2012 1.2a 1.1 1.4 2012–2019 2.0a 1.3 2.6 65+ Black 1980–1992 13.4a 12.2 14.6 1992–2002 4.2a 3.2 5.1 2002–2019 −1.9a −2.2 −1.6 White 1980–1992 13.0a 12.2 13.8 1992–2002 5.9a 5.3 6.6 2002–2019 −0.8a −1.0 −0.6Periods of different incidences from 1980 through 2019 were determined using the Joinpoint Regression Program (Version 4.9.1.0).
Sources: United States Renal Data System and Census data. APC, annual percent change; CI, 95% confidence interval.
Age standardized to 2000 US population.
aStatistically significant increase (positive value) and decrease (negative value) at P value < 0.05.
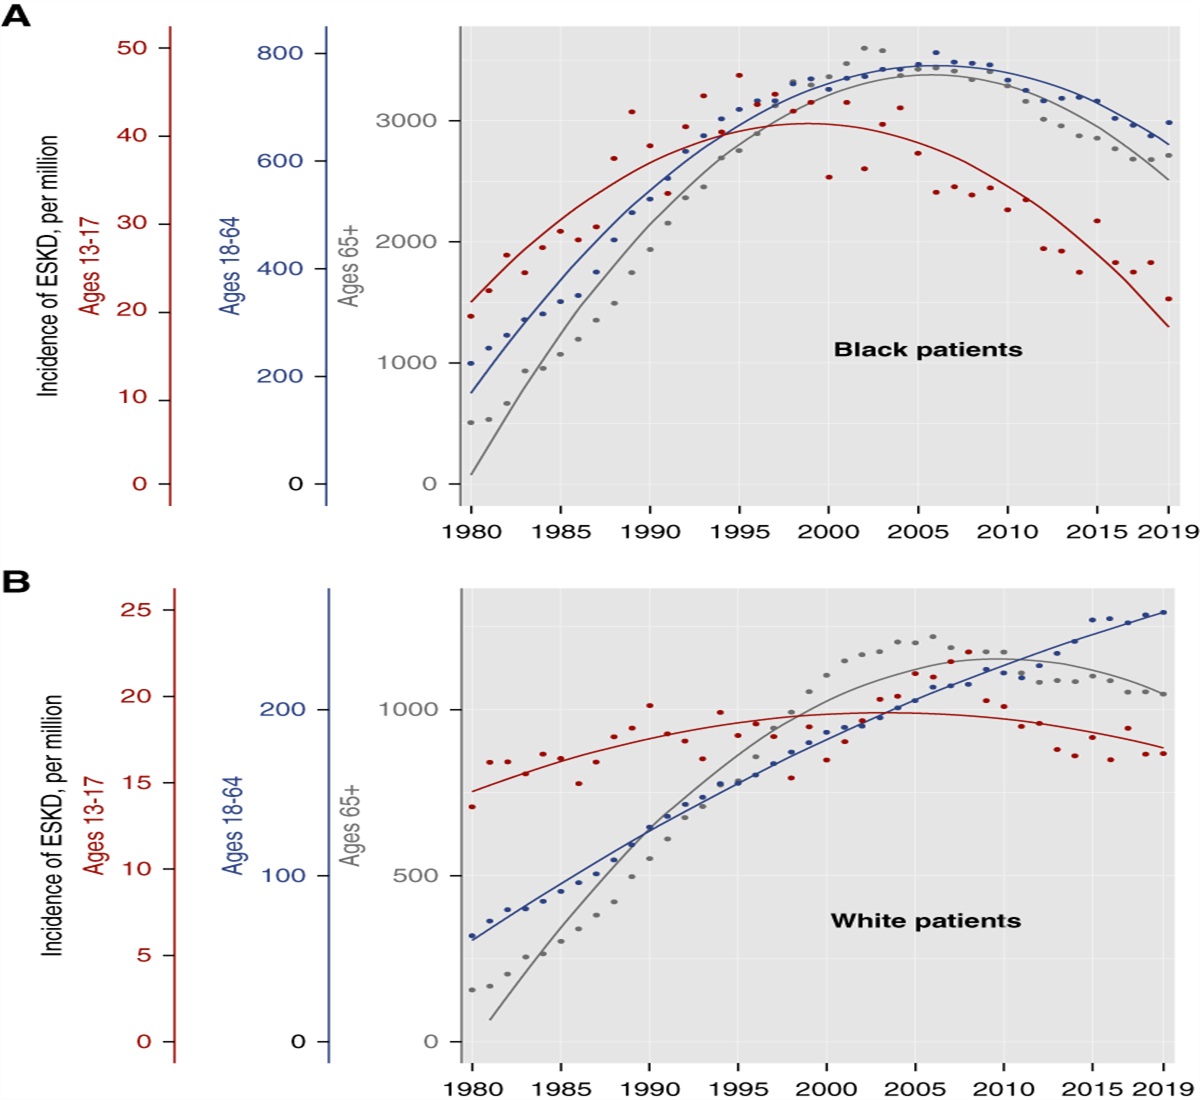
The incidence of ESKD from 1980 to 2019 for Black patients among older adults, adults, and adolescents is shown in Figure 1A and for White patients across these same age groups is shown in Figure 1B (Supplemental Table 2). The incidence of ESKD rose steadily after 1980 for all age groups. The age-standardized rate in Black adults in 1980 was 237.7 per million and peaked in 1998 at 771.8 before declining to 608.5 in 2019. The age-standardized rate in Black older adults was 488 per million in 1980 and rose to 3597.7 in 2002 before declining to 2725.4 in 2019. The rate in Black adolescents in 1980 was 19.3 per million and peaked at 46.9 in 1995 before declining to 21.2 in 2019, close to the 1980 rate.
 Figure 1:
 Trends in crude incidence of ESKD by race and age group: United States, 1980–2019. (A) Trends in incidence of ESKD in Black patients, by age group. (B) Trends in incidence of ESKD in White patients, by age group. Different y axis scales are used to view the trends in different age groups on the same graphs.
The incidence of ESKD among the same age groups of White American patients followed different patterns than for Black American patients (Figure 1B and Supplemental Table 2). White adults had an age-standardized incidence of 66.7 per million in 1980, which continued to rise every year and reached 236.8 in 2019. Older White adults had an age-standardized incidence of 150.1 per million in 1980, which peaked at 1217.4 in 2006, and then declined to 1060.9 in 2019. White adolescents had an incidence of 13.6 per million in 1980 with a very gradual rise after that time and a peak in 2008 of 22.6, falling to 16.7 by 2019.
ESKD Incidence in Black Patients Always Exceeded White Patients in Every Age GroupEvery year, ESKD incidence was substantially greater in Black patients than White patients of every age group as presented in Figure 1 and Supplemental Table 2. The greatest difference in incidence among adults occurred in 1998 when the age-standardized rate in Black adults was 771.8 per million and that of White adults was 178.5, yielding an absolute difference of 593.3, although the ratio of the groups was highest in 1995 at 4.5. By 2019, the difference had fallen to 371.7 and the ratio to 2.6. The narrowing of this disparity in ESKD incidence is because of the decreased age-standardized incidence among Black adults and continued increasing incidence in White adults. The greatest difference in incidence for older adults occurred in 2002, when the age-standardized rate in Black patients was 3597.7 per million and that of White patients was 1163.7, yielding an absolute difference of 2434.0, although the ratio of the groups was highest in 1983 at 3.7. By 2019, the difference had declined to 1664.5 and the ratio decreased to 2.6. The greatest difference in incidence for adolescents occurred in 1995, when the crude rate in Black adolescents was 46.9 per million and that of White adolescents was 17.7, yielding an absolute difference of 29.1, although the ratio of the groups peaked at 2.8 in 1998. By 2019, both groups had decreased incidence rates that were close to those of 1980, with Black adolescents at 21.2 per million and White adolescents at 16.7, such that the absolute difference had fallen to 4.6 and the ratio to 1.27.
Only White Adults Showed No Decline in ESKD Incidence in Any PeriodThe joinpoint analysis of APC is presented in Figure 2 and Table 1, providing more detail on the patterns of age-standardized ESKD incidence. (The patterns of crude incidence by race and age group are shown in Supplemental Figure 1.) Among adults, ages 18–64, there was a clear difference in APC in ESKD incidence between races (P < 0.001) (Figure 2A and Table 1). The age-standardized APC was 8.9 (95% CI, 8.3 to 9.4) among Black adults between 1980 and 1993, which exceeded the APC for White adults at 6.8 (95% CI, 6.3 to 7.3). The growth rate slowed for both groups by 1993, although to a greater extent for Black than White adults. For the period beginning in 2005, Black adults had a declining incidence of ESKD (APC=−1.7, 95% CI, −2.0 to −1.5), whereas increasing incidence continued among White adults (beginning in 2012 APC=2.0, 95% CI, 1.3 to 2.6). While the actual ESKD incidence in Black adults was always much greater than White adults, the difference in their rates has decreased since 1998 because their APCs moved in opposite directions.
 Figure 2:
 Joinpoint analysis of the incidence of ESKD in Black and White patients by age group from 1980 to 2019 expressed as APC for different periods. (A) The trends for White and Black patients age 18–64 are significantly different (P < 0.001). Age standardized to 2000 US population. (B) The trends for White and Black patients age 65+ are significantly different (P < 0.001). Age standardized to 2000 US population. (C) The trends for White and Black patients age 13–17 are significantly different (P < 0.001). APC, annual percent change.
While older adults of both races showed comparable patterns of ESKD incidence in Figure 1 the Joinpoint analysis–defined APC in age-standardized ESKD growth differed between Black and White older adults (Figure 2B and Table 1, P < 0.001). The initial 12 years of steeply increasing incidence for both groups were temporally aligned but were significantly different. The age-standardized APC was 13.4 (95% CI, 12.2 to 14.6) for Black older adults and 13.0 (95% CI, 12.2 to 13.8) for White older adults, followed by a decade of slower growth (APC=4.2, 95% CI, 3.2 to 5.1 for Black people and APC=5.9, 95% CI, 5.3 to 6.6 for White people). In the past 17 years, there was a declining incidence for both groups (APC=−1.9, 95% CI, −2.2 to 1.6 for Black people and APC=−0.8, 95% CI, −1.0 to 0.6 for White people). The differences in actual ESKD incidence remained large but began to narrow beginning in 2002.
There was an increase in ESKD incidence among Black adolescents from 1980 to 1993 shown in Figure 2C (APC=5.9, 95% CI, 4.3 to 7.4), followed by a period of level incidence from 1993 to 2004 (APC=−1.2, not significantly different from 0). This was followed by a declining incidence from 2004 to 2019 (APC=−3.6, 95% CI, −4.6 to −2.6). The change in ESKD incidence among White adolescents was significantly different from that of Black adolescents, lacking the pronounced rise seen in the latter group (P < 0.001, Table 1). White adolescents had almost 20 years of slow increase in ESKD incidence (APC=0.6, 95% CI, 0.1 to 1.1), followed by a 5-year period of level incidence (APC=3.7, but not significantly different from 0). This was followed by a 13-year trend of decreasing incidence (APC=−2.4, 95% CI, −3.3 to −1.4). In both groups, the incidence of ESKD nearly returned to 1980 levels by 2019.
ESKD Incidence Grew Faster in Male Patients and Improvements Were Lesser Compared with Female PatientsThe joinpoint analysis of age-standardized incidence by sex, age, and race showed that, among Black adults (Figure 3A), the periods of rise were steeper and periods of decline were more gradual for male than female patients with significantly different slopes (P < 0.001). In White adults (Figure 3B), male patients have had a greater APC than female patients since 1992, and their incidence continues to diverge from that in female patients (P < 0.001). Neither White adult male nor female patients had a decline in ESKD incidence over the entire 40-year observation period. Among older adults, Black male and female patients have had comparable APCs, although the improvement in ESKD incidence since 2000 has been greater for older Black female than male patients and their incidences are diverging (Figure 3C, P < 0.001). Older White male and female patients have comparable patterns of increasing and decreasing ESKD incidence over the past four decades, although the slopes during each time period differ (Figure 3D, P < 0.001). (The patterns of crude incidence by sex, age, and race are shown in Supplemental Figure 2.) Differences in APC by sex in adolescents were not significant, likely because of small numbers.
 Figure 3:
 Joinpoint analysis of the age-standardized incidence of ESKD in Black male and female patients by age group from 1980 to 2019 expressed as APC for different periods. (A) The trends for Black male and female patients age 18–64 are significantly different (P < 0.001). (B) The trends for White male and female patients age 18–64 are significantly different (P < 0.001). (C) The trends for Black male and female patients age 65+ are significantly different (P < 0.001). (D) The trends for White male and female patients age 65+ are significantly different (P < 0.001). All analyses age-standardized to 2000 US population.
Sensitivity AnalysesWhen the adult data were divided and curves of ESKD incidence were fitted for ages 18–44 and 45–64 (Supplemental Figure 3), there remained a steady increase and then a gradual decrease in ESKD incidence for Black adults in both subgroups, but no decline in ESKD incidence in either subgroup of White adults. The curves were fitted to data after excluding patients who reported Hispanic ethnicity, and the patterns and differences between Black and White patients persisted (Supplemental Figure 4). The joinpoint analysis of crude and age-standardized incidence was repeated for non-Hispanic Black and non-Hispanic White adults, older adults, and adolescents (Supplemental Figure 5, A–D).The APC between groups remained significantly different (P < 0.001).
Joinpoint analysis of periods of crude incidence for adults and older adults are presented in Table 1 and Supplemental Figure 1. There remain significant differences between Black and White adults and Black and White older adults (P < 0.001), and there was no period of declining incidence of ESKD among White adults age 18–64.
DiscussionWe have described temporal trends in ESKD incidence among different age groups and races over almost 40 years. Others have looked at KRT initiation across some of this observation period, but not viewed it over such a broad time horizon, nor analyzed it by race and age.6,22,23 We have documented previously recognized disparities by race but have also shown important differences in incidence trends by age. KRT grew among all groups in the first two decades of our observation period. There was a decline in incidence of ESKD in the latest period among many groups, but we are only able to describe patterns and are limited in our ability to draw conclusions about causation. Thus, we consider our efforts hypothesis generating rather than confirmatory.
The observations among adults (age 18–64) are worthy of reflection. In the first period of observation, 1980–1993, the growth in ESKD incidence of Black adults exceeded that of White adults (Figure 2A and Table 1). However, the growth in incidence among Black adults subsequently slowed and then declined, while incidence in White adults continued to increase. This difference could reflect the difference in competing risks of cardiovascular mortality between Black and White adults, suggesting that greater access to preventive care may have allowed more White patients to survive to KRT. However, the 2023 USRDS ADR shows that a higher percentage of Black and Hispanic patients with CKD stages 3 and 4 than White patients are currently receiving angiotensin-converting enzyme inhibitors and angiotensin receptor blockers.24
Black older adults (>65 years) have substantially greater ESKD incidence than White older adults (Figure 1 and Supplemental Table 1). While the patterns of increasing and subsequently decreasing incidence seem comparable between the two groups and their joinpoints aligned, the test of parallelism showed that the patterns were significantly different (Figure 2B and Table 1). The steep increases in ESKD incidence for both groups from 1980 to 1992 may correspond to changing medical practice and more liberal entry into KRT programs.4,22 The difference in incidence between the two groups remained large even as the rates declined after 2002. Optimistically, the overall improvement and subsequent gradual mitigation of the disparity between Black and White older adults could presage the introduction of effective treatments to delay progression of CKD. However, if increased KRT acceptance rates for older adults have become culturally embedded, then we cannot expect ESKD incidence in Black and White older adults to decline as completely as that of adolescents.
Adolescents comprise a small fraction of the total ESKD population, but their experience can be instructive. During the earliest period of our observation, Black teenagers had a strikingly higher growth in initiation of KRT compared with White teenagers (Figure 2C and Table 1). This difference could reflect secular changes in the common kidney diseases adolescents suffer (congenital anomalies and glomerular diseases, such as systemic lupus erythematosus and focal segmental glomerular sclerosis), but it might also reflect limited access to nephrology care for Black children in 1980 or to general health care in subsequent years,25 resulting in missed opportunities for treatment of underlying diseases or prevention of CKD progression. Black and White teenagers were the only patients to see a decline in ESKD incidence almost to 1980 levels (Figure 1 and Supplemental Table 1).
Our data do not provide an explanation for the changes in ESKD incidence by age and race. Changes in ESKD incidence likely reflect events that occurred well before patients' entry into the ESRD program and could encompass early disease management or extend as far back as prenatal development. After almost two decades of rising incidence of diabetes mellitus, new cases in the United States decreased from 2009 to 2019,26 although the proportion of new patients with ESKD attributed to diabetes has continued to rise.2,6,27 Effective screening and treatment of diabetes-related CKD and proteinuric kidney disease are well recognized; during the period we analyzed, this would mainly have been angiotensin-converting enzyme inhibitor and angiotensin receptor blocker therapy.28–31 Guidelines for evaluation and treatment of CKD were generated for primary care and nephrology communities31–33; however, the inflection points we found do not correspond to the publication of Kidney Disease Outcomes Quality Initiative guidelines in 2002 and 2007, and substantial gaps in implementation have been well documented.34,35 We can only speculate whether these gaps were even wider in prior decades and the decrease in incidence of ESKD in some patient groups (and even the slowing of ESKD growth in White adults) is because of modest improvements in screening and treatment of CKD. Disparities in access to care and treatment may have improved; a recent analysis of insured adults from 2012 to 2019 showed Black patients were more likely to receive guideline-concordant CKD care than White patients.36
We also considered the effect of Medicaid expansion through the Affordable Care Act on preventive care to delay progression of CKD,37 but the change in access to care began in 2014, which falls within period 3 in Table 1. It was not possible to discern an effect of Medicaid expansion in our analysis.
We considered whether changes in KRT initiation were because of clinician and health system behavior, recognizing that patient and clinician decision making was not captured. Acceptance of older adults into dialysis programs has increased,4,22 even as there is growing awareness of conservative (nondialytic) kidney management.38,39
Factors external to medical care could be relevant. There may have been removal or lowered exposure of environmental toxins with an undetermined lag time for effect. Lead, a known nephrotoxin,40,41 was removed from paint in the United States in 1978, but exposure persisted for decades, particularly in aging homes. Lead was ultimately removed from gasoline in 1996 after a 25-year effort by the US Environmental Protection Agency under the Clean Air Act.42 While lead exposure has declined since then, Black children consistently demonstrated higher lead levels than non-Hispanic White children in the National Health and Nutrition Examination Survey from 1999 to 201543 and in an assessment of toddlers residing in Rochester, NY, in 1993.44 The fact that adolescents demonstrated a similar trend of increasing then decreasing ESKD as seen in adults but with an earlier deflection point could be consistent with a shorter lifetime exposure to an environmental toxin that was declining in abundance during the period of observation. Analysis of Global Burden of Disease risk factors showed reductions in CKD rates caused by lead exposure from 2002 to 2016.45
One might consider unrecognized infections as causes or contributors to CKD and its progression to ESKD. We evaluated changes in ESKD incidence due to HIV-associated nephropathy but did not find evidence of sufficient number of cases to affect our findings. Nonetheless, RNA sequencing of kidney biopsies from patients with CKD and nephrotic syndrome or HIV and from healthy transplant donors has shown abundant and diverse microbial RNAs, which differ between glomerular and tubulointerstitial compartments.46 Such observations allow only speculation about silent epidemics that may have changed disease trajectories and ESKD incidence, but do not allow development of conclusions about differences between age groups or races.
There are many reasons to be cautious in our analysis. We relied upon the completeness of reporting through CMS form 2728, but this requirement was initially mandated through Medicare and some patients began dialysis with insurance coverage through private insurers, military health systems, or state Medicaid coverage. While reporting requirements are currently universal, that may have affected the reliability of data from the earliest decades of USRDS. Nonetheless, dialysis facilities have been reporting facility-level incidence counts since 1980, and the enrollment counts and facility counts are consistent. Furthermore, race data on CMS form 2728 may be assigned by someone who completed the form rather than by self-report; race data were missing for only 0.4% of forms.2
We have demonstrated an arc of rising and declining incidence of ESKD over four decades for some age groups and races. The unequal burden of disease among Black American patients is clear in all age groups examined, but some mitigation of disparities can be discerned especially among Black adolescents. We were surprised to see the largest group of Americans, White people aged 18–64 years, had no decline in ESKD incidence despite the improvement found in other age groups and in Black people. It is possible that other age groups and people of Black race benefited more from improving patterns of CKD care or reductions in nephrotoxic exposures or that Black patients may be catching up in access to care and resources the White population had access to in prior decades.
Comments (0)