
Remember me


The transcriptional data of Korean GC immunotherapy cohort and the clinical information of patients were analyzed by limma package (12 patients in the response group and 33 patients in the non-response group). The differential expression genes in response group and non-response group were compared (| LogFC |> 1). The differential gene heat map showed 100 genes with the most significant differences (Fig. 2A), indicating that MIA-RAB4B and LINC01433 were significantly over-expressed in the response group, while ROS1, WIF1 and CYP1A1 were significantly lower in the response group. Next, we further screened the differential expression genes between the two groups and construct a model related to the prognosis of GC. We downloaded GC dataset from TCGA and GEO, and merged them after de-batch processing. Then univariate Cox regression analysis was applied to filter 455 genes related to the prognosis. The genes with HR < 1 were defined as protective genes (47 genes), and those with HR > 1 were defined as risky genes (408 genes). The specific gene sets are shown in Additional file 3: Table S3, and then the two types of genes are analyzed by KEGG enrichment analysis. The results of enrichment analysis are also shown in Additional file 3: Table S3. Protective genes were mainly enriched in immunotherapy-related pathways such as “Response to infereron-gamma”, while risky genes were mainly enriched in immune microenvironment-related pathways such as “extracellular matrix organization” and “extracellular structure organization” (Fig. 2C, D). Then the immune response ssGSEA score was obtained by enriching the two kinds of gene sets by ssGSEA, and the gene model related to prognosis of immunotherapy was constructed. It is found that the prognosis of GC patients with high score was better than those with low score (P < 0.01, Fig. 2B). To verify the reliability of the model, we used GSE66229, GSE26942, GSE26253 and GSE15459 of GEO dataset for external validation. We found that the OS, DFS and progression-free survival (PFS) of GC patients with high score in GSE66229, GSE26942, GSE26253 dataset were significantly higher than those with low score (all P < 0.01, Fig. 3A–G), which further verified that our immune response ssGSEA score could effectively distinguish the prognosis of GC patients. We additionally assessed the prognosis at different TNM stages, and the results are shown in Additional file 5: Fig. S1. In most conditions, our model still showed an eligible predictive effect on patients at different TNM stages.
Fig. 2
Screening of differential expression genes and construction of prognostic model for GC. A Differential gene heat map of response and non-response groups; B The survival curve of high and low risk groups of GC patients obtained by model scoring; C, D Bubble diagrams for KEGG enrichment analysis of protective and risky genes
Fig. 3
Immune response ssGSEA score can predict the OS, DFS and PFS of GC patients. A, B Survival analysis (OS and DFS) between high and low score groups of GC patients in GSE66229; C, D Survival analysis (OS and PFS) between high and low score groups of GC patients in GSE26942; E, F Survival analysis (OS and PFS) between high and low score groups of GC patients in GSE26253; G Survival analysis (OS) between high and low score groups of GC patients in GSE15459
The correlation between immune response ssGSEA score and several known markers for immunotherapyTo further explore the relationship between immune response ssGSEA score and immunotherapy, we downloaded the genomic data of TCGA and sorted out the scores of TMB, MSI and MATH related to the efficacy of immunotherapy. In the immune index of TMB, we can see that the TMB score of the GC patients with higher immune response ssGSEA score was also significantly higher than that of the GC patients with lower scores (P < 0.001, Fig. 4A), indicating that the GC patients with higher scores had more gene mutations and had greater potential for immunotherapy. At the same time, the immune response ssGSEA score of GC patients was positively correlated with the TMB score (R = 0.48, P < 0.001, Fig. 4B). Among the GC patients analyzed in two subgroups, we found that the GC patients with high TMB score and high immune response ssGSEA score had the best prognosis. On the contrary, the GC patients with lower TMB and lower immune response ssGSEA score had worse prognosis (P < 0.001, Fig. 4C). Among the immunotherapy indexes of MSI, the GC patients with higher immune response ssGSEA score had a higher MSI score (P = 0.0059, Fig. 4D). At the same time, the immune response ssGSEA score was positively correlated with the MSI score (R = 0.29, P < 0.001, Fig. 4E), which further indicated that the immune response ssGSEA score was consistent with the related indexes of clinical efficacy of immunotherapy. At the same time, in the double subgroup analysis, the GC patients with high MSI score and high immune response ssGSEA score had the best prognosis, whereas the GC patients with low MSI score and low immune response ssGSEA score had the worst prognosis (P < 0.001, Fig. 4F). In terms of tumor heterogeneity, the GC patients with higher immune response ssGSEA score had lower MATH score (P < 0.001, Fig. 4G), indicating that these patients were not prone to immune tolerance and have a better effect on immunotherapy; at the same time, the immune response ssGSEA score was negatively correlated with the MATH score (R = − 0.093) (R = − 0.093, P = 0.077, Fig. 4H), but with no statistical difference (P = 0.077), which may be due to the limited sample size. In the two-subgroup analysis, the prognosis of GC patients with low MATH score and high immune response ssGSEA score was better, on the contrary, the prognosis of GC patients with high MATH score and low immune response ssGSEA score was the worst (P = 0.035, Fig. 4I).
Fig. 4
The correlations between immune response ssGSEA score and TMB, MSI and MATH scores. A The difference of TMB scores between GC patients with high and low immune response ssGSEA score; B The correlation between immune response ssGSEA score and TMB score; C OS of patients with different TMB score and immune response ssGSEA score; D The difference of MSI scores between GC patients with high and low immune response ssGSEA scores; E The correlation between immune response ssGSEA score and MSI score. F OS of patients with different MSI score and immune response ssGSEA score; G The difference of MATH score between GC patients with high and low immune response ssGSEA score; H The correlation between immune response ssGSEA score and MATH score; I OS of patients with different MATH score and immune response ssGSEA score
Prediction of survival probability of GC patients by nomogramTo evaluate the survival probability of each GC patient, we used GC cohort from TCGA and GSE84437 from GEO to construct a line chart model to predict the survival of GC patients. Multivariate Cox regression analysis was used to screen variables with significant prognosis and clinical significance, including age, sex, T stage, N stage and model score. The detailed score of each variable is shown in the line chart (Fig. 5A). By calculating the score of each variable and calculating the total score, we can predict 1 year, 3 year and 5 year OS of GC patients. At the same time, the calibration curve was used to evaluate the prediction performance of Nomogram, and our prediction calibration curve was close to the standard curve (Fig. 5B–D), indicating that the prediction ability of the line chart was better.
Fig. 5
The construction Nomogram and the calibration curves. A Line chart (including age, sex, T and N stages, risk score); B–D Calibration curves for GC patients with OS of 1-year, 3-year and 5-year
COX7A1 screened by WGCNA and cytoscape analysisTo further screen the molecular markers related to immunotherapy of GC, we used the GC data set from TCGA and GSE84437 from GEO for WGCNA. And β = 4 was selected as the best soft threshold to ensure that the network was scale-free (Fig. 6A). The correlation between the expression of gene set and the classification of gene model related to prognosis of immunotherapy was calculated. The genes under the pink module have the most significant expression correlation in the high and low score groups (| R |= 0.31, Fig. 6B). Therefore, the genes in the pink module were selected for further screening of molecular markers related to immunotherapy, and we used the genes in the pink module to intersect with the previously obtained differential genes, and finally obtained 835 meaningful genes for further screening. As the super-enhancer plays a more and more important role in the occurrence, development and treatment of tumor, we downloaded the super-enhancer gene set from the SEdb website and filter the part belonging to the stomach, and finally obtained 13,218 gastric SEs, and then the corresponding gene expression was extracted from our transcriptome data set. Then, to explore the expression correlation between the SEs and our screened gene set, we analyzed the correlation and set the filtering standard as the absolute value of the correlation coefficient greater than 0.8 (P < 0.0001). Finally, 31 SEs were obtained which were highly related to the expression of our screened gene set (Fig. 6C).
Fig. 6
Construction of gene co-expression network and screening of COX7A1. A The network topology analysis of all kinds of soft threshold used to check the scale-free topology (the adjacency matrix was defined using the soft threshold of β = 4); B The correlation analysis between gene set module and immune response ssGSEA score; C The network map of the correlation between the SEs and the screened gene drawn by Cytoscape; D The differential expression of COX7A1 between GC patients with high and low immune response ssGSEA score; E The difference of OS between groups of high and low expression of COX7A1 in TCGA + GSE8443; F The difference of OS between groups of high and low expression of COX7A1 in GSE15459; G The difference of OS and DFS between groups of high and low expression of COX7A1 in GSE84437; H The difference of OS and DFS between groups of high and low expression of COX7A1 in GSE262537
The correlation between COX7A1 and immune response ssGSEA score and its survival analysisBased on our review of the literature, we selected COX7A1 for further analysis due to its high expression in the gene set of interest. COX7A1, a key component of cytochrome oxidase, plays a crucial role in the energy metabolism of tumor cells, making it our focus of study. We found that the lower immune response ssGSEA score, the higher the expression of COX7A1, and there was a significant statistical difference between them, which was verified in three data sets, namely GSE66229, GSE26253 and TCGA + GSE84437 (all P < 0.001, Fig. 6D), showing the reliability of further screening molecular markers through our immune response ssGSEA score. To verify whether the COX7A1 expression has the same effect on the OS and DFS of GC patients as our immune response ssGSEA score, we performed survival analysis of COX7A1. As we expected, in TCGA + GSE84437 and GSE15459 datasets, the OS of GC patients with high expression of COX7A1 was significantly worse than those with low expression of COX7A1 (both P < 0.001, Fig. 6E, F). In GSE66229 and GSE26253 data sets, the OS and DFS of GC patients with high expression of COX7A1 were worse than those with low expression of COX7A1 (all P < 0.05, Fig. 6G, H).
High expression of COX7A1 leads to chemotherapy resistance of 5-Fu and oxaliplatinThen, to further explore the correlation between the COX7A1 expression and the drug sensitivity of commonly used chemotherapeutic drugs in GC patients, we calculated the drug sensitivity scores of TCGA + GSE84437, GSE26253, GSE15459 and GSE66229 using oncoPredict package, and reached a consistent conclusion, that is, in GC patients with high expression of COX7A1, the drug sensitivity of GC patients to 5-Fu and Oxaliplatin decreased; on the contrary, GC patients with low expression of COX7A1, drug sensitivity to 5-Fu and Oxaliplatin increased (all P < 0.001, Fig. 7A–D), suggesting that those patients with low expression of COX7A1 can choose 5-Fu or Oxaliplatin-based chemotherapy, while others should avoid using these two drugs with little clinical efficacy.
Fig. 7
The correlation between the COX7A1 expression and the drug sensitivity to 5-Fu and Oxaliplatin in A TCGA + GSE84437, B GSE66229, C GSE15459 and D GSE26253
COX7A1 regulates tumor infiltration of immune cells and then affects the immune microenvironmentTo further explore the relationship between COX7A1 and immunotherapy in GC patients, we used cibersort deconvolution algorithm to calculate the content of 22 kinds of immune cells in GC patients with TCGA + GSE84437, GSE66229 and GSE26253 data sets, and calculated the correlation between the expression of COX7A1 and the content of these immune cells. We found that in the three data sets, the COX7A1 expression was negatively correlated with the content of activated memory CD4+ T cells and positively correlated with the content of resting memory CD4+ T cells and resting mast cells (partly P < 0.05, Fig. 8A–C). At the same time, the COX7A1 expression was negatively correlated with the content of M1 macrophages (P = 0.006), and positively correlated with the content of M2 macrophages (partly P < 0.05, Fig. 8D, E). This may explain the poor prognosis of patients with high expression of COX7A1 from the perspective of macrophages, which needs to be further verified in basic cell experiments. To further explore the immune microenvironment of GC patients, we additionally applied the ESTIMATE algorithm to calculate the Immune Score and Stromal Score, and it was found that those patients with high expression of COX7A1 were associated with higher Immune Score and Stromal Score, indicating their poor prognosis (Additional file 5: Fig. S2). Additionally, based on single-cell data, it is found that the COX7A1 expression was positively correlated with the content of Fibroblasts and Endothelial cells (Additional file 5: Fig. S3).
Fig. 8
Analysis of the correlation between the COX7A1 expression and the content of tumor infiltrating immune cells. The correlation between the COX7A1 expression and the content of A resting CD4+ memory T cells, B activated CD4+ memory T cells, C resting mast cells, D M1 macrophages and E M2 macrophages
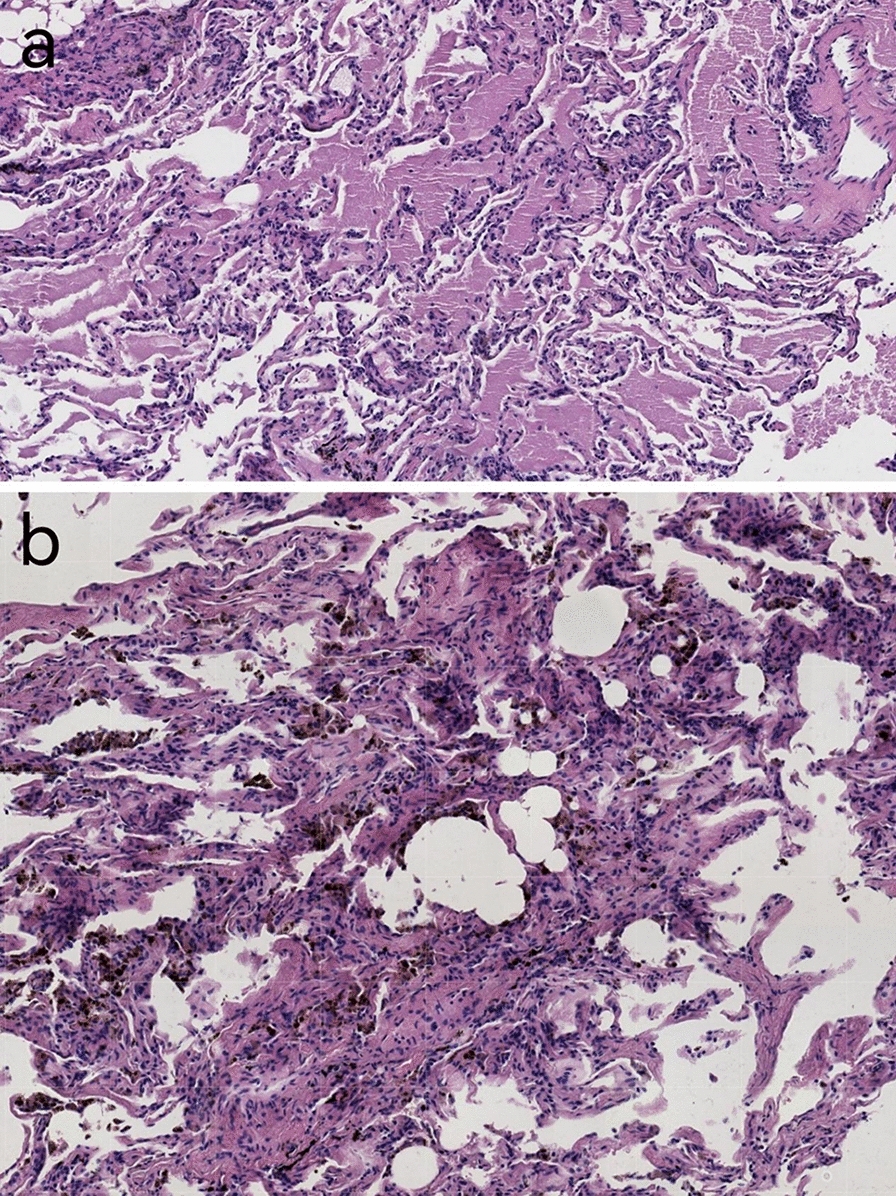
Low expression of COX7A1 in tumor tissues may promote the invasion and metastasisTo further explore the role of COX7A1 gene in gastric cancer, pathological sections and immunohistochemical staining of tumor and paracancerous area were performed in 170 GC patients in Sun Yat-sen University Cancer Center. The clinical information of the patients is detailed in Table 2 (SYSUCC Cohort). Through the analysis of immunohistochemical data, we found that the expression of COX7A1 in tumor tissue was significantly lower than that in paracancerous tissue (both P < 0.001, Fig. 9A). At the same time, we also reached a consistent conclusion in public data in TCGA and GSE66229 (both P < 0.001, Fig. 9B), that is, COX7A1 was significantly lower in tumor tissues than in paracancerous and normal tissues. And through the immunohistochemical image, COX7A1 protein was mainly concentrated in the normal glandular area, and the expression was very low in the cancerous tumor glands (Fig. 9C). Then, in the analysis of COX7A1 and clinical information, we found that the expression of COX7A1 was higher in elderly patients (over 56 years old) and gastric cancer patients whose tumors invaded the whole layer of gastric wall (both P < 0.05, Fig. 9D), indicating that COX7A1 may be related to the invasion and metastasis of gastric cancer patients. On the other hand, there was no significant difference between COX7A1 and vascular tumor thrombus, lymph node metastasis, nerve invasion, differentiation and staging (Additional file 5: Fig. S4A–E). Then, using the follow-up data, we found that GC patients with higher expression of COX7A1 had shorter OS and DFS (both P < 0.05, Fig. 9E) than patients with low expression. To further explore stage-specific patterns, we additionally investigated the influence of COX7A1 on prognosis by TNM stage (Additional file 5: Fig. S5), showing acceptable prediction value. Due to the obviously limited number of patients in stage I, we grouped stage I and II together, and stage III and IV together. Furthermore, among these patients, through multivariable Cox regression analysis, COX7A1 was considered to be an independent prognostic factor for OS and DFS (both P < 0.05, Additional file 4: Table S4). Finally, in our Immune Cohort, those GC patients with higher expression of COX7A1 had shorter OS and DFS (Additional file 5: Fig. S6); and COX7A1 in patients with TRG 2 or 3 was higher than that in patients with TRG 0 or 1 (P = 0.073, Wilcox. test) (Additional file 5: Fig. S4F), but there was no significant difference between the two groups, which was considered to be the reason for the insufficient sample size.
Table 2 Baseline characteristics of the 170 GC patients with immunohistochemistry data from Sun Yat-sen University Cancer CenterFig. 9
The Correlation between differential expression of COX7A1 and clinical information. A The differential expression of COX7A1 between tumor tissues and normal tissues of GC patients; B The COX7A1 expression in tumor tissues and normal tissues in TCGA and GSE66229; C Immunohistochemical map of tumor tissues and normal tissues of GC patients (5 × microscope); D The correlation between COX7A1 expression with the age and the depth of pathological invasion in GC patients; E The correlation between COX7A1 expression with OS and DFS in GC patients
Comments (0)