Data collection and processing
Level 3 HTSeq-FPKM format RNA-seq data and corresponding clinical information were retrieved from the ALL (pan-cancer) project within The Cancer Genome Atlas (TCGA) (https://portal.gdc.cancer.gov/). The RNA-seq data in FPKM format were log2-transformed for analysis. Specifically, RNA-seq data for Liver Hepatocellular Carcinoma (LIHC) and its clinical information were extracted for subsequent R package analysis.
PDCL3 expression analysis
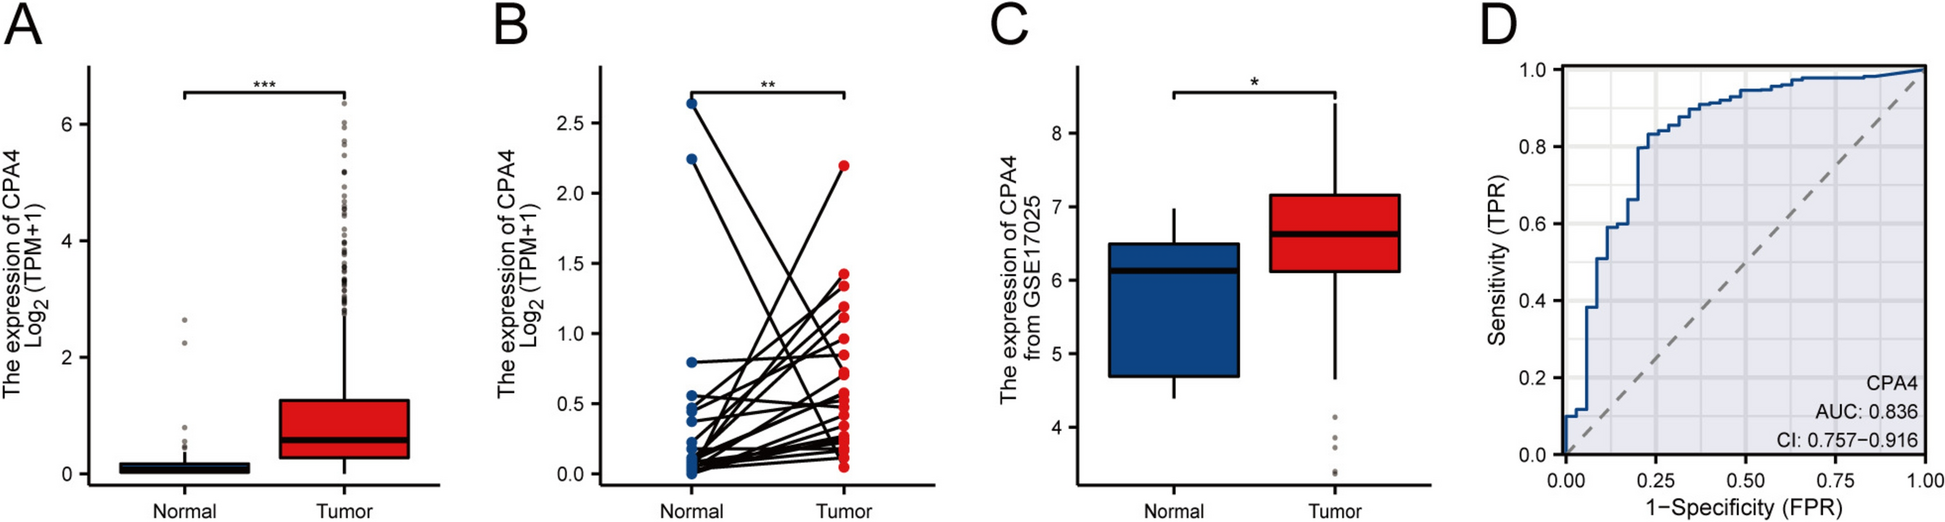
PDCL3 expression in multiple tumor tissues and adjacent normal tissues was analyzed using various databases, including TIMER 2.0 (http://www.cistrome.shinyapps.io), Gene Expression Profiling Interactive Analysis (GEPIA) (http://gepia.cancer-pku.cn/detail.php), and UALCAN (http://ualcan.path.uab.edu). RNA-seq data (Level 3) and corresponding pan-cancer clinical information were obtained from TCGA (https://portal.gdc.com). Statistical analysis was conducted using R software version 4.0.3 and ggplot2 (version 3.3.2). A p value less than 0.05 was considered statistically significant. To validate the differential expression of PDCL3 in normal and liver cancer tissues, Immunohistochemistry (IHC) images downloaded from the Human Protein Atlas (HPA) (http://www.proteinatlas.org) for normal and tumor tissues of liver cancer samples were analyzed.
Prognostic analysis
We utilized the GEPIA database to analyze the survival prognosis of relevant tumors. Additionally, clinical information extracted from TCGA databases for the respective tumors was analyzed for survival prognosis. Kaplan–Meier survival curves, including overall survival (OS), progression-free survival (PFS), recurrence-free survival (RFS), and disease-specific survival (DSS), were plotted using the Kaplan–Meier Plotter (http://kmplot.com). Time-dependent receiver operating characteristic (ROC) analysis was performed to compare the predictive accuracy and risk score of the PDCL3 gene. Bar charts were created using the “rms” package to predict the 1-year and 3-year overall recurrence rates. Forest plots provided graphical results of these factors for calculating individual prognosis risk based on the score associated with each risk factor.
Immune infiltration analysis
The relationship between PDCL3 expression and immune infiltration in hepatocellular carcinoma was analyzed using the TIMER2 tool. We evaluated the gene expression's association with immune infiltration using various algorithms, including TIMER, TIDE, CIBERSORT, CIBERSORT-ABS, QUANTISEQ, XCell, MCP Counter and EPIC algorithms. Reliable immune score evaluations were conducted on data extracted from TCGA databases using the R package Immunedeconv, which integrates six advanced algorithms: TIMER, xCell, MCP-counter, CIBERSORT, EPIC, and quanTIseq. Systematic benchmarking of these algorithms showed their unique performance advantages. Genes such as SIGLEC15, TIGIT, CD274, HAVCR2, PDCD1, CTLA4, LAG3, and PDCD1LG2 were related to immune checkpoint genes. The expression of these eight genes was assessed to evaluate the expression of immune checkpoint-related genes. All these analyses were implemented using R (v4.0.3) software packages ggplot2 and pheatmap.
PDCL3-related enrichment analysis
We employed Gene Ontology (GO), Kyoto Encyclopedia of Genes and Genomes (KEGG), and Gene Set Enrichment Analysis (GSEA) to predict the biological pathways and molecular functions associated with PDCL3 in liver cancer, elucidating the oncogenic roles of target genes. LIHC data extracted from TCGA based on PDCL3 expression were processed and divided into high expression and low expression groups. Differential expression analysis was conducted, and volcano plots were generated for both groups. Enrichment analysis was performed on the differentially expressed genes (DEGs). All these analyses were conducted using R (v4.0.3) software packages ggplot2 and pheatmap.
Reagents and instruments
Microplate Reader (Thermo Fisher, USA); ChemiDoc Imaging System (BIORAD, USA); Reverse Transcriptase (Wuhan Miaoling Biotechnology Co., Ltd.); RIPA Lysis Buffer, BCA Protein Assay Kit (Shanghai Epizyme Biotechnology Co., Ltd.); ECL Chemiluminescent Substrate (Milipore, USA); Cell Counting Kit8 Cell Proliferation Assay Kit (Suzhou UElandy Biotechnology Co., Ltd.); Crystal Violet Staining Solution (Shanghai Beyotime Biotechnology Co., Ltd.); Transwell Chambers (Corning, USA); Rabbit Anti-Human PDCL3 Monoclonal Antibody (Proteintech, USA); Mouse Anti-Human GAPDH Polyclonal Antibody (Proteintech, USA); HRP-conjugated Goat Anti-Rabbit IgG Secondary Antibody (Shanghai Beyotime Biotechnology Co., Ltd.); HRP-conjugated Goat Anti-Mouse IgG Secondary Antibody (Shanghai Beyotime Biotechnology Co., Ltd.)
Clinical sample collection
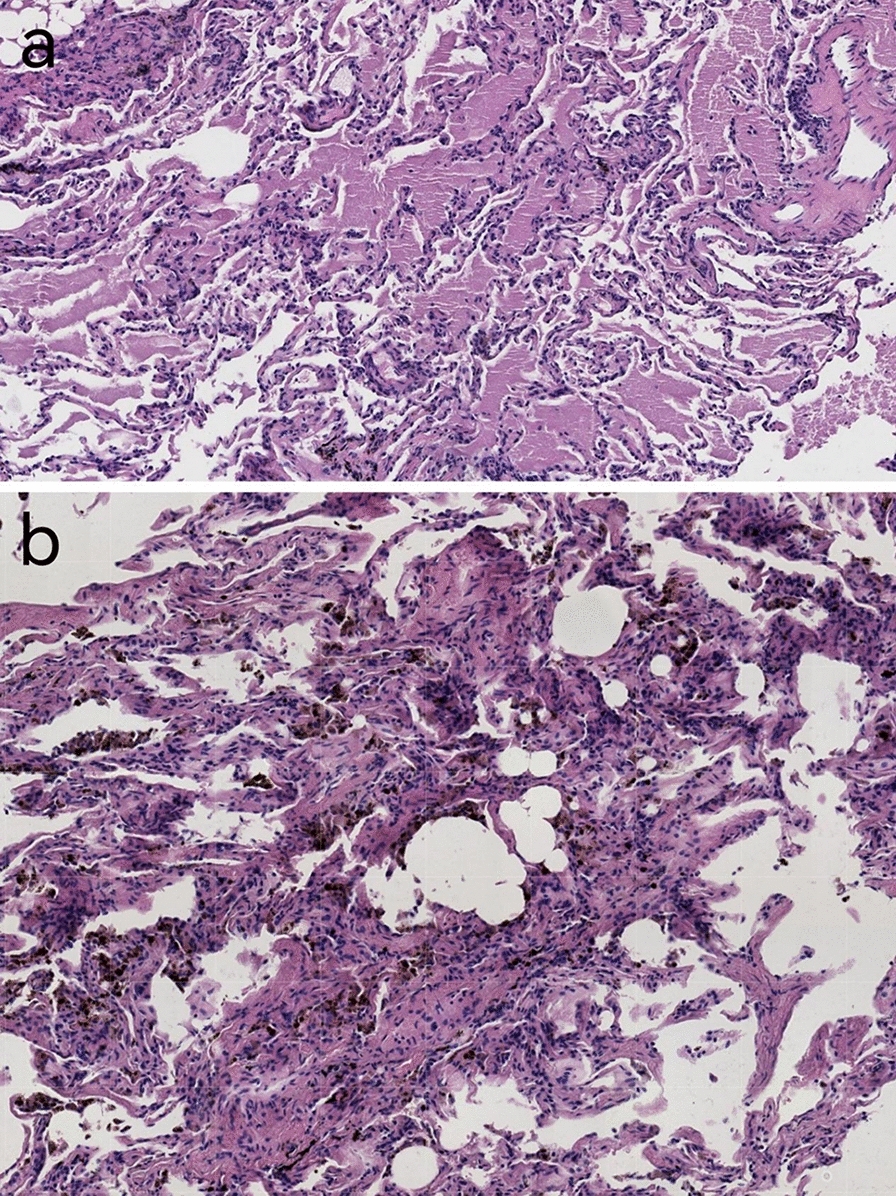
Hematoxylin–eosin (HE) stained slides and paraffin-embedded histological samples were retrospectively collected from 46 liver cancer patients who underwent liver resection at Fudan University Affiliated Pudong Hospital between January 1, 2016, and December 31, 2022. None of the patients had received radiotherapy or chemotherapy prior to the surgery. Tissue microarrays (TMA) were constructed from these samples, including 46 primary liver hepatocellular carcinoma tissues and matched adjacent normal liver tissues. The study was approved by the ethics committee of Fudan University Affiliated Pudong Hospital, and written informed consent was obtained from all patients.
Cell culture and transfection
Human liver cancer cell lines HepG2, Hep3B, 97-H, Huh-7, and the human liver immortalized cell line THLE-2 originated from the Chinese Academy of Medical Sciences Cancer Cell Repository. These cells were cultured in DMEM containing 10% fetal bovine serum (FBS) and maintained in a cell culture incubator at 37 °C with a CO2 concentration of 5%. Cell growth and confluence were observed under a microscope, and when confluence reached 80–90%, cells were passaged at a ratio of 1:4. Stable cell lines were constructed using a retrovirus as a vector.
Immunohistochemistry and immunofluorescence
For immunohistochemistry, tissue cores underwent sequential steps of deparaffinization, rehydration, blocking, antigen retrieval, and cooling to room temperature. Primary antibodies were applied, followed by overnight incubation at 4 °C. Subsequently, secondary antibodies were added, followed by three washes with PBS. DAB staining, counterstaining, and fixation were performed. Five random fields were selected under a microscope, and the presence of brown particles in the cell nucleus and cytoplasm was defined as positive. The percentage of positive cells was scored as follows: 0 (no positive cells), 1 (< 25% positive), 2 (25–50% positive), 3 (50–75% positive), and 4 (> 75% positive). The Immunoreactive Score (IRS score) was calculated as = staining intensity multiplied by the percentage of positive cells [8]. The H-score was calculated as the sum of (percentage of weak staining × 1) + (percentage of moderate staining × 2) + (percentage of strong staining × 3) [9, 10].
For immunofluorescence, tissue cores were immersed in deacetylation solution for 30 min, followed by ethanol dehydration in a graded series. The slides were then immersed in antigen retrieval solution and microwaved for 25 min, followed by cooling to room temperature. Tissue sections were blocked with a solution containing 5% goat serum at room temperature for 1 h. Primary antibodies were added and incubated overnight at 4 °C. Secondary antibodies were added and incubated for 1 h at room temperature. DAPI solution was used for staining for 20 min before mounting the slides.
Western blot
Following transfection, cells from the knockdown group, overexpression group, and control group were cultured in a six-well plate until they reached 100% confluence. Protein extraction was performed using high-intensity RIPA lysis buffer, followed by centrifugation at 12,000 rpm for 20 min at 4 °C to collect the supernatant. The protein concentration was quantified using the BCA method. Proteins were separated by SDS–PAGE electrophoresis at a constant voltage of 120V for 90 min. Subsequently, proteins were transferred onto a PVDF membrane with a pore size of 0.45 μm using a wet transfer system at a constant current of 400 mA for 60 min. The PVDF membrane was then blocked with 5% skimmed milk (diluted in TBST, Tris-buffered saline with Tween 20) for 1 h at room temperature. Primary antibodies against rabbit anti-human PDCL3 (1:1000) and β-tubulin (1:1000) were added and incubated. After incubation, the PVDF membrane was washed with TBST for 5 min, repeated three times. HRP-conjugated secondary antibodies (1:3000) were then added and incubated for 1 h at room temperature. The membrane was washed with TBST for 5 min, repeated three times. ECL luminescent reagent was applied, and the membrane was exposed using a gel imaging system in a light-protected environment. The protein bands of interest were analyzed using Image J software.
Cell viability assay
Transfected knockdown, overexpression, and control cells were seeded in a 96-well plate at a density of 3000 cells per well. Each well was supplemented with 100 µl of complete culture medium. After 24, 48, and 72 h of incubation, the original culture medium was removed, and 100 µl of DMEM medium containing 10% CCK-8 reagent was added to each well. The cells were then incubated in a light-protected environment at 37 °C with 5% CO2 for 1 h. Absorbance at 450 nm was measured using a microplate reader. The cell proliferation rate was calculated using the formula:
$$}\;}\;} =\, \left( }\;}\;} - }\;}\;}} \right)/\left( }\;}\;} - }\;}\;}} \right) \times 00\% .$$
Transwell invasion analysis
Transwell chambers were placed in a 24-well plate, and 100 µl of Matrigel was evenly coated on the upper chamber. The chambers were allowed to stand for 2 h in a cell culture incubator. Transfected cells were harvested, digested, and centrifuged. The cells were resuspended in DMEM medium (density of 2.5 × 10⁵ cells/ml). Subsequently, 200 µl of cell suspension was added to the upper chamber, and 500 µl of DMEM medium containing 10% fetal bovine serum was added to the lower chamber. The cells were incubated in a cell culture incubator at 37 °C with 5% CO2 for 48 h. After removing the culture medium, cells were fixed with 4% paraformaldehyde solution at room temperature for 20 min. They were then stained with 1% crystal violet dye for 20 min. After washing with PBS, pictures were taken under a microscope, and the invaded cells were counted.
Cell migration assay
Transfected cells were seeded in a six-well plate at a density of 5 × 10⁵ cells per well. When the cells reached 100% confluence, the culture medium was removed. Using a 200 µl pipette tip, a vertical scratch was made at the bottom of the six-well plate. The plate was washed with PBS three times, and then DMEM medium containing 2% fetal bovine serum was added. Images of the cell scratch were captured at 0, 24, and 48 h under a microscope. Cell migration rate was calculated using the following formula:
$$}\;}\;} =\, \left( }\;}\;}\;}\;0\,} - }\;}\;}\;}\;\;}\;\,}} \right)/}\;}\;}\;}\;0\,} \times 00\% .$$
Cell colony formation assay
Transfected cells (500 cells/well) were seeded in a six-well plate and incubated at 37 °C with 5% CO2 in a cell culture incubator for 10 days. The culture medium was removed, and cells were fixed with 4% paraformaldehyde solution at room temperature for 20 min. Then, cells were stained with 1% crystal violet dye for 20 min. After washing with PBS and drying, digital camera images were taken, and the number of cell colonies formed was counted.
Statistical analysis
Million transcripts per million (TPM) values were standardized by log2 transformation (1 + TPM). The t test was used for comparing two groups. ROC curves were plotted, and the area under the curve (AUC) was calculated using the R package “ROCR.” Kaplan–Meier (KM) estimates and the log-rank test were used for survival analysis. All statistical analyses were performed using R software (v4.0.3). Spearman correlation analysis was used to assess the statistical correlation between two variables. Normally distributed continuous data were presented as mean ± standard deviation (\(\overline \pm s\)). Chi-squared tests were used for analyzing categorical data. A p value of < 0.05 was considered statistically significant.


Comments (0)