
Remember me


Stroke, encompassing both ischemic and hemorrhagic forms, stands as the most prevalent neurological ailment and rank a leading cause of death and disability, making stroke prevention a global health priority.[1,2] Notably, China confronts an unparalleled stroke challenge, grappling with over 2 million fresh cases annually. This ailment is entwined with the highest disability-adjusted life-years toll among all afflictions within China.[3–5] In 2019, there were 3.94 million (95% uncertainty interval 3.43 ~ 4.58) new stroke cases in China.[6] Forecasts indicate that this burden will burgeon, fueled by population aging, a persistent prevalence of risk factors, and suboptimal management.[7–9] Despite enhancements in overall healthcare accessibility, specialized stroke care availability remains erratic nationwide.[10] Identifying risk factors linked to protracted recuperation following stroke could enhance our comprehension of the convalescence process, potentially steering the quest for treatment targets and precursors predicting stroke outcomes.
Predicting functional outcomes in stroke presents a formidable challenge, largely owing to the intricate nature of the condition.[11] Consequently, we conducted a comprehensive examination of clinical peripheral blood samples extracted from stroke patients. Our objective was to uncover correlated risk factors linked to 90-day outcomes, as evaluated through the mRS. It is conceivable that certain among these factors could potentially serve as valuable tools for prognosticating functional recovery following a stroke. Furthermore, specific factors might emerge as potential targets for enhancing stroke outcomes.
Many studies have found the influence of factors such as age, gender, smoking, and alcohol consumption on stroke prognosis. A thorough examination of 39 research studies, encompassing a collective participation of 359,783 individuals, unveiled a notable disparity in the prevalence of diabetes between ischemic strokes (IS) (33%, 95% CI ~ 28–38) and hemorrhagic strokes (26%, 95% CI ~ 19–33). Furthermore, the analysis established a clear association between both acute hyperglycemia and diabetes and adverse post-stroke outcomes, whether ischemic or hemorrhagic. These unfavorable consequences encompass a heightened mortality risk, compromised neurological and functional recovery, prolonged hospital stays, increased readmission rates, and an augmented likelihood of experiencing stroke recurrence.[12] Someeh et al[13] achieved the best model results using a neural network classification algorithm. Their findings indicated that smoking, low education, advanced age, lack of physical activity, and a history of diabetes were significant risk factors for stroke mortality. Comparatively, younger stroke survivors demonstrate slightly more pronounced advancements in their functional abilities than their older peers. Nonetheless, it crucial to recognize that factors such as initial admission scores hold a more decisive influence, and the pace of recovery may eventually align.[14] It worth highlighting that younger patients exhibit a higher likelihood of achieving mRS scores of 0 to 1 or 0 to 2 during follow-up assessments.[15,16] An investigation focused on the impact of stroke on women unveiled that post-stroke, females manifest a diminished quality of life in contrast to males. This divergence can be ascribed to variables including older age, instances of more severe stroke, existing dependency prior to the stroke event, and the existence of depression.[17] The female gender was associated with an unfavorable prognosis, emphasizing the potential need for intensified acute care measures to improve outcomes among women affected by strokes.[18,19] Positive results were noted among younger patients, whereas a less optimistic prognosis was linked to cases of cardioembolic strokes.[20] Tento et al[21] discovered that female patients over 60 years with hypertension, atrial fibrillation, and hemorrhagic stroke were more likely to progress from a good prognosis to a poor one in the first 3 years of follow-up. Active identification of controllable risk factors like smoking and lack of exercise could help reduce the risk of stroke and recurrence in patients with type 2 diabetes and hypertension. Samuthpongtorn et al[22] focused on IS in elderly individuals in Thailand, identifying atrial fibrillation as a risk factor associated with older age. Stroke patients over the aged of 75 years had higher mortality and poorer prognosis. A study found that all systolic blood pressure measures after alteplase were linked to poor prognosis in women with AIS aged >= 60 years. In men with AIS aged < 60 years, only SBP at 24 hours after alteplase was related.[23] However, a study comparing risk factors and functional outcomes in stroke patients over 80 years old and younger stroke patients revealed that while older patients experienced more severe strokes, their post-stroke injuries were similar to those of younger patients, showed that stroke prognosis may have little correlation with age.[24] A gender study in Vietnam also found no differences in clinical outcomes between men and women 90 days after stroke.[25]
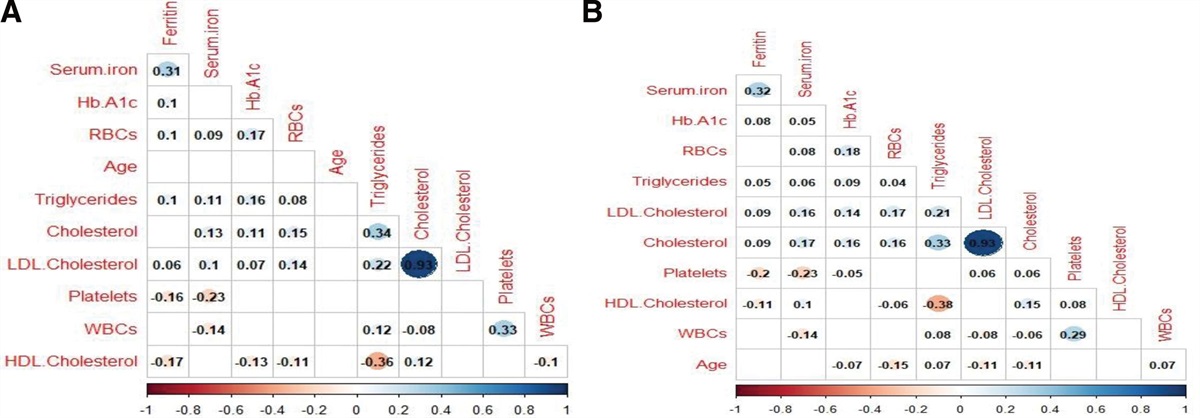
Furthermore, the presence of other comorbidities and specific clinical test indicators also exerts a discernible impact on stroke prognosis. Researchers discovered that within the population affected by an IS, the coexistence of chronic kidney disease displayed a connection with higher 1-month mRS scores.[26,27] Yang et al[28] suggested that early screening and treatment of liver fibrosis could reduce the risk of stroke in patients with non-valvular atrial fibrillation, especially in male patients. Furthermore, Chang et al[29] observed that patients with type 2 diabetes and/or hypertension had higher rates of new stroke and recurrence after 1 year of follow-up. Neutrophils, eosinophils, and neutrophil-to-lymphocyte ratio were independent factors for poor prognosis after mechanical thrombectomy in AIS patients.[30] High platelet count and high-sensitivity C-reactive protein (HS-CRP) were significantly associated with adverse clinical outcomes.[31] High-density lipoprotein (HDL) was associated with mild cognitive impairment and dementia.[32,33] Wang et al[34] found a positive correlation between low plasma HDL and cognitive improvement 6 months later in AIS patients. The triglyceride to high-density lipoprotein cholesterol ratio showed a nonlinear relationship and threshold effect, with both low and high ratios associated with adverse outcomes in AIS patients.[35]
Our study was centered on analyzing pairs of risk factors to discern effective indicators for stroke prognosis. The primary aim was to unveil the composite profile of risk factors and the underlying mechanisms linked to strokes.
2. Methods 2.1. Standard protocol approvals, registrations, and patient consentsThe study was undertaken in strict adherence to the ethical guidelines and received approval from the Ethics Committee of the Fourth Affiliated Hospital of Zhejiang University. The research protocol adhered to the “Measures for Ethical Review of Biomedical Research Involving Human Beings,” as well as the “International Ethical Guidelines for Health-Related Research Involving Human Beings” and the principles laid out in the Declaration of Helsinki. Additionally, the study complied with international ethical standards such as Good Clinical Practice (GCP) and International Conference on Harmonization – Good Clinical Practice, along with pertinent domestic laws and regulations. Rigorous patient screening was conducted in strict accordance with the study predefined inclusion and exclusion criteria.
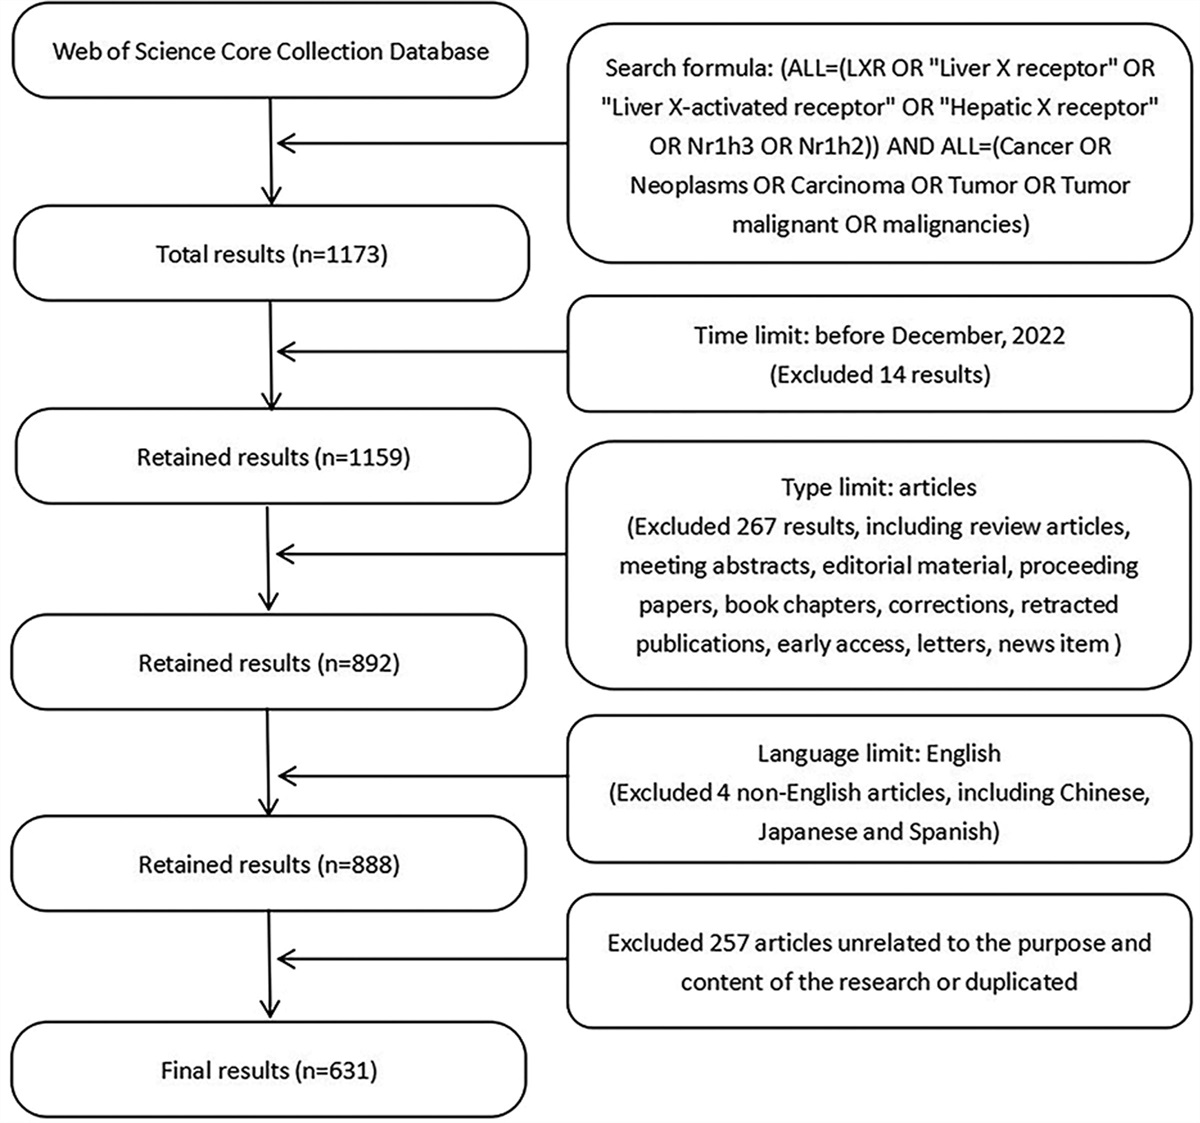
2.2. Study subjectsWe conducted a prospective cohort study, in a total of 146 stroke patients, admitted to the Fourth Affiliated Hospital of Zhejiang University (located in Zhejiang, China) from January 2020 to December 2023. Stroke was defined as the manifestation of acute neurological deficits persisting for over 24 hours, attributed to ischemic causes, with or without associated hemorrhagic brain damage, as evident from neuroimaging scans (cranial magnetic resonance imaging, with or without magnetic resonance angiography and magnetic resonance venography).
Inclusion criteria encompassed: patients admitted within 72 hours post onset of symptoms; patients diagnosed with acute stroke; age equal to or >18 years.
Exclusion criteria encompassed: any preexisting psychiatric diagnoses such as schizophrenia and depression; prior history of other neurological disorders; inability to complete scale assessments due to aphasia; lack of mRS follow-up data; presence of severe medical conditions like myocardial infarction and end-stage renal failure.
2.3. Clinical and laboratory examination data collectionPeripheral venous blood samples were systematically collected from all patients upon their emergency admission and promptly dispatched to the hospital laboratory department. These samples underwent comprehensive testing, including assessments of blood routine, liver and kidney function, electrolyte levels, coagulation parameters, and various other pertinent indices.
Patients’ demographic characteristics and clinical data, encompassing factors such as age, gender, hypertension history, diabetes mellitus, coronary atherosclerotic heart disease, and prior incidents of cerebral infarction, White blood cell count, absolute monocyte count (AMC), LDLC, HDLC, absolute lymphocyte value (ALV), Basophil absolute value (BAV), Eosinophil absolute value (EAV), platelet count (PC), absolute neutrophil count (ANC), and total cholesterol (TC), were meticulously extracted from the electronic medical record system.
2.4. Functional prognostic assessment and follow-upThe prognostic parameters investigated within this study encompassed the functional outcomes of patients at either the 90-day mark post-onset or at the time of death. Evaluation of functional prognosis was conducted utilizing mRS, where a score falling within the range of 0 to 2 indicated a favorable functional prognosis, while a score of 3 to 6 suggested an unfavorable functional prognosis. Accordingly, patients who either survived within 90 days from disease onset or achieved an mRS score of 0 to 2 were classified under the category of favorable short-term prognosis. Conversely, those who experienced mortality within 90 days or attained an mRS score of 3 to 6 were categorized as having an unfavorable short-term prognosis.
2.5. Data analysisStatistical analysis was conducted using Statistical Product and Service Solutions (SPSS, Version 23.0). Measurement data conforming to a normal distribution were presented as mean ± standard deviation, and comparisons between 2 means were carried out through the utilization of a 2 independent samples t-test. Non-normally distributed measurement data were represented as median (interquartile range) using the Mann–Whitney U test. Categorical data were subjected to analysis utilizing the chi-square test.
Variables that demonstrated a significance level of P < .05 in the one-way analysis were subsequently included as independent variables within the binary logistic regression model. This step aimed to identify risk factors that exhibited differences between the groups with mRS > 2 and those with mRS <= 2.
3. Results 3.1. Comparison of demographic and clinical data of stroke patientsAccording to the mRS scores and corresponding symptoms in Table 1, we divided the 146 patients included in the study into groups. Table 2 provides an overview of the demographic and clinical characteristics of all enrolled patients. Among the cohort of 146 patients, 98 were male and 48 were female, with an average age of 63.53 years. Within this population, 28 cases (19.18%) were classified within the unfavorable outcomes group (mRS > 2), while 118 cases (80.82%) were categorized under the favorable outcomes group (mRS <= 2). A notable distinction was observed in the distribution of Age, BI National Institutes of Health Stroke Scale (NIHSS), Absolute lymphocyte value level, and Pulse, between the unfavorable outcomes group (mRS > 2) and the favorable outcomes group (mRS <= 2) in all types of strokes. These differences demonstrated statistical significance (P < .05). However, no noteworthy disparities were detected in the remaining clinical data (P > .05).
Table 1 - The modified Rankin Scale (mRS). Grade Symptoms 0 No symptoms at all 1 No significant disability despite symptoms; able to carry out all usual duties and activities 2 Slight disability: unable to carry out all previous activities, but able to look after own affairs without assistance 3 Moderate disability: requiring some help, but able to walk without assistance 4 Moderately severe disability: unable to walk without assistance, unable to attend to needs without assistance 5 Severe disability; bedridden, incontinent, and requiring constant nursing care and attention 6 DeadPatients are graded on the scale of 0 to 6.
* The initial mRS was 0 to 5 and the 6th grade was added later. For outcome prediction in clinical trials, the mRS is usually dichotomized where good functional outcome is a score 0 to 2 and poor functional outcome 3 to 6.
AMC = absolute monocyte count, ANC = absolute neutrophil count, ALV = absolute lymphocyte value, BAV = Basophil absolute value, EAV = Eosinophil absolute value, HDLC = high-density lipoprotein cholesterol, LDLC = low-density lipoprotein cholesterol, PC = platelet count, TC = total cholesterol, WBCC = white blood cell count.
Variables that exhibited a significance level of P < .05 in the univariate analysis were selected as independent variables, while the categorization of outcomes as good or poor (with “poor” denoted as 0 and “good” denoted as served as the dependent variable. Multivariate logistic regression analysis was conducted to ascertain independent risk factors for unfavorable outcomes, and the results demonstrated that BI emerged as a distinct independent risk factor for adverse outcomes (as indicated in Table 3).
Table 3 - Binary logistic regression analysis of risk factors for stroke. B SE Wald χ2 P values Odds ratio (95% CI) Pulse −0.01 0.06 0.01 .91 0.99 (0.89 ~ 1.11) Age −0.04 0.07 0.33 .57 0.96 (0.84 ~ 1.10) BI 0.40 0.11 13.48 .00 1.50 (1.21 ~ 1.85) NHISS 0.11 0.25 0.19 .66 1.12 (0.68 ~ 1.84) ALV −0.16 1.36 0.01 .90 0.85 (0.06 ~ 12.30)ALV = absolute lymphocyte value.
In contrast to patients with favorable outcomes (mRS <= 2), those with unfavorable outcomes (mRS > 2) exhibited several distinguishing characteristics. The former group comprised relatively younger individuals, a higher proportion of females, and a lower incidence of hypertension and diabetes. Notably, there were significant discrepancies in terms of Age, BI, NIHSS, and ALV between the 2 patient groups. Conversely, the remaining variables did not display a significant association with stroke outcomes, as detailed in Table 4.
Table 4 - Clinical characteristics and factors associated with outcomes compared between and good and poor groups for ischemic stroke. Unit Poor (mRS > 2) Good (mRS <= 2) Z/t/χ2 P value Overall, n (%) 23 (17.69%) 107 (82.31%) Age, mean ± SD 71.65 ± 12.42 62.03 ± 12.03 3.391 .002 Sex Male, n (%) 18 (78.26%) 71 (66.36%) 1.243 .265 Female, n (%) 5 (21.74%) 36 (33.64%) Hypertension, n (%) 20 (86.96%) 80 (74.77%) 1.585 .208 Diabetes mellitus, n (%) 9 (39.13%) 25 (23.36%) 2.436 .119 Stroke subtype First-ever stroke, n (%) 16 (69.57%) 89 (83.18%) 1.467 .226 Recurrent stroke, n (%) 7 (30.43%) 18 (16.82%) BI, median (IQR) 60 (40) 100 (0) −9.094 0 NHISS, median (IQR) 4 (6) 1 (2) −3.763 0 WBCC, median (IQR) ×10^9/L 6.7 (5.1) 6.5 (2.8) −0.693 .489 AMC, median (IQR) ×10^9/L 0.4 (0.2) 0.4 (0.1) −0.427 .669 LDLC, mean ± SD mmol/L 2.69 ± 0.99 2.49 ± 0.83 0.948 .351 Triglycerides, median (IQR) mmol/L 1.28 (0.95) 1.3 (0.91) −0.448 .654 HDLC, mean ± SD mmol/L 1.14 ± 0.34 1.13 ± 0.28 0.122 .904 ALV, mean ± SD ×10^9/L 1.25 ± 0.57 1.68 ± 0.53 −3.339 .002 Pulse, mean ± SD beats/min 81.17 ± 14.32 75.68 ± 10.63 1.739 .093 BAV, median (IQR) ×10^9/L 0.03 (0.02) 0.03 (0.03) −0.208 .836 EAV, median (IQR) ×10^9/L 0.08 (0.13) 0.1 (0.13) −1.329 .184 Homocysteine, median (IQR) μmol/L 18 (15.6) 13.5 (8.2) −1.629 .103 PC, mean ± SD ×10^9/L 223.04 ± 74.13 208.29 ± 52.51 0.907 .373 ANC, median (IQR) ×10^9/L 5 (4.4) 4.1 (2.4) −1.526 .127 TC, mean ± SD mmol/L 4.6 ± 1.31 4.37 ± 1.02 0.766 .45AMC = absolute monocyte count, ANC = absolute neutrophil count, ALV = absolute lymphocyte value, BAV = Basophil absolute value, EAV = Eosinophil absolute value, HDLC = high-density lipoprotein cholesterol, LDLC = low-density lipoprotein cholesterol, PC = platelet count, TC = total cholesterol, WBCC = white blood cell count.
Within the framework of the multivariate analysis model, BI demonstrated a robust and independent association with an elevated risk of unfavorable outcomes during the IS phase (OR 1.48, 95% CI 1.20 ~ 1.83, P < .001). Conversely, Age (OR 0.96, 95% CI 0.84 ~ 1.10, P = .58), NIHSS at onset (OR 1.10, 95% CI 0.69 ~ 1.77, P = .69), and ALV (compared to other stroke types: OR 0.86, 95% CI 0.06 ~ 12.37, P = .91) did not exhibit an independent impact on outcomes during the IS phase, as detailed in Table 5.
Table 5 - Binary logistic regression analysis of risk factors for ischemic stroke. B SE Wald χ2 P values Odds ratio (95% CI) Age −0.04 0.07 0.30 .58 0.96 (0.84 ~ 1.10) BI 0.39 0.11 13.48 .00 1.48 (1.20 ~ 1.83) NHISS 0.10 0.24 0.16 .69 1.10 (0.69 ~ 1.77) ALV −0.15 1.36 0.01 .91 0.86 (0.06 ~12.37)ALV = absolute lymphocyte value.
Precise evaluation of the prognosis for patients with acute stroke serves a dual purpose: it not only guides the selection of appropriate treatment strategies but also facilitates the implementation of targeted interventions. Accurate assessment of the prognosis of patients with acute stroke not only determines the choice of treatment options, but also helps to take targeted interventions.
BI is a common stroke detection item in clinical practice, and it is widely carried out in laboratory departments at all levels in my country. The BI scales was significant in our study, both in stroke (OR 1.50, 95% CI 1.21 ~ 1.85, P < .001) and IS (OR 1.48, 95% CI 1.20 ~ 1.83, P < .001). Many studies have reported the value of BI in stroke. Functional ability assessed by BI scores revealed that 60 points was a key score for steering assistance and independence, with scores above 40 associated with higher rates of patients being discharged home and shorter hospital stays.[36] Liu et cl.[37] found the relationship of BI and its short form with the mRS in acute stroke patients. In a Rasch analysis of the modified BI, researchers found that the modified BI had high reliability but a relatively bad matching degree between item difficulty and patient ability.[38] Li et al[39] concluded that early mobilization is associated with an increased BI and shorter hospital stay for patients. And the Greek Modified BI was deemed adequate for use in Greek stroke neurorehabilitation patients.[40] Therefore, BI score can be used as a risk factor for stroke prognosis.
In addition, in the one-way analysis of variance, this study found that age, NIHSS score, and ALV were highly significant for all stroke prognosis groups. There are also many reports on these 3 risk factors in previous studies.
Age is also a common risk factor for stroke prognosis. Age may reduced the regeneration ability of neurons and increased the difficulty of recovery by affecting the body physiological and metabolic processes. A study found the causes of childhood stroke are distinct from those in adults.[41] The rates of mortality and recurrence in arterial IS display notable distinctions between younger and older populations.[42] For instance, among young adults, the 1-year mortality rate for stroke stands at 4.5%, and the recurrence rate over the same period is 1.5%. In contrast, elderly individuals face more subst
Comments (0)