
Remember me

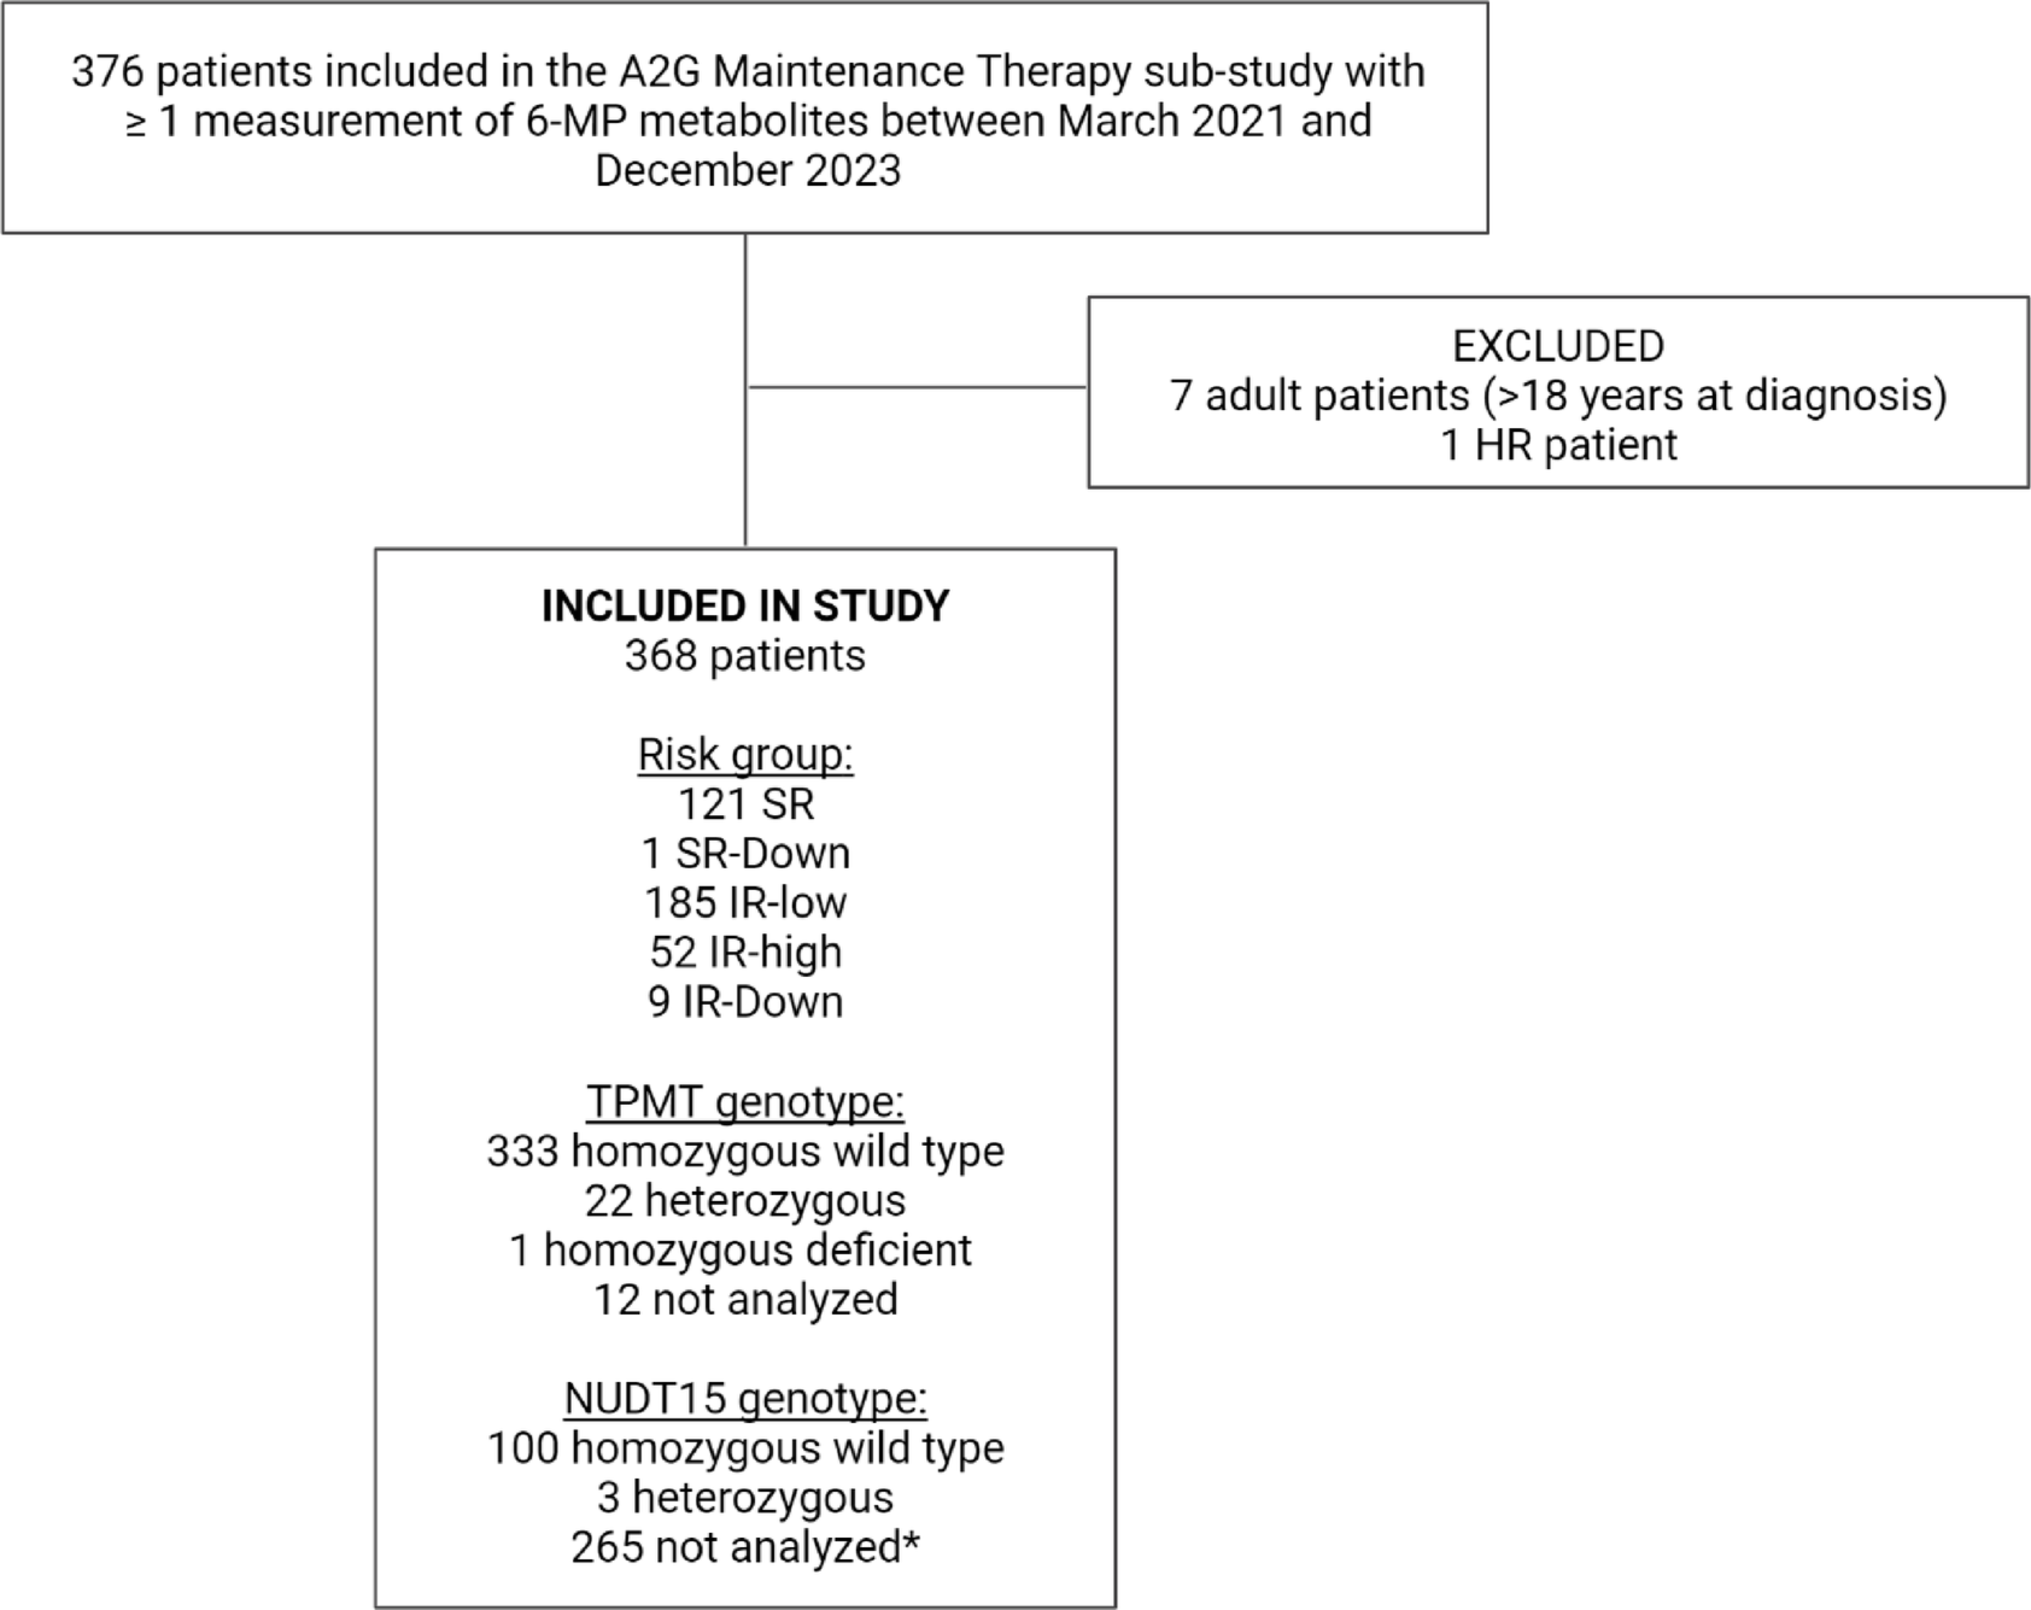
In total, 368 patients were included in this study (see Online Resource 7 for number of patients and samples from each country). Median age at diagnosis was 4.7 years (min 0.4, max 17.2), 47% were female and 53% were male. Most patients presented with BCP ALL (93.2%), were TMPT homozygous wild type (93.5%) and NUDT15 homozygous wild type (97.1%, not analyzed for 265 patients). One patient was compound TPMT and NUDT15 heterozygous. The patients were stratified as IR-low (n = 185, 50.3%), SR (n = 121, 32.9%), IR-high (n = 52, 14.1%), SR-Down (n = 1, 0.3%) and IR-Down (n = 9, 2.4%) (Online Resource 8). Median time between sample collection for individual patients was 29 days (75% range 27–41, max 209). The median number of samples collected per patient was seven (min one, max 34), while 36 patients (9.8%) contributed with only one blood sample.
Samples detected with the current reporting back systemOf 3,021 samples with measures of both TGN or MeMP, 187 samples (6.2%) from 96 patients had either TGN or MeMP below the reporting back limits. Of these, 39 samples from 26 patients had levels of both TGN and MeMP below the limits, corresponding to 1.3% of the total samples.
Of the 26 patients with a sample with both TGN and MeMP below the reporting back limit, 17 (65%) were male and their median age was 5.0 years (min 1.4, max 16.7). Of these patients, 21 had only one sample with both metabolites below the reporting back limits, while five had two or more (maximum seven from the same patient). The latter five patients had a total of 51 samples available, with 35% having low levels of both TGN and MeMP. The samples with both low MeMP and TGN were distributed throughout maintenance therapy, but six were collected on the first day of maintenance therapy (three IR-high, two IR-low, one SR), thereby not reflecting non-adherence (Online Resource 9). Five of the 39 samples with low TGN and MeMP were collected during a registered prescribed treatment interruption, while 20 of these samples were not collected during a treatment interruption (missing information on treatment interruption status for 14 samples).
Distribution of 6-MP metabolitesA total of 3,074 samples from 368 patients were included in the study, whereof 2,990 samples from 364 patients had measurements of all three metabolites, MeMP, TGN and DNA-TG. Distributions of MeMP, TGN and DNA-TG were right-skewed; log-transformed values of TGN and DNA-TG improved symmetry (Fig. 2). MeMP had a wider range (median 4,959; 95% range 135–23,880; min below the detection limit; max 45,306) than TGN (median 212; 95% range 40–642; min below the detection limit; max 1,529) and DNA-TG (median 569; 95% range 73–1,823; min 13; max 3,043). The limits for generation of a reporting back notice in the A2G Maintenance Therapy sub-study corresponded to the 3.6th percentile for TGN (< 50) and the 3.7th and 5.9th percentile for MeMP (< 200 for TPMT wild type and < 100 for TPMT heterozygous).
Fig. 2
Distribution of methylated mercaptopurine metabolites (MeMP), thioguanine nucleotides (TGN) and DNA incorporated thioguanine nucleotides (DNA-TG) in the collected blood samples. *Below the detection limit
The total median of mDNA-TG (median DNA-TG for each patient) was 585 fmol TG/µg DNA, total median mMeMP was 4,712 nmol/mmol hemoglobin and total median mTGN was 217 nmol/mmol hemoglobin. The median mDNA-TG was higher in males than females (638 vs. 512 nmol/mmol hemoglobin, p = 0.003), furthermore, the mDNA-TG was somewhat higher in SR patients compared to IR-low patients (659 vs. 541, p = 0.005) and IR-high patients (659 vs. 559, p = 0.047), while there was no significant difference between the two IR groups (p = 0.85). The median mTGN and mMeMP were comparable across sexes and risk groups, and no significant differences were found across phenotypes (BCP and T-cell ALL) for both mDNA-TG, mTGN, and mMeMP (Online Resource 10). The total median DNA-TG increased throughout maintenance, as seen by a positive slope of the LOESS line of the median DNA-TG and days in maintenance therapy, which was not seen for MeMP and TGN (Online Resource 11).
Associations of DNA-TG with MeMP, TGN and prescribed dose of 6-MPVisually, there was a positive association between TGN and MeMP, however, some of the highest levels of TGN were seen with the lowest levels of MeMP, with a LOESS line with MeMP as outcome variable flattening due to the high TGN levels at moderate and low levels of MeMP (Online Resource 12). A positive association of DNA-TG with both MeMP and TGN was observed (Fig. 3a and b), with a steeper LOESS line for association with TGN than MeMP. Furthermore, a positive association of DNA-TG with prescribed 6-MP dose in mg/m2/day was observed, though the LOESS line flattened and reversed at higher 6-MP doses for TPMT heterozygous patients (Fig. 3c and d).
Fig. 3
Plots of measured 6-mercaptopurine (6-MP) metabolites and prescribed doses of 6-MP with locally estimated scatterplot smoothing (LOESS, red line). Samples from one thiopurine S-methyltransferase (TPMT) deficient patient not included. Black points: samples from TPMT homozygous wild type patients, blue points: samples from TPMT heterozygous patients. Dotted line: median value. a Mercaptopurine metabolites (MeMP) and DNA incorporated thioguanine nucleotides (DNA-TG, 2,991 samples from 363 patients), b thioguanine nucleotides (TGN) and DNA-TG (2,992 samples from 363 patients), c dose of 6-MP in mg/m2/day and DNA-TG for TPMT homozygous wild type patients (2,066 samples from 317 patients, 17 samples with dose of 6-MP > 130 mg/m2/day not shown), d dose of 6-MP in mg/m2/day and DNA-TG for TPMT heterozygous patients (128 samples from 21 patients). *Value below the detection limit
In linear mixed effects models, DNA-TG was positively associated with TGN and MeMP in mutually adjusted analyses. DNA-TG increased by 10% at a doubling of MeMP (estimate 1.10, 95% CI 1.09–1.12) and increased by 72% at a doubling of TGN (estimate 1.72, 95% CI 1.68–1.77), at fixed effects of the other metabolite. There was a positive association of DNA-TG with 6-MP dose for both TPMT genotypes, with an increase in DNA-TG of 8% (estimate 1.08, 95% CI 1.07–1.09) and 13% (estimate 1.13, 95% CI 1.09–1.18) at a 20% increase of 6-MP dose for the TPMT homozygous wild type and heterozygous patients, respectively. Similar estimates for association of DNA-TG with MeMP, TGN and dose of 6-MP were seen after adjusting for transport days of the metabolite samples and additionally for age and sex (Online Resource 13 and 14).
DNA-TG in samples with low TGN and MeMPDNA-TG was correspondingly low in samples with both MeMP and TGN below the reporting back limit in the same blood sample (Fig. 4); the maximum value of DNA-TG in these samples was 198 fmol TG/µg DNA. Of all 3.074 samples, 399 had DNA-TG below 200 fmol TG/µg DNA, which corresponds to the 13th percentile, and of these samples with low DNA-TG approx. 10% had TGN and MeMP below the reporting back limits. DNA-TG was predominantly below 200 fmol TG/µg DNA in samples with TGN below the reporting back limit at all levels of MeMP, while higher values of DNA-TG is seen in samples with low MeMP and high TGN, with the maximum of 2,367 fmol TG/µg DNA (above the 99th percentile) in samples with only MeMP below the reporting back limit.
Fig. 4
Plot of methylated mercaptopurine metabolites (MeMP) and thioguanine nucleotides (TGN) in 2,990 blood samples from 364 patients. The corresponding measurement of DNA incorporated thioguanine nucleotides (DNA-TG) in the sample is illustrated by color. Median DNA-TG = 569 fmol TG/µg DNA. The limits for generation of a reporting back notice for MeMP and TGN are illustrated as dotted lines (MeMP limit dependent on the TPMT genotype). *Below detection limit
Probability of treatment interruptionLogistic regression analyses were performed on 2,455 samples from 349 patients with complete data on 6-MP metabolites and 6-MP dose in mg/day and showed an association between levels of 6-MP metabolites and the probability of a prescribed treatment interruption.
In univariate models, decreasing levels of DNA-TG, TGN and MeMP were associated with a prescribed treatment interruption (Table 1). In a mutually adjusted model with all metabolites, the predicted probability of a prescribed treatment interruption decreased 59% per doubling of DNA-TG (OR 0.41, 95% CI 0.29–0.58) and 87% per 100 nmol/mmol hemoglobin increase in TGN (OR 0.13, 95% CI 0.06–0.26), with similar estimates when additionally adjusting for age, sex, and transport time of the samples, as well as when excluding samples with more than two days of transport (Online Resource 15). In univariate models, the probability of a prescribed treatment interruption increased with decreasing MeMP, but the association was reversed when mutually adjusting for either DNA-TG, TGN or both, possibly due to reverse causation, leading to an exclusion of MeMP in succeeding analyses.
Table 1 Associations of DNA incorporated thioguanine nucleotides (DNA-TG), methylated metabolites (MeMP) and thioguanine nucleotides (TGN) with the predicted probability of a prescribed treatment interruption, in general linear mixed effects models with a random effect of patients and treatment center (analyses performed on 2,455 6-MP metabolite measurements from 349 patients with complete data on metabolites and status of prescribed treatment interruption at the time of sample collection)ROC-curves were used to illustrate the performance of the models, and the mutually adjusted model with TGN and DNA-TG yielded an AUC of 0.90 and a pAUC0.1 (at False Positive Rate = 0.1) of 0.05. The performance of the model was slightly reduced when only using DNA-TG as a predictor of probability of a prescribed treatment interruption (univariate model), with an AUC of 0.87, while almost similar at lower levels of the False Positive Rate (pAUC0.1 at 0.05) (Fig. 5).
Fig. 5
Receiver-operating-characteristic (ROC) curves, illustrating the performance of general mixed effect models to predict the probability of a prescribed treatment interruption at the time of sample collection, based on 6-mercaptopurine (6-MP) metabolite levels. a Model with thioguanine nucleotides (TGN) and DNA incorporated thioguanine nucleotides (DNA-TG) as predictors, b Model with only DNA-TG as predictor. AUC = area under the curve, pAUC = partial area under the curve at given False Positive Rate
Comments (0)