
Remember me
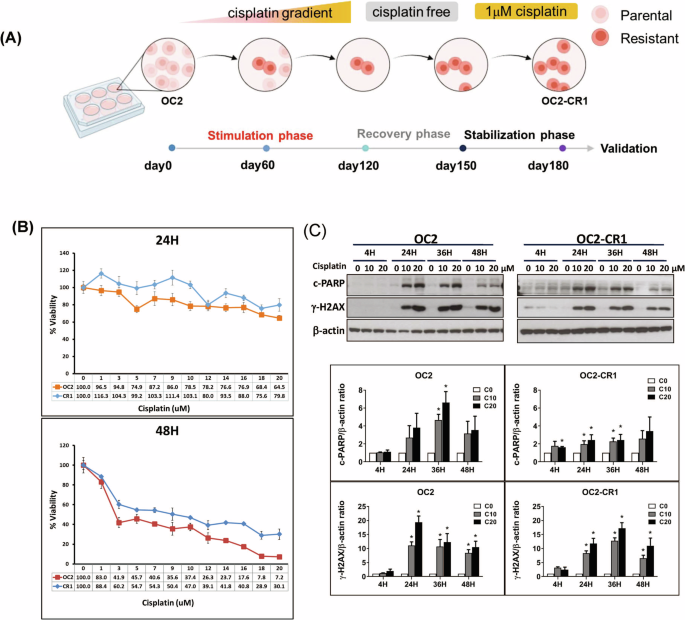

Cisplatin-resistant HNSCC cells were generated from the OC2 cell line through a progressive selection process involving increasing concentrations of cisplatin (Sigma-Aldrich, UK) over a 6-month period. The selection began with low doses and culminated in continuous exposure to 1 μM cisplatin, resulting into the stable resistant phenotype designated as OC2-CR1 (Fig. 1A). To assess cisplatin sensitivity, OC2 and OC2-CR1 cells were treated with a range of cisplatin concentrations for 24 and 48 h, and cell viability was evaluated by using the WST1 assay (Fig. 1B). OC2 cells displayed sensitivity to cisplatin, while OC2-CR1 cells exhibited marked resistance. At 48 h, the IC50 values were 2 μM for OC2 cells and 9 μM for OC2-CR1 cells, confirming the significant resistance of OC2-CR1 cells compared to the parental OC2 cells.
Fig. 1: Functional characterization of parental OC2 and cisplatin-resistant OC2-CR1 cells.
A Schematic timeline illustrating the establishment of cisplatin-resistant HNSCC cell line OC2-CR1. B Cell viability of OC2 and OC2-CR1 cells treated with cisplatin at concentrations ranging from 1 to 20 μM for 24 h or 48 h, determined by WST-1 assay. Data represent the mean ± SD from six independent experiments. C Western blot analysis of γH2AX and cleaved PARP levels in OC2 and OC2-CR1 cells following cisplatin treatment for 4, 24, 36, and 48 h. Densitometric analysis results are shown as histograms. β-actin was used as a loading control. Quantitative data are presented as the mean ± SEM of three independent experiments. *p < 0.05.
To further compare cisplatin and ONC201 sensitivity, IC50 values for FaDu, Detroit 562, and CAL 27 were determined alongside OC2 and OC2-CR1 cells (Fig. S1). Among these, CAL 27 (CRL-2095™) cells also demonstrated inherent resistance to cisplatin. WST-1 assay results showed IC50 values of 4 μM, 8.7 μM, and 5.1 μM,for FaDu, Detroit 562, and CAL 27, respectively. In comparison, OC2 and OC2-CR1 exhibited IC50 values of 2 μM and 13.1 μM, respectively, reinforcing the cisplatin-sensitive versus-resistant profiles of these two lines.
During ONC201 testing, it was noted that the compound interfered with the WST-1 assay, leading to overestimation of viability and discrepancies with actual cell counts. To overcome this, ONC201 IC50 values were determined using viability and cytotoxicity assays based on automated cell counting. After 72 h of treatment, IC50 values were 4.4 μM (OC2), 4.3 μM (OC2-CR1), and 4.0 μM, (CAL 27), while FaDu and Detroit 562 cells showed markedly reduced sensitivity, with IC50 values of 19 μM and > 20 μM, respectively.
Interestingly, ONC201 retained its cytotoxic efficacy in cisplatin-resistant cells, suggesting that resistance to cisplatin did not confer cross-resistance to ONC201. Notably, a combinatorial effect was observed in OC2 and OC2-CR1 cells when treated with both ONC201 and cisplatin, suggesting a potential synergistic interaction.
To further investigate the molecular response to cisplatin, Western blot analysis was performed to assess DNA damage and apoptosis markers, including γH2AX and cleaved Poly (ADP-ribose) polymerase (PARP) (Fig. 1C). In OC2 cells, cisplatin induced a dose-dependent increase in both γH2AX and cleaved PARP, indicating enhanced DNA damage and apoptotic activity. Conversely, OC2-CR1 cells exhibited only modest increases in these markers, reflecting an impaired response to cisplatin-induced cytotoxicity.
ONC201 and cisplatin induced mtROS production in HNSCC cellsExcess cellular levels of reactive oxygen species (ROS) cause damage to intracellular lipids, proteins, nucleic acids and organelles, leading to cell death and damaged biological molecules via the endoplasmic reticulum (ER) stress-mediated pathway [20, 21]. To investigate the role of oxidative stress in the anti-tumor effects of cisplatin and ONC201, mitochondrial ROS levels were assessed using confocal microscopy and flow cytometry. Cells were treated with ONC201, cisplatin, or their combination for 24 and 48 h, followed by staining with MitoSOX™ Red to detect mitochondrial ROS. Fluorescence intensity was quantified to evaluate ROS levels (Fig. 2A). Flow cytometric analysis was further performed using MitoSOX Red and dihydroethidium (DHE) probes to measure mitochondrial and intracellular ROS, respectively, at 24-, 48-, and 72- h post-treatment (Figs. 2B, 2C, and Fig. S2).
Fig. 2: Effects of ONC201 and cisplatin on reactive oxygen species (ROS) levels in OC2 and OC2-CR1 cells.
A Mitochondrial ROS levels in OC2 and OC2-CR1 cells after 24 h and 48 h treatment with ONC201, cisplatin, or their combination, determined by confocal microscopy. Cells were stained with MitoSOX™ Red (5 μM) for 30 min at 37 °C. Images were acquired at ×400 magnification. Quantitative analysis of fluorescence intensity is presented as histograms. Data are shown as the mean ± SEM from three independent experiments. *p < 0.05. Flow cytometry analysis of ROS levels: B mitochondrial ROS and C intracellular ROS after treatment with ONC201, cisplatin, or their combination for 24 h, 48 h, and 72 h. Cells were stained with 5 μM MitoSOX™ Red (mitochondrial ROS) or 5 μM DHE (intracellular ROS) for 15 min at 37 °C. Histogram data represent the mean ± SEM of six independent experiments. *p < 0.05.
The results revealed that treatment with ONC201 or cisplatin alone, as well as their combination, led to increased mitochondrial ROS generation in OC2 cells at all time points (24, 48, and 72 h). In OC2-CR1 cells, mitochondrial ROS levels were elevated at 48 and 72 h, but not at 24 h, suggesting a delayed oxidative response in the cisplatin-resistant subline. The DHE assay showed a significant increase in intracellular ROS in both OC2 and OC2-CR1 cells following cisplatin treatment for 48 h. Notably, combined treatment with high doses of cisplatin and ONC201 resulted in a marked elevation of intracellular ROS levels in OC2-CR1 cells, but not in OC2 cells, indicating a potentially synergistic oxidative stress response in the resistant phenotype.
Effects of ONC201 and cisplatin on ER stress-mediated cell death in HNSCC cellsCisplatin and the ERK inhibitor ONC201 are known to induce an ATF-mediated integrated stress response (ISR) that inhibits the growth of various solid tumors. These agents promote cell death by inducing ISR and ER stress-mediated pathways. However, in resistant cancer cells, altered ISR and ER stress can diminish the efficacy of these drugs [22]. To elucidate the mechanisms underlying ER stress-mediated cell death, we examined the expression profiles of ER stress-related markers in parental OC2 and cisplatin-resistant OC2-CR1 cells following treatment with ONC201, cisplatin, or their combination (Fig. 3). Western blot analysis demonstrated that ONC201 markedly upregulated ATF4 and CHOP expression at 24 h in OC2 cells, with a subsequent decline observed at 72 h. Interestingly, ATF3 expression remained low at 24 and 48 h but increased substantially at 72 h post-treatment. In contrast, cisplatin treatment failed to induce ATF4 expression at any time point (24, 48, or 72 h), but robustly upregulated both ATF3 and CHOP expression (Fig. 3A).
Fig. 3: Western blot analysis of ER stress-mediated cell death regulators in treated HNSCC cells.
Representative Western blot analysis of (A) ATF3, ATF4, CHOP, and (B) γH2AX, cleaved PARP (cPARP), and MCL1 expression levels in OC2 and OC2-CR1 cells after 24 h, 48 h, and 72 h of treatment with ONC201, cisplatin, or their combination. β-actin was used as a loading control. Densitometric analysis results are presented as histograms. Data are expressed as the mean ± SEM from three independent experiments. *p < 0.05.
A similar expression pattern was observed in FaDu cells. ONC201 induced transient ATF4 and CHOP expression, whereas cisplatin selectively induced ATF3 and CHOP, without affecting ATF4 levels (Fig. S3). Notably, CHOP levels remained elevated at all time points (24, 48, and 72 h) compared to control. Combination treatment in both OC2 and FaDu cells resulted in a sustained elevation of ATF3, with CHOP expression peaking at 24 and 48 h and subsequently declining at 72 h. This response appears to be, at least in part, ATF4-dependent. In cisplatin-resistant OC2-CR1 cells, both ONC201 and cisplatin similarly induced ATF3 and CHOP expression at 24 and 48 h, with a notable reduction at 72 h. A comparable pattern was also observed in Detriot 562 cells, indicating a consistent response in cisplatin-resistant cell lines. Collectively, these findings suggest that CHOP expression is regulated through distinct pathways in cisplatin-sensitive and -resistant cells. In OC2 and FaDu cells, CHOP induction appears to occur via both ATF3 and ATF4 pathways, whereas in OC2-CR1 and Detriot 562 cells, CHOP upregulation is predominantly mediated by ATF3 (Fig. 3A, S3).
To further validate these findings, we performed quantitative reverse transcription PCR (RT-qPCR). In OC2 cells, ONC201 significantly increased ATF4 and CHOP transcript levels at 24 h, while cisplatin primarily upregulated ATF3 and CHOP, with only modest effects on ATF4. Combination treatment significantly elevated all three transcripts (ATF3, ATF4, and CHOP). In OC2-CR1 cells, ONC201 significantly induced ATF3, ATF4, and CHOP at 48 h, whereas cisplatin predominantly increased ATF3 and CHOP at 24 and 48 h. Combination treatment further augmented expression of all three markers at both time points. Overall, transcriptional and protein expression patterns were generally consistent, although some time-dependent discrepancies between mRNA and protein levels were observed. Notably, ONC201 induced ATF4 protein only in OC2, not in OC2-CR1 cells (Fig. S4).
We next examined whether these stress responses were linked to cell death. Western blot analysis showed that ONC201 did not induce γH2AX, a marker of DNA damage, but upregulated MCL1 expression at 24 h, followed by decreased MCL1 and cleaved-PARP levels at 48 and 72 h in both cell lines. Cisplatin treatment, in contrast, markedly increased γH2AX and cleaved-PARP levels in a dose-dependent manner while downregulating MCL1 in OC2 cells. A similar trend was observed in OC2-CR1 cells, although the extent of DNA damage and apoptosis was attenuated compared to the parental line. Combined treatment recapitulated the effects of cisplatin at 24 and 48 h, but significantly suppressed MCL1 and cleaved-PARP levels by 72 h (Fig. 3B). These findings suggest that ONC201 and cisplatin induce ER stress–mediated apoptosis through distinct regulatory pathways: via ATF4/CHOP in OC2 cells and via ATF3/CHOP in OC2-CR1 cells, both converging on MCL1 downregulation as a critical determinant of cell death.
ONC201 and cisplatin inhibit cell viability and migration and induce apoptosis in HNSCC cellsTo investigate the therapeutic potential of ONC201 and cisplatin in HNSCC, we assessed their short-term effects on cell proliferation, apoptosis, necrosis, and migration across multiple HNSCC cell lines. These in vitro studies aimed to elucidate the cytotoxic mechanisms of each agent and optimize conditions for potential in vivo application [23, 24]. Cell viability assays revealed that both ONC201 and cisplatin independently reduced cell viability in a time- and dose-dependent manner in OC2 cells. Similar inhibitory effects were observed in FaDu, Detroit 562, and CAL27 cells. In the cisplatin-resistant OC2-CR1 cells, cytotoxicity was delayed but became evident after 48 h of treatment. Notably, combination treatment with ONC201 and cisplatin produced a synergistic reduction in viability in all five HNSCC cell lines, with the most pronounced effect observed at 72 h (Fig. 4A and S5).
Fig. 4: Combination therapy synergistically inhibits cell proliferation, colony formation, migration, and induces apoptosis in HNSCC cells.
A Cell viability was assessed by consecutive cell counting over three days. Treatment with ONC201, cisplatin, or their combination significantly reduced cell viability compared to the control group (*p < 0.05 vs. control, #p < 0.05 vs. ONC201 alone, \(\dagger\)p < 0.05 vs. cisplatin alone). B Colony formation assays of OC2 and OC2-CR1 cells treated with various concentrations of cisplatin, ONC201, or their combination for 10 days, stained with crystal violet, and quantified using ImageJ software. Data are presented as the mean ± SEM (n = 6). *p < 0.05 versus control. C Representative images and quantification of cell migration assays. OC2 and OC2-CR1 cells were treated with various concentrations of cisplatin, ONC201, or their combination and assessed using the Oris™ Cell Migration Assay. Real-time migration curves were generated, and data are expressed as the mean ± SEM (n = 6). *p < 0.05. D Apoptosis was analyzed by flow cytometry in OC2 and OC2-CR1 cells treated with ONC201, cisplatin, or the combination for 24, 48, and 72 h. Experiments were performed in triplicate, and data are shown as mean ± SEM. *p < 0.05 vs. control, #p < 0.05 vs. ONC201 alone, \(\dagger\)p < 0.05 vs. cisplatin alone (Student’s t-test).
To evaluate long-term proliferative capacity, colony formation assays were performed in OC2 and OC2-CR1 cells. Both ONC201 and cisplatin significantly suppressed colony formation in a dose-dependent manner over a 9-day period. The combination of 1 µM cisplatin with increasing concentrations of ONC201 (0.25–1 µM) further enhanced this suppressive effect, particularly in OC2 cells, which were more sensitive than the resistant OC2-CR1 cells (Fig. 4B).
Cell migration was assessed using a 2D Oris™ Cell Migration Assay. Treatment with ONC201 (1 µM), cisplatin (10 or 20 µM), or their combination significantly impaired motility in both OC2 and OC2-CR1 cells after 48 h. Combination treatment exerted the strongest inhibitory effect on migration. Interestingly, this suppression was more pronounced in OC2-CR1 cells, indicating a heightened sensitivity of resistant cells to the anti-migratory effects of the drug combination (Fig. 4C).
Apoptosis and necrosis were evaluated using Annexin V/PI staining. Cisplatin induced dose- and time-dependent apoptosis in all cell lines tested. ONC201 primarily induced necrosis in OC2 cells but triggered classic apoptotic features in FaDu, Detroit 562, and CAL27 cells at 72 h. Combination treatment significantly increased apoptotic cell death in OC2, FaDu, Detroit 562, and CAL27 cells, suggesting a synergistic effect. However, in the cisplatin-resistant OC2-CR1 cells, the combination failed to enhance apoptosis beyond the levels induced by individual treatments, indicating an altered cell death response in the resistant phenotype (Fig. 4D and S6).
Together, these findings demonstrate that ONC201 and cisplatin synergistically inhibit cell viability and migration, while promoting apoptosis in HNSCC cells. Although cisplatin-resistant cells retain partial sensitivity to combination treatment with respect to proliferation and migration, they exhibit reduced apoptotic responses, suggesting the involvement of distinct cell death mechanisms in drug resistance. These short-term cellular responses provide critical mechanistic insights into drug action and inform the design of future in vivo efficacy studies.
Significant anti-proliferative effects of cisplatin and ONC201 in an orthotopic graft model of HNSCCTo investigate the long-term antitumor efficacy of cisplatin and ONC201, we employed an in vivo xenograft model using both parental OC2 and cisplatin-resistant OC2-CR1 HNSCC cells. While the direct translation of short-term in vitro responses to long-term in vivo outcomes remains complex due to the influence of pharmacokinetics, tumor microenvironment, and immune modulation [23], it is well established that early cellular stress responses such as apoptotic activation and ER stress can culminate in durable tumor suppression over time. Prior to efficacy studies, the maximum tolerated doses (MTDs) of ONC201 and cisplatin were established in NU/NU and BALB/c mice based on weight monitoring and clinical scoring (activity, appearance, general condition). Intraperitoneal administration of ONC201 (50 mg/kg) and cisplatin (3 mg/kg), twice weekly for four weeks, did not elicit significant toxicity compared to vehicle-treated controls. Hematoxylin and eosin (H&E) staining of liver and kidney tissues revealed no overt histopathological alterations, further supporting the tolerability of the dosing regimen (Fig. S7).
To evaluate therapeutic efficacy, tumor-bearing NU/NU mice were treated with cisplatin (3 mg/kg), ONC201 (50 mg/kg), or a combination of both agents, beginning on day 14 post-inoculation and continuing for 4 weeks (Fig. 5A). In the OC2 xenograft model, both monotherapies significantly suppressed tumor growth compared to vehicle control. Importantly, combination treatment achieved the greatest tumor inhibition without affecting overall body weight, indicating a favorable safety profile (Fig. 5B, C). In contrast, in the OC2-CR1 xenografts, neither cisplatin nor ONC201 alone significantly inhibited tumor growth. Strikingly, only the combination treatment led to a significant reduction in tumor burden in this resistant model, highlighting the potential of ONC201 to overcome cisplatin resistance in vivo.
Fig. 5: Combination of ONC201 and cisplatin enhances tumor suppression in cisplatin-resistant HNSCC xenograft models.
OC2 or cisplatin-resistant OC2-CR1 cells were subcutaneously implanted into the dorsal flank of athymic nude mice. After 14 days of tumor establishment, mice were randomly assigned to four treatment groups (n ≥ 6 per group): vehicle control, cisplatin (3 mg/kg), ONC201 (50 mg/kg), or the combination of both agents. Treatments were administered intraperitoneally twice weekly for 4 weeks. A Schematic representation of the in vivo treatment schedule (B.I.W. = twice a week). B Body weights of mice in each treatment group over time, shown as mean ± SEM at pre-specified time points. C Tumor photographs and volumes at the study endpoint for each treatment group, presented as mean ± SEM. *p < 0.05. D Immunohistochemical analysis of ATF3, ATF4, and CHOP expression in xenograft tumor tissues harvested from each treatment group. Scale bars = 100 μm (original magnification, ×100). Data are presented as mean ± SEM and analyzed using Student’s t test. *p < 0.05.
To elucidate the underlying mechanisms, immunohistochemical (IHC) analysis was conducted to assess expression of ER stress markers ATF3, ATF4, and CHOP in tumor tissues from each treatment group (Fig. 5D). In OC2-derived tumors, cisplatin and ONC201 both elevated ATF3 expression. However, in OC2-CR1 tumors, ATF3 expression remained low regardless of treatment. ATF4 levels were consistently higher in OC2 tumors compared to OC2-CR1, with minimal treatment-related changes. CHOP expression was significantly upregulated by all treatments cisplatin, ONC201, and the combination in both OC2 and OC2-CR1 tumors relative to untreated controls.
Taken together, these results demonstrate that the combination of ONC201 and cisplatin exerts synergistic antitumor effects in vivo, particularly in cisplatin-resistant HNSCC models. The efficacy appears to be associated with differential modulation of ER stress signaling pathways, supporting the translational relevance of the short-term in vitro findings.
Validation the in vitro and xenograft results from the real-world evidence and survival analysesTo further validate the in vitro and xenograft results, we retrospectively analyzed clinical data from patients diagnosed with first primary oral squamous cell carcinoma (OSCC) who underwent curative surgery followed by cisplatin-based adjuvant concurrent chemoradiotherapy (CCRT) at Kaohsiung Chang Gung Memorial Hospital, Taiwan, between January 2011 and December 2016. The clinicopathological parameters of the entire OSCC cohort who underwent radical surgery followed by adjuvant CCRT are summarized in Table 1. Among the 45 patients included in the study, high expression of ATF3 was observed in 30 patients (66.7%), high expression of ATF4 in 23 patients (51.1%), and high expression of CHOP in 37 patients (82.2%) (Fig. 6).
Fig. 6: Immunohistochemical expression of ATF3, ATF4, and CHOP in OSCC tissues.
A Representative immunohistochemical images showing low and high expression of ATF3, ATF4, and CHOP in OSCC tissues. Scoring criteria: ATF3 (Low: weak, 5%, IRS < 2; High: strong, 90%, IRS ≥ 2), ATF4 (Low: weak, 5%, IRS < 9; High: strong, 90%, IRS ≥ 9), and CHOP (Low: weak, 5%, IRS < 2; High: strong, 90%, IRS ≥ 2). Scale bar = 100 μm (original magnification ×100). B Correlations between ATF3, ATF4, and CHOP expression levels and recurrence status in OSCC patients. C Kaplan–Meier analysis of 5-year recurrence-free survival based on differential expression of ATF3, ATF4, and CHOP.
Table 1 Characteristics and survival analysis of patients with OSCC who underwent surgery followed by adjuvant cisplatin-based CCRT.Patients were followed for a median of 53.7 months (range: 4.5–106.4 months), during which tumor recurrence occurred in 22 patients (48.9%). Tumor with low CHOP expression were associated with significantly higher odds of recurrence compared to those with high CHOP expression (odds ratio [OR]: 10.267, 95% confidence interval [CI]: 1.143–92.256, p = 0.022). However, this trend was not statistically significant for ATF3 and ATF4 expression levels (ATF3: OR: 1.306, 95% CI: 0.377–4.524, p = 0.673; ATF4: OR: 0.764, 95% CI: 0.237–2.466, p = 0.652). No significant correlations were observed between the expression levels of ATF3, ATF4, or CHOP and other clinicopathological parameters in the cohort. However, a marginally significant association between high CHOP expression and ATF3 expression was observed (p = 0.095) (Table 2).
Table 2 Association analysis between ATF3/ATF4/CHOP expression and clinicopathological factors.The 5-year recurrence-free survival (RFS) rate for the entire cohort was 50.9%. To explore the relationship between clinicopathological factors particularly the expression levels of ATF3, ATF4, and CHOP and their potential impact on survival, we performed univariate analysis. The results showed that ATF3, ATF4, and CHOP expression were not significantly associated with 5-year RFS. Survival curves were generated based on varying expression levels of ATF3, ATF4, and CHOP, but no individual factor reached statistical significance in the univariate analysis. Consequently, we included all variables in the multivariate regression analysis. This analysis identified low CHOP expression as an independent negative prognostic factor for RFS (hazard ratio [HR]: 4.922, 95% CI: 1.415–17.123, p = 0.012) (Table 2).
Comments (0)