
Remember me
This study aimed to revisit previous in-vitro thorium studies on workers and reevaluate their significance against the current International Commission on Radiological Protection (ICRP) models for thorium intake. Thorium concentrations in the urine and blood serum of Western Australian mineral sands workers had previously been interpreted using biokinetic models recommended by the ICRP. These findings revealed significant inconsistencies with those of other monitoring methods, including in-vivo lung counting and personal air sampling. Data on thorium concentrations in the urine and blood serum of workers and their exposure records were extracted from the previously published research and assessed using the Taurus internal dosimetry software application. Inhalation intake parameters such as aerosol particle size and lung solubility were selected to reflect the chronic intake of relatively insoluble mineral sands dust. The literature values for the urinary excretion of thorium by other thorium-exposed workers were also reviewed. Internal dosimetry modelling highlights the sensitivity of urinary thorium excretion as a function of the dust particle size distribution and particle dissolution rate. The timing of urine sample collection is particularly critical during the early years of chronic intake, especially in certain work rosters. The significantly lower urinary thorium concentrations predicted for chronic intake of Type S thorium compounds highlight the need for sensitive analytical techniques for bioassays and a better understanding of non-occupational (environmental) intake. Current ICRP biokinetic models applied to urinary thorium concentrations reported for mineral sands workers and other thorium-exposed workers infer that past doses are likely to be underestimated and are now significant.
Export citation and abstractBibTeXRIS
The significance of internal exposure pathways for workers involved in mineral sands processing and similar industries involving naturally occurring radioactive materials (NORM) is well established (Hewson and Fardy 1993, IAEA 2011, ICRP 2019b, Ralph and Cattani 2022). The processes used to separate the constituent heavy minerals from the mineral sands concentrate have the potential to generate significant airborne dust concentrations and hence, the intake of NORM by workers. Inhalation of thorium series radionuclides is of particular interest as mineral sands deposits contain varying concentrations of the mineral monazite, a rare earth phosphate typically containing 5%–7% thorium and 0.1%–0.3% uranium. The assessment of worker exposure by industry is routinely performed using personal air sampling (PAS) to measure airborne radioactivity concentrations across designated work categories. Exposure time records are used with the mean concentration of the work category to determine individual worker intake over a specified monitoring period. Inhalation dose conversion factors, approved by the local regulatory agency and based on the recommendations of the International Commission on Radiological Protection (ICRP), are applied to the estimated intake to obtain a committed effective dose (referred to hereafter as dose). The conversion factors for naturally occurring radionuclides have changed substantially over time owing to changes in ICRP biokinetic and dosimetric models (Hewson et al 2025). The current approved conversion factors for intake of thorium and uranium series radionuclides by Western Australian mine workers (GWA 2021) are based on those published in the ICRP Dose Viewer (2022).
Initial reports (Hewson 1990, 1997) of annual internal doses exceeding 20 mSv for Western Australian mineral sands workers during the 1970s and 1980s were based on the ICRP Publication 30 assessment protocols (ICRP 1979). Concern about potential high doses led to a series of research studies throughout the 1990s, with a particular focus on investigating the feasibility of in-vivo and in-vitro bioassay studies to better understand the retention and excretion of thorium by workers (Hewson et al 2025). One study (Hewson and Fardy 1993) measured the concentration of thorium in the urine and blood serum of mineral sands industry workers and interpreted the significance of the results against the applicable biokinetic model. The results suggested that chronic intake of thorium was significantly lower than that estimated by PAS, or that the biokinetic model was unsuitable for insoluble thorium-bearing dust, or both. Owing to difficulties in interpreting the significance of the measured urinary thorium concentrations and doubts about the validity of the ICRP 30 model, no further urine bioassay studies have been conducted in the Western Australian mineral sands industry since the early 1990s.
With the publication of the ICRP's occupational intake of radionuclides (OIR) series (ICRP 2015, 2017, 2019a, 2022), there is an opportunity to revisit past bioassay studies and reevaluate the data against current biokinetic models and hence update worker dose records. The objective of this study was to reevaluate past urine and blood serum test results taken over 30 years ago on mineral sands workers using current scientific knowledge, and to assess the feasibility of urine bioassays on the contemporary mineral sands workforce and other mine workers exposed to NORM (e.g. workers involved with rare earth, tantalum, or zircon processing).
The bioassay data were extracted from the paper by Hewson and Fardy (1993), including job category, time since start of intake (i.e. employment period), mean daily thorium intake estimated from historical and retrospective exposure records, and the predicted urinary thorium concentration based on ICRP 30 (1979). Hewson and Fardy detailed the methods used for the exposure assessment, sample collection, and sample processing. Additional data collected, but not originally reported, were from the worker's site, which were obtained from archived records. A code was used to anonymise the company and site locations; notably, three of the five sites involved in earlier bioassay studies are no longer operating. The urinary thorium concentration for the worker designated as Worker Code 2 (210 ng l−1, table 3, Hewson and Fardy 1993) was excluded as anomalous owing to substantial inconsistencies in PAS intake, exposure time, serum thorium and other workers' results from the same site (site A). The elevated urinary thorium concentration may have resulted from external contamination during sample collection or undisclosed prior work in another NORM-related industry.
The original ICRP 30 model predictions were calculated using the GENMOD-PC computer code (Johnson and Carver 1981) assuming chronic inhalation of 10 µm activity median aerodynamic diameter (AMAD), Class Y (low solubility) 232Th at the estimated mean daily intake. The selection of a particle size of 10 µm AMAD was based on personal cascade impactor measurements obtained from mineral sands workers during the period of interest (Meunier 1990, Koperski 1993).
Updated model predictions were calculated using the Taurus internal dosimetry software application (UK Health Security Agency 2024) based on the ICRP OIR series of publications (ICRP 2015, 2017, 2019a, 2022). The software models the ingrowth of progeny following intake of the parent radionuclide, so dose from progeny is included in the dose estimate for 232Th. The 'prospective calculation' function of Taurus was used with a chronic intake of 10 µm AMAD, Type S (low solubility) 232Th at 1 Bq d−1. An AMAD of 10 µm was considered representative of intake of mineral sands dust in contrast to the ICRP OIR default value of 5 µm. The absorption and respiratory tract parameters were initially selected as the ICRP OIR series defaults unless otherwise noted. Taurus software was used to examine additional aerosol parameters and intake patterns, including work rosters. Microsoft Excel was used to download and analyse data from Taurus and to produce excretion curves as a function of intake. Polynomial functions were fitted to the excretion curves to estimate 232Th intake from the worker's bioassay test result (i.e. daily urinary thorium excretion) and exposure duration at the time of measurement. For an individual worker, the estimated daily 232Th intake from the bioassay result was obtained by comparing the measured excretion with the predicted excretion curves generated by Taurus at 1 Bq d−1 for the exposure period (i.e. time since the start of intake).
Studies of thorium in the urine of workers exposed to thorium dust were obtained from a literature search (Hewson et al 2025) to compare the results from these studies with the Western Australian mineral sands industry data.
Additional factors considered were the daily urinary volume and the expected thorium concentration from dietary intake. The ICRP publication on the Reference Person (2003) refers to a daily volume of urine of 1.6 l d−1 for males; however, a value of 1.4 l d−1 was used in the earlier Hewson and Fardy study (1993). The recommended 1.6 l d−1 volume corresponds to the reference male body weight of 73 kg. The Australian Bureau of Statistics (ABS 2012) reported an average weight of 86 kg for an Australian male (>18 years), with males aged 45–54 years having an average weight of 89 kg. The ICRP (2003) references a general formula for relating urine volume to weight as follows: 22 ml of urine per kg of body weight. Hence the more appropriate value for Western Australian mineral sands workers of 1.9 l d−1 (i.e. 36% greater than the previously used value) was used, resulting in an increase in estimated daily thorium intake.
In relation to dietary intake, there are no quantitative data on daily thorium intake in Australians. An ingestion value for the reference person of 3 µg d−1 (0.012 Bq d−1) (ICRP 1975) was assumed for the model predictions of non-occupational (environmental) exposure, together with a daily urinary volume of 1.9 l d−1. An absorption parameter for the ingested material (fa) of 5 × 10⁻³ (Roth et al 2005) was used in the calculations on the basis of urinary thorium excretion data from adults who were not occupationally exposed. This was a variation from the ICRP default of 5 × 10⁻⁴, which is a generic value assigned to all actinides other than uranium (ICRP 2017).
3.1. Past bioassay data for Western Australian mineral sands workersThe original thorium concentrations measured in the urine of Western Australian mineral sands workers are shown in figure 1. Each data point represents an individual worker and three curves are shown: the original ICRP 30 curve and two ICRP 130 curves calculated using Taurus software. All curves are related to the chronic inhalation of Class Y/ Type S thorium at 1 Bq d−1. The curves denoted 'ICRP130 5 µm' and 'ICRP130 10 µm' correspond to annual committed effective doses of 20 mSv and 9.5 mSv, respectively, based on the 232Th inhalation dose coefficients (5.4 × 10⁻² and 2.6 × 10⁻² mSv Bq−1, respectively) published by ICRP (2022).
Figure 1. Urinary thorium excretion by Western Australian (WA) mineral sands industry (MSI) workers. Model estimates based on chronic intake of 1 Bq d−1. Reproduced with permission from Hewson and Fardy (1993).
Download figure:
Standard image High-resolution imageFigure 1 shows many workers above the 1 Bq d−1 intake curve (solid line) based on their daily urinary excretion, with nearly all having less than 5 years of employment in the industry. It is also apparent that some workers are predicted to have incurred annual doses in excess of 20 mSv (dotted line) over their employment period.
A summary of thorium concentrations in the urine and serum of Western Australian mineral sands workers is presented in table 1. The data are based on those reported in table 3 of Hewson and Fardy (1993) but are now grouped by mineral sands site and a predicted value based on the revised ICRP biokinetic model. The measured urinary thorium values confirmed that very low levels of activity were excreted following chronic exposure to monazite dust.
Table 1. Summary of past bioassay data for mineral sands workers (samples collected in 1992). Reproduced with permission from Hewson and Fardy (1993).
Site CodeaNo. testsMean intake periodb, dMean Th intake PASc, Bq d−1Mean predicted urinary Thd, ng l−1Mean measured urinary Th, ng l−1Mean measured serum Th, ng l−1Th in urine to serum pool, %A414330.268353555.7B811260.561476—n/aC827880.4927379812.9D523510.2613304324.1E813520.7320233744.7ALL3318070.5018425854.1⩾1 kBqe1031020.7636418443.9<1 kBq2311890.3910424304.3aEach site is a mineral separation plant located in Western Australia. bThe intake period is the employment period in the mineral sands industry up until the time of the bioassay test. cAs per Hewson and Fardy (1993), 232Th intake is based on reported personal air sampling (PAS) data and assumes secular equilibrium in monazite dust. No account has been taken of any protective effect by use of respirators. dPredicted by applying the estimated 232Th daily intake (from PAS) and assuming chronic inhalation of 10 μm AMAD aerosol of Type S (c.f. Hewson and Fardy predictions using ICRP30 and Class Y). Refer figure 1. All other intake parameters as per ICRP OIR default values. eTotal 232Th intake from PAS.
The table also includes two additional rows to assess trends between higher total intakes, and typically longer exposure periods, with lower total intakes. A significant difference in predicted versus measured urinary thorium concentrations was noted between workers with estimated 232Th intakes >1000 Bq over their employment period and those with intakes <1000 Bq (table 1). The long-term workers (average intake time of 8.5 years) had measured urinary thorium values close to those predicted, while the short-term workers (average intake time of 3.3 years) showed the opposite trend (i.e. measured is about four times the predicted).
The estimated daily 232Th intake for each worker was determined by applying the best fit regression line for each Taurus-generated curve to the urinary thorium measurement and the chronic intake period (te). The ICRP 130 excretion curves are characterised by polynomial functions as per the following equations:
ICRP 130, 10 µm curve: daily urinary Th excretion = −5.34 × 10⁻²⁰× te4 + 1.25 × 10⁻¹⁵× te3–9.97 × 10⁻¹²× te2 + 1.63 × 10−07× te + 5.60 × 10−05 (r2 = 1.00)
ICRP 130, 5 µm curve: daily urinary Th excretion = −1.03 × 10⁻¹⁹× te4 + 2.42 × 10⁻¹⁵× te3–1.91 × 10⁻¹¹× te2 + 3.09 × 10−07× te + 8.49 × 10−05 (r2 = 1.00)
The model excretion rates in Bq d−1 are converted to ng l−1 by dividing by the daily urinary volume (assumed at 1.9 l d−1) and the specific activity of 232Th (4.07 × 10−06 Bq ng−1).
Figure 2 shows the urinary thorium concentration for workers at each site as a function of their cumulative thorium intake derived from PAS measurements. This analysis highlights considerable inter-worker variability in thorium excretion among workers with similar intakes, likely reflecting differences in individual work and hygiene practices as well as potential issues with PAS protocols and work category assignments.
Figure 2. Concentration of thorium in urine versus total thorium intake estimated from personal air sampling (PAS) by mineral sands industry site.
Download figure:
Standard image High-resolution imageFigure 3 highlights the change in the ratio of urine bioassay to PAS intake estimates for individual workers when comparing the ICRP 30 and 130 models assuming inhalation of a 10 µm AMAD aerosol. The current (ICRP 130/137) dosimetric and biokinetic models for thorium inhalation produce intake estimates that are more closely aligned to the intakes obtained from PAS measurements. However, there remains a significant discrepancy for workers with less than 4 years of intake. The current biokinetic model provides an average ratio of the intake derived from bioassay to that derived from PAS of 2.5, whereas the average ratio using the ICRP 30 model was 0.19 (i.e. 5.3 times lower based on PAS data).
Figure 3. Ratio of thorium intake predicted from bioassay measurement to intake predicted from personal air sampling (PAS) for Western Australian mineral sands workers using past (ICRP30) and current (ICRP130) models.
Download figure:
Standard image High-resolution image 3.2. Accounting for work roster (shift cycle)The Taurus internal dosimetry software does not directly allow the prospective calculation of bioassay predictions for chronic intakes based on extended work-cycle rosters, as is commonly encountered in mining operations. The ICRP models do not address this issue; hence, it is assumed that chronic intake is the average daily intake over the exposure period (time employed before sample collection). This assumption does not account for the lack of exposure to radionuclides during the days away from work over the employment period. However, the effect of the work cycle on bioassay predictions can be determined indirectly by mathematically repeating a work–rest intake function over many cycles and summing the results for each day. Figure 4 shows the results for urinary excretion of thorium following intake of a 10 µm AMAD, Type S aerosol at 1 Bq d−1 for a typical mining industry roster of 8 d (x12 h shifts) on and 6 d off. The pronounced variations in urinary thorium excretion rates throughout the roster cycle from the commencement of exposure emphasise the importance of sample collection timing. The day of urine sample collection becomes less important after several years of chronic intake. However, in the first 3 years of intake, the day the sample is collected is important depending on the work roster, since estimated thorium excretion rates may vary up to two-fold over the start and end of the work cycle.
Figure 4. Daily urinary thorium excretion following intake of 10 µm AMAD, Type S 232Th at 1 Bq d−1 over an 8 d on, 6 d off work roster (extrapolated using Taurus internal dosimetry software).
Download figure:
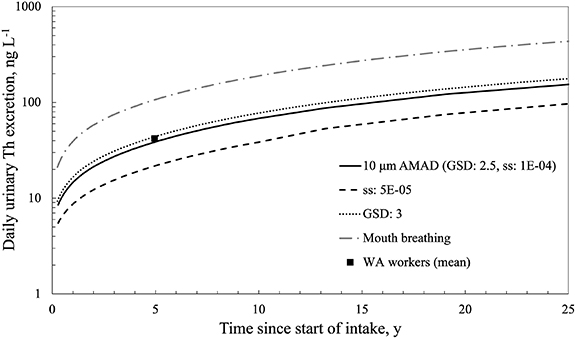
Standard image High-resolution image 3.3. Impact of altering ICRP OIR default parameter valuesTable 2 lists the impact of changing some of the ICRP OIR default parameters on the estimated dose to a mineral sands worker with the mean daily urinary excretion of thorium (42 ng l−1) after the mean chronic intake period (4.95 years), as per table 1. The first row of the table represents the ICRP model output using default parameter values, i.e. chronic intake of a 5 µm AMAD, Type S 232Th aerosol by a nose breather. The other rows in the table show the effect of altering some of the parameter values. The alternative value for the dose coefficient was obtained from the Taurus software, while the estimated daily intake of 232Th was extrapolated from the prospective urine bioassay curves downloaded from the Taurus software. Figure 5 shows the urinary excretion curves for chronic intake of 1 Bq d−1 of 10 µm AMAD, Type S 232Th following adjustment to various aerosol and breathing parameters. The estimated annual dose resulting from the intake is the product of the daily intake, the intake period (365 d) and the dose coefficient.
Figure 5. Differences in urinary thorium excretion following chronic intake of 10 µm AMAD, Type S 232Th and changing ICRP OIR default parameter values. The solid line is for 10 µm AMAD and default absorption parameters. The mean result for 33 Western Australian (WA) workers also shown.
Download figure:
Standard image High-resolution imageTable 2. Impact of alternate ICRP OIR parameters on the estimation of daily intake and annual dose from a specified urine bioassay value.
ICRP OIR ParameterDefault valueAlt. valueDose Coeff., mSv Bq−1Est. 232Th intakea, Bq d−1Est. 232Th doseb, mSv y−15 µm AMAD, Type S 232Th intake 0.0540.5210Particle size, AMAD5 µm10 µm0.0261.110Slow dissolution ratec, ss1 × 10−04 d−15 × 10−05 d−10.0372.027Aerosol GSDd2.53.00.0300.9611Mode of breathingNoseMouth0.0700.4010aEstimated from figure 5, based on mean result of 42 ng l−1 at 4.95 years. bEstimated from daily intake, chronic intake duration and applicable dose coefficient. cICRP does not assign material-specific absorption parameters to Type S thorium materials. However, ICRP notes (p351, 2017) that absorption could be even lower than assumed based on experimental data for thorium dioxide. dPast personal cascade impactor measurements at mineral sands plants typically indicated GSDs of 3 or more (Meunier 1990, Koperski 1993).
Altering the ICRP OIR default parameter values had a significant impact on the expected urinary excretion of thorium following chronic intake, especially a change to the slow dissolution rate (ss) or mode of breathing. A two-fold reduction in ss resulted in the estimated dose increasing by nearly three-fold.
3.4. Literature values for urinary thorium excretion by NORM workersA summary of literature values of reported urinary thorium concentrations for other NORM workers exposed to thorium-bearing dusts is presented in table 3. This is an update to table 4 in Hewson and Fardy (1993). Only studies published since 1980 were included, as earlier studies were less useful because of the relatively high detection limits associated with the analytical methods and equipment available at the time.
Table 3. Literature values for thorium in urine of occupationally exposed workers.
Exposure situation, countryExposure perioda, yNo. of testsThorium concentration (ng l−1)ReferenceMeanbRangeMonazite plant, Brazil>15–259550<250–1770Lipsztein et al (1989)Thorium refinery, India10–32520081–322Dang et al (1992)Mineral sands, Australia1–1634503–210Hewson and Fardy (1993)Mineral sands, IndiaNS3423639–552Paul et al (1998)Mineral sands, India10–2515295150–502Pillai et al (2001)Monazite processing, India5–1712397143–587Pillai et al (2001)Niobium mine, BrazilcNS9—<160–3340Dias da Cunha et al (2002)Monazite sand plant, BrazilNS29—<74Lipsztein et al (2003)Niobium mine, BrazildNS66111<80–2120Julião et al (2007)Rare earth mining, ChinaeNS6960*18–906Zhang et al (2022)aNS—Not stated. bMedian value denoted by *. cSix samples were below the detection limit of 160 ng l−1. d39 tests on non-exposed persons were all below the detection limit of 80 ng l−1. e10 tests on non-exposed persons returned a median value of 32.4 ng l−1 (range: 16–282 ng l−1). Note:Excluding earlier studies where urinary thorium concentrations were all below the detection levels of traditional techniques. Studies on thorium gas mantle workers were excluded.
4.1. Reinterpretation of past mineral sands bioassay dataFigure 1 illustrates that the predicted urinary excretion rates of inhaled 232Th derived from the ICRP 130 model were at least an order of magnitude lower than those predicted by the ICRP30 model. Past analyses of the bioassay data concluded that inhaled doses based on measured urine values (i.e. daily 232Th excretion) were much lower than expected based on industry PAS measurements (Hewson and Fardy 1993). However, the point was made, based on comparison with airborne activity data, that the then ICRP metabolic model was likely incorrect in relation to thorium ore dust avidly retained in the lungs. Similar conclusions were reached by other authors (Lipsztein et al 1989, Dang et al 1992, Riedel and Eisenmenger 1999, Stradling et al 2001). The implication of the much lower excretion of thorium in urine is that the radiation dose to the lung is higher due to the significantly longer clearance half-time.
Based on re-assessment of the urine bioassay tests (figure 1), seven of the mineral sands workers were estimated to have received annual internal doses >20 mSv over their employment period, and four workers were from the one site (site B). Fourteen workers were estimated to have received annual doses >10 mSv for each year of their employment. The revised bioassay estimates of daily intake of 232Th (mean = 1.1 Bq d−1) from this study are in stark contrast to the earlier Hewson and Fardy study (figures 1, 1993) where the chronic intake for most workers was assessed as being less than 0.1 Bq d−1.
The summary data in table 1 raise some interesting questions. Sites C and E demonstrated reasonable alignment between the measured and predicted urinary thorium values, particularly given the uncertainties in PAS measurements, biokinetic modelling, and human variability. Both sites A and B had significantly greater average measured values from the bioassay (4.4–5.4x) than those predicted by PAS. These sites were geographically separate (500 km apart) but operated by the same company. This suggests that the PAS strategy at the time may not accurately represent actual worker exposure conditions. Site E had measured values very close to the predicted values; however, it was noted that this site had a formal respiratory protection program in place for dusty tasks and hence actual intakes were expected to be lower.
PAS strategies were considered more robust and extensive for workers post 1986 compared to those who started work in the 1970s and the early 1980s (Hewson and Terry 1995). However these results indicate the need for a critical review of the appropriateness of sampling and analysis strategies for airborne radioactivity to determine the dose. The PAS strategies employed by the Western Australian mineral sands industry have remained unchanged since the earlier bioassay work (Ralph et al 2020). The variability in the inter-worker and inter-site results in figures 1, 2 and table 1 underscore the potential issues with the PAS strategy, warranting further investigation. Some workers with ostensibly similar intakes derived from PAS have nearly an order of magnitude difference in urinary thorium excretion (figure 2). Individual differences in mode of breathing, metabolism and personal hygiene practices will likely contribute to variations in intake, and these factors are not accounted for in intake assessments based on PAS.
The mean percentage of thorium in urine compared to thorium in blood serum (table 1) showed that Site A, with an average intake period of 3.9 years, had a higher percentage (5.7%) than the other sites. Sites C and D, where the average intake periods were longer (7.6 years and 6.4 years, respectively), had lower percentages of 2.9% and 4.1%, respectively. The overall mean percentage across all sites was 4.1%, which was below the current ICRP model value of 6.3%. A potential reason for this difference could be related to the very low solubility of inhaled mineral sands dust particles, which are retained in the lungs and the lymphatic nodes for longer, reducing their translocation to blood. The difference could also be due to the assumptions about daily urinary flow volume, thorium association with serum versus total blood, serum volume, environmental intakes, and individual metabolic rates. The timing of sample collection is also important as shown in figure 4. Urinary creatinine was not measured in the previous bioassay study, and such measurements allows normalisation of thorium concentrations to account for variability in urinary flow rates (Marco et al 2008). Future urine bioassay should include measurement of creatinine as recommended by ICRP (2015) and IAEA (2018). Future blood bioassay could investigate the partitioning of thorium between whole blood and serum to determine if this is a factor.
A reassessment of the bioassay data revealed that the measured urinary thorium values are now more aligned with the ICRP 130 model predicted values from PAS (figure 3) than was concluded in the original study by Hewson and Fardy (1993), who used the ICRP 30 model for thorium. The new model provides values of the same order, which implies that the previous internal radiation doses calculated from PA
Comments (0)