
Remember me
The specific pathogen-free grade mice (SPF) grade mice, including ICR, C57BL/6n, DBA/2, 129S1/SvlmJ, BDF1, SCID and Oct4-ΔPE-EGFP (OG2) transgenic mice were housed in the animal facility at Tongji University, Shanghai, China. The BDF1 hybrid mice (8–10 weeks old) were obtained by mating male DBA/2 mice with female C57BL/6n mice. All the mice had free access to water and food. All experiments were approved by the Biological Research Ethics Committee of Tongji University and performed following the University of Health Guide for the Care and Use of Laboratory Animals.
Establishment of mESCMouse embryonic stem cells were generated as previously described (Zhang et al., 2020). The female 129S1/SvlmJ mice (6–8 weeks) were intraperitoneally injected with PMSG (5–6 IU, S160106, San-Sheng Pharmaceutical Co.Ltd) and hCG (6–7 IU, B151104, San-Sheng Pharmaceutical Co.Ltd), and then mated with male Oct4-ΔPE-EGFP (OG2) transgenic C57BL/6n mice. Then we collected the 2-cell embryos from the oviducts of the mated female mice at 1.5 days post coitum (d.p.c.) and cultured them in G1 PLUS medium (10136, Vitrolife) until the blastocyst stage. The OG2-positive blastocysts were then randomly individually plated in each well of 96-well plates coated with feeders (mitomycin C-treated MEFs) and were cultured for the expansion of outgrowth. After 6–8 days, the cells were dissociated using 0.25% Trypsin-EDTA (TE, 25200056, Thermo Fisher Scientific) and passaged into 48-well plates (p1, passage 1), followed by a second passaging into 24-well plates (p2) and another third passaging into 6-well plates (p3). The established mESC lines at p3 were genotyped to determine sex. Used primers are listed in Data S5. All the embryos and cells were cultured at 37 °C with 5% CO2.
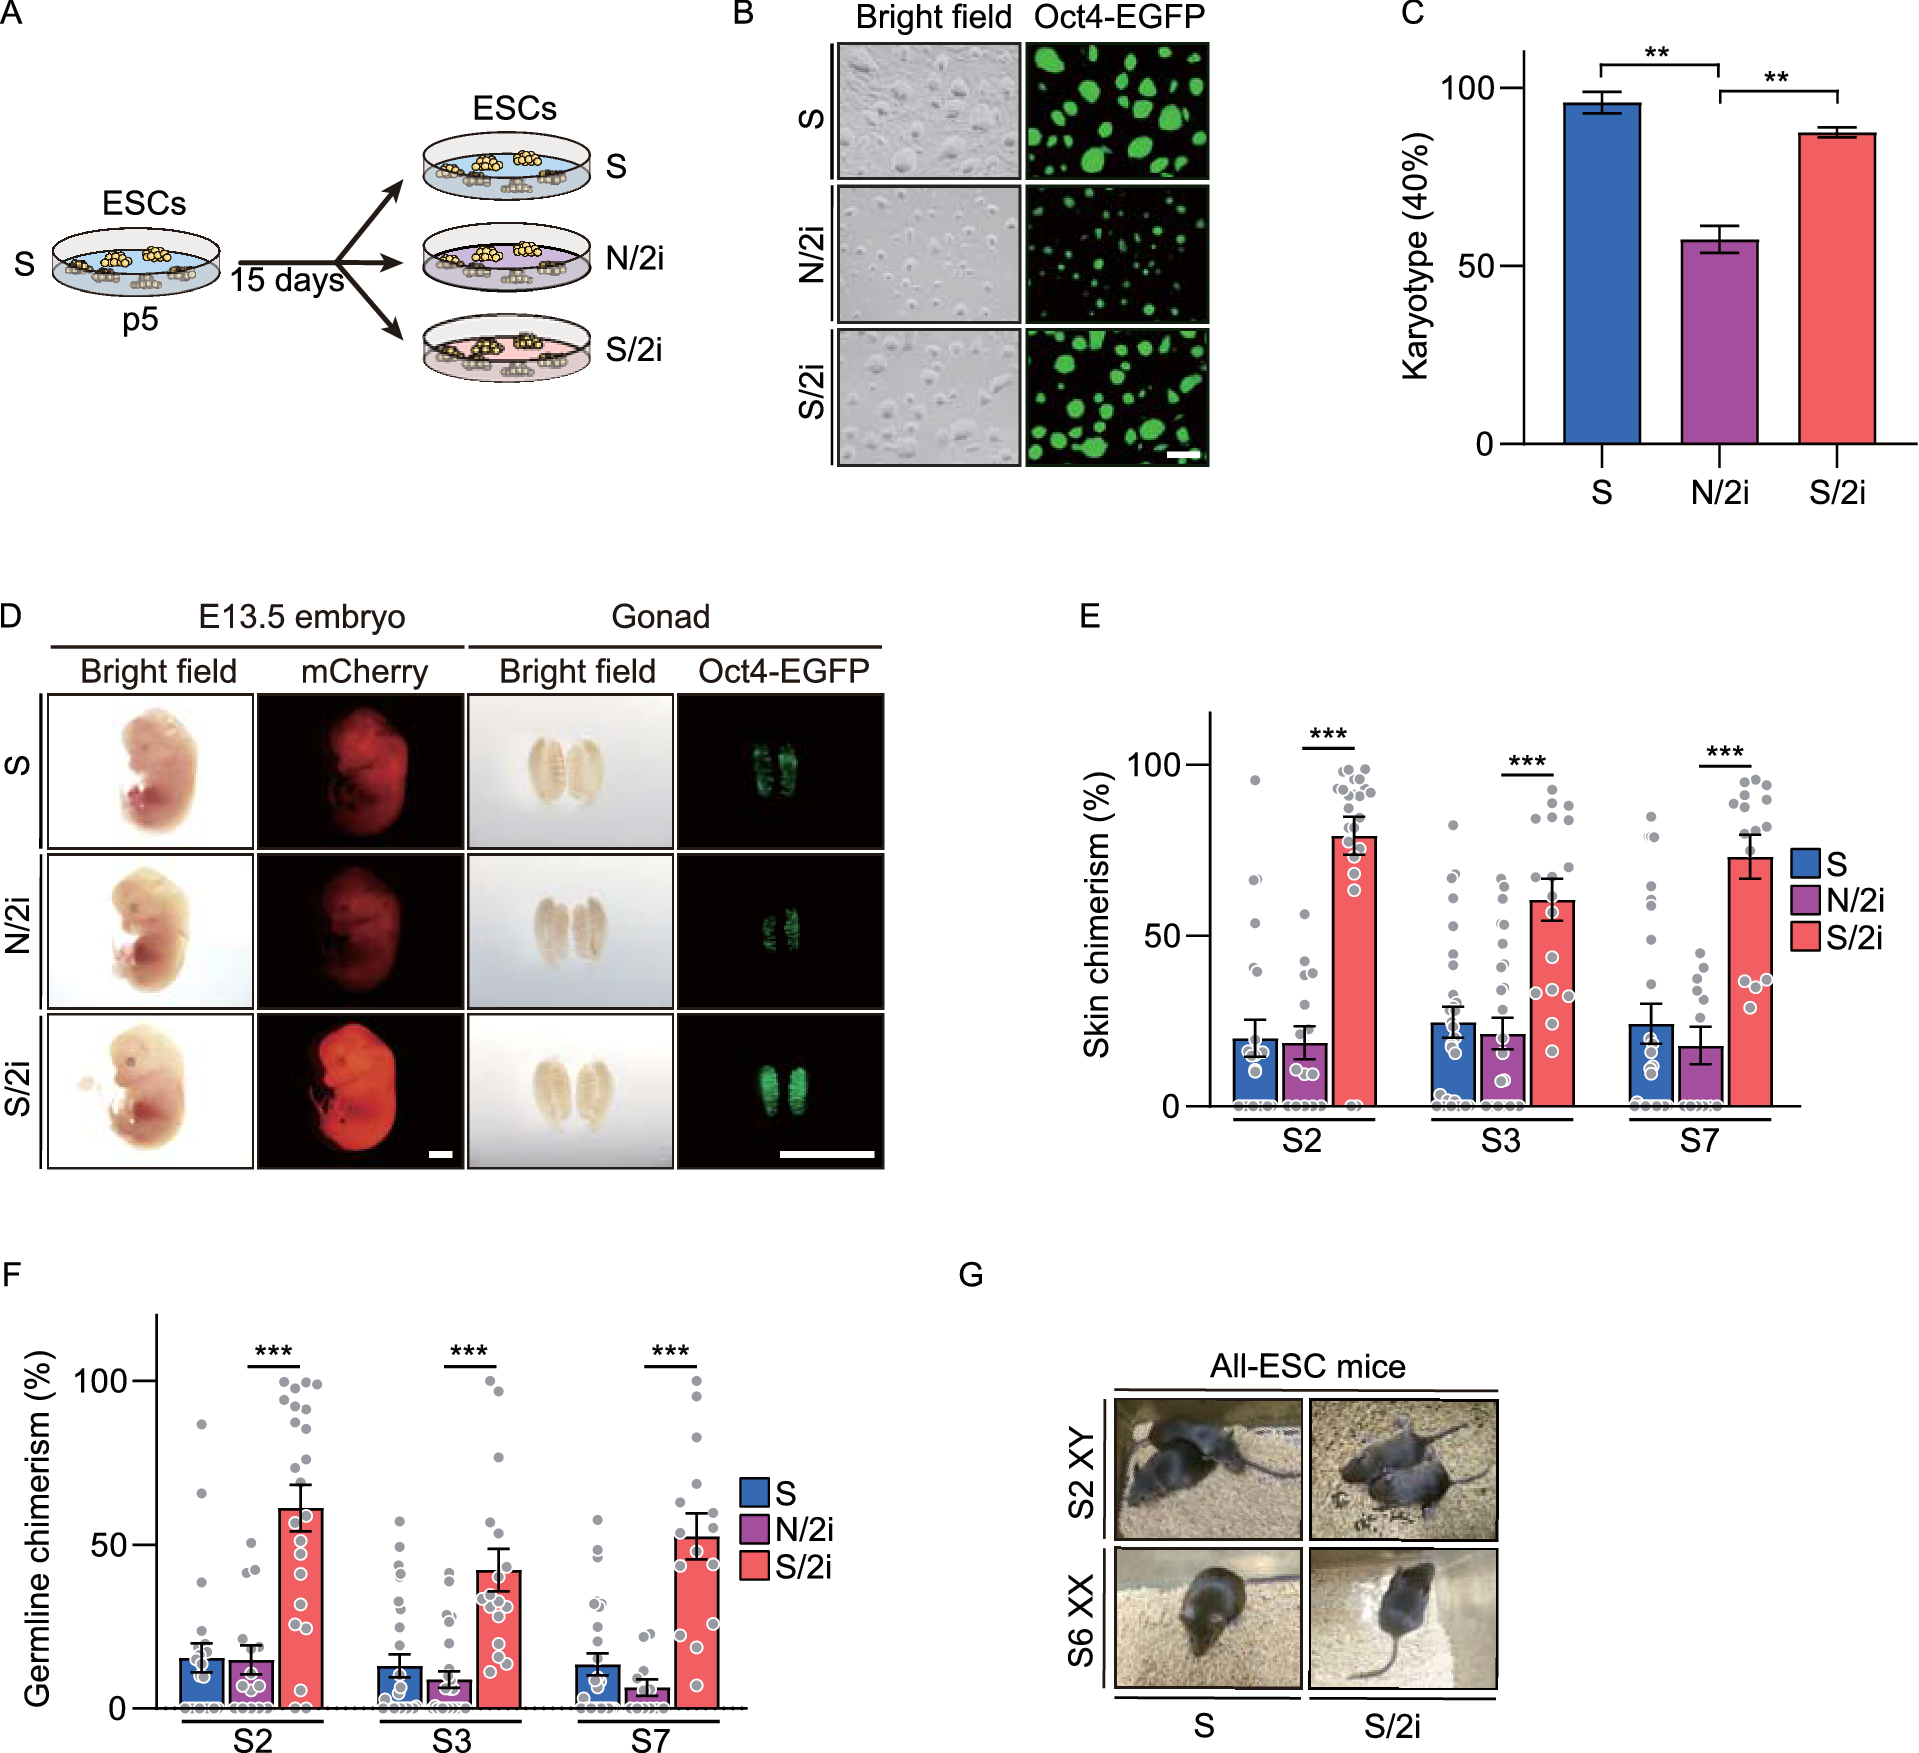
Culture of mESCS-mESCs were established and maintained on feeders in canonical serum-containing medium (S medium) including knockout DMEM (10829, Gibco) with 15% fetal bovine serum (FBS, 16000044, Gibco), 1 mmol/L L-glutamine (25030164, Thermo Fisher Scientific), 100× nucleosides (M6250, Sigma-Aldrich), 100× NEAA (TMS-001, Millipore), 0.11 mmol/L 2-mercaptoethanol, 103 U/mL LIF (ESG1107, Millipore) and 100× penicillin/streptomycin (15140122, Gibco). S/2i-mESCs were converted from S-mESCs and further cultured over 15 days on 0.3% gelatin-coated plates in S medium supplemented with 1 μmol/L PD0325901 (S1036, Selleck) and 3 μmol/L CHIR9902 (S1263, Selleck). N/2i-mESCs were converted from S-mESCs and further cultured over 15 days on 0.3% gelatin-coated plates in serum-free chemically defined medium (N medium) supplemented with 1 μmol/L PD0325901 and 3 μmol/L CHIR9902, termed as N/2i medium. N medium includes DMEM/F12 (11320033, Gibco) and Neurobasal (21103049, Gibco) (1:1), 1% N2 (17502048, Gibco), 2% B27 (17504044, Gibco), 1 mmol/L L-glutamine, 0.11 mmol/L 2-mercaptoethanol, 1000 U/mL LIF, 100× penicillin/streptomycin. N/2i + BMP4-mESCs were cultured on 0.3 % gelatin-coated plates in N/2i medium supplemented with 10 ng/mL BMP4 (315-27, Peprotech). N/a2i-mESCs were cultured on 0.3% gelatin-coated plates in N medium supplemented with 1.5 μmol/L CGP77675 (SML0314, Sigma), 3 μmol/L CHIR9902. N/t2i-mESCs were cultured on 0.3% gelatin-coated plates in N medium supplemented with 0.2 μmol/L PD0325901, 3 μmol/L CHIR9902.
Generation of mCherry-labeled mESCsThe coding sequence of mCherry was cloned and inserted into the FUGW vector to generate the FUGW-mCherry vector. FUGW-mCherry vector was extracted and purified using an EndoFree Plasmid kit (CoWin Biotech Co., Beijing, China). For the generation of lentivirus, 293T cells were transfected with individual vectors combined with psPAX2 and pMD2.G packaging plasmids (5:3:2) using Vigofect (Vigorous Biotechnology Beijing Co., Ltd.). The supernatants containing the virus were collected after 48 h, filtered through a 0.45 mm filter (Merck Millipore), and concentrated by PEG-8000 according to the standard protocols. After concentration, the viruses were resuspended in the corresponding medium, and 2 × 10⁴ mESCs were infected. After 8–10 h viral infection, the cells were washed with PBS and cultured using fresh media. PCR was used to detect exogenous gene integration. mCherry-labeled mESCs could be purified by MoFlo XDP cell sorter (Beckman Coulter).
Generation of Ube2s and Chmp4b knockdown or overexpressed mESCs and Zbtb7a overexpressed mESCsThe sequence encoding Ube2s and Chmp4b shRNA was constructed into the vector PLVshRNA (2A)-Puro (VL3104, Inovogen Tech.Co.) and PLKO-Tet-On shRNA (Novartis) for consistent knockdown and inducible knockdown, respectively. The sequence encoding Ube2s, Chmp4b and Zbtb7a was constructed into the vector lenti-EF1α (gift from Bing Zhu Lab, IBP, China). Then the constructed vectors and the scramble vector were separately introduced into mESCs through lentivirus infection as described above. The infected mESCs were further purified by FACS or puromycin screen. PCR was used to detect exogenous gene integration. And the gene expression levels were also detected. A list of the primers used is provided in Data S5. For the inducible knockdown, expression of Ube2s and Chmp4b were validated after Dox (1 μg/mL) induction. The Ube2s and Chmp4b shRNA sequences are listed in Data S5.
Teratoma assaymESCs were trypsinized for single cell suspension in 250 µL of PBS and 1 × 10⁶ cells were injected subcutaneously into the groin of a female SCID mouse. Four weeks post-injection, tumors were dissected and processed for hematoxylin-eosin (HE) staining by Servicebio Co.Ltd.. Finally, the tumor sections were blindly scored for the presence of each germ layer.
Chimera assay and fluorescence-activated cell sorting (FACS) based analysismCherry labeled Oct4-EGFP+ mESCs were firstly trypsinized and resuspended in FACS buffer (PBS with 2% FBS) to sort mCherry- and EGFP-double positive population by MoFlo XDP cell sorter (Beckman Coulter). Mouse chimera assay was performed as previously described (Chen et al., 2015b). The ICR blastocysts were collected as described above (Establishment of mESC). 10–15 double-positive mESCs were microinjected into a blastocyst using a piezo-actuated microinjection pipette. The manipulated embryos were then transplanted into the uteruses of 2.5 d.p.c. pseudo-pregnant ICR mice. Next, pregnant female ICR mice at 13.5 d.p.c were sacrificed and the uteri were dissected. The chimeric embryos were carefully freed from the myometrium using properly sharpened forceps (3110, Sigma) and imaged with the same exposure intensity by Olympus SZX16 stereo zoom microscope. Besides, gonads were carefully isolated and imaged for EGFP and mCherry signaling. Then tissues from the hindneck and gonad were cut up and further dissociated for analyzing the percentage of EGFP+ and mCherry+ cells by CytoFLEX S (Beckman Coulter). To eliminate the interference of supporting cells and get the authentic germline chimerism, we used the calculated ratio for germline comparison. The germline chimerism = “the percentage of Oct4-EGFP+ cells in E13.5 chimeric gonad” / “mean of the percentage of E13.5 OG2 gonads (n = 11, mean = 20.258%)”.
Tetraploid embryo complementation (TEC) assayThe TEC assay was performed as previously described (Chen et al., 2015b). In short, to produce tetraploid embryos, the late 2-cell stage embryos were first electro-fused and then cultured until 8-cell or morula stage. Then 10–15 individual mESCs were sandwiched between two tetraploid embryos (8-cell or morula stage). After 24 h of culture in G1 PLUS medium, the reconstructed blastocysts were transplanted into the uterus of 2.5 d.p.c. pseudopregnant ICR mice. We carried out the cesarean section at 19.5 d.p.c. and used lactating ICR mice to foster the pups. Meanwhile, some of the recipient pseudopregnant mice were able to deliver full-term pups by themselves. We termed pups “full-term”, “breathing”, and “adult” when they reached the full-term (E19.5), established autonomous respiration after birth, and survived over 5 weeks, respectively. Simple sequence polymorphism (SSLP) analysis was performed (detection site: D2Mit102, D8Mit94 and D11Mit236) to confirm these mice were truly TEC mice. Then adult TEC mice were further mated with ICR mice for the examination of germline transmission competence. The PCR primers for SSLP analysis are listed in Data S5.
Reverse transcription and reverse transcription quantitative-PCR (RT-qPCR)For RT-qPCR analysis of indicated mESCs in this study, total RNA was purified using Trizol reagent (Takara) and reverse-transcribed using 5× All-In-One RT Master Mix (G492, ABM) according to the manufacturer’s recommendations. RT-qPCR was performed using SYBR Premix Ex Taq II (RR820B, Takara) and signals were detected with ABI7500 Real-Time PCR System (Applied Bio Systems). The cDNA was diluted 1:10 in nuclease-free ddH2O and then used in RT-qPCR analysis. Hypoxanthine-phosphoribosyl-transferase gene (Hprt) was used as an endogenous control. Primers are listed in Data S5, and all the primers were synthesized at Genewiz Co. Ltd..
Immunofluorescent stainingmESCs cultured on cover slides (Biobest) were fixed in 4% paraformaldehyde (PFA) for 30 min and then permeabilized for 15 min with 0.3% Triton X-100 (T8532, Sigma). The slides were blocked with 2.5% bovine serum albumin (BSA) (Sigma) for 1 h at room temperature and incubated with primary antibodies against γH2A.X (9718S, Cell Signaling Technology) overnight at 4 °C. The cells were then washed three times with PBS and incubated with secondary antibodies conjugated to Alexa Fluor 488 for 1 h at room temperature. The nuclei were stained with 4,6-diamidino-2-phenylindole (DAPI) for 15 min at room temperature. The glass coverslips in the glass slide were observed with a ZEISS LSM880 confocal microscope. The captured images were processed and quantified with ZEISS Zen blue edition.
EdU and 5-EU incorporation assayFor EdU incorporation assay, cells cultured in different conditions were independently treated with EdU (10 μmol/L) for 40 min. Then cells were harvested for fixation, permeabilization, and the Click-iT reaction using Azide 647. Hoechst was used for DNA count staining following the manufacturer’s instructions (BeyoClick™ EdU Cell Proliferation Kit with Alexa Fluor 647, C0081S, Beyotime). Next, cells were analyzed using a Beckman Coulter CytoFLEX S flow cytometer. For 5-EU incorporation assay, cells were treated with 5-EU (1 mmol/L) for 1 h. After fixation and permeabilization, the cells were stained for Alexa Fluor 647 azide (A10277, Invitrogen) and DAPI following the manufacturer’s instructions (Click-iT RNA Imaging Kits, C10329, Invitrogen) and analyzed by ZEISS LSM880 confocal microscope. The captured images were processed and quantified with ZEISS Zen blue edition.
Karyotyping and G-band karyotype analysisThe karyotype analysis had been described in the previous report (Zhang et al., 2020). Briefly, mESCs were cultured in a corresponding medium with 0.25 μg/mL colcemid (Invitrogen, Thermo Fisher Scientific) for 2.5 h and dissociated and collected with 0.05% Trypsin-EDTA. Then we incubate the cells in a hypotonic solution containing 0.4% potassium chloride and 0.4% sodium citrate at 37 °C for 5 min. After fixed with a methanol/acetic acid mixture (3:1, v/v), the cells were mounted on coverslips waiting to dry, and then stained with Giemsa at 37 °C for 15 min. The chromosome number of the separated nucleus was counted under an inverted microscope (Leica). For each sample, at least 20 nuclei were analyzed. G-band karyotype analysis of the mESCs was performed at KingMed Diagnostics Group Co., Ltd.
Western blot1 × 106 cells were harvest and resuspended in 40 μL 2× protein loading buffer supplemented with 5% β-mercaptoethanol (Amersham, CT) and 40 μL 2× proteinase inhibitor (PI) (k1007A, pexBio). Then the suspensions were boiled at 99 °C for 10 min to denature protein. Prepared proteins were separated by 10% vertical SEMS-polyacrylamide gel (PG112, EpiZyme) based on the different molecular size. The separated proteins were then transferred to a PVDF membrane at 200 mA, 2 h. Next, the membrane was blocked with protein free rapid blocking buffer (PS108, EpiZyme) for 1 h at room temperature and then incubated with primary antibodies overnight at 4 °C on a shaker and with second antibodies at room temperature for 1 h. Last, the protein signals were measured using SuperSignal West Pico PLUS (34580, Thermo Scientific) and visualized with a ChemiDoc MP Imaging System (BioRad). Primary antibodies were used as follows: anti-TUBLIN (T3559, Sigma), anti-UBE2S (14115-1-AP, Proteintech), anti-CHMP4B (13683-1-AP, Proteintech), anti-H2A.X (ab11175, abcam), anti-γH2A.X (9718S, Cell Signaling Technology), anti-ERK1/2 (AF1051, Beyotime), anti-p-ERK1/2 (AF5818, Beyotime).
Enzyme-linked immunosorbent assay (ELISA)We performed ELISA following the manufacturer’s instructions (ERK1/2 (pT202/Y204 + Total) ELISA Kit, ab176660, Abcam). Each group has three experiment replicates, and each replicate was performed using 25,000 cells. Specifically, buffers including 1× Cell Extraction Buffer PTR, 1× Wash Buffer PT, 5× Cell Extraction/Enhancer Buffer PTR and Antibody Cocktail needs to be prepared prior to assay. Cells were trypsinized and centrifuged, then the cell pellet was resuspended in 50 μL 1× Cell Extraction Buffer PTR and transferred to individual wells of a plate. The plate was then incubated for 1 h at room temperature on a plate shaker. Each well was washed by 350 µL 1× Wash Buffer PT for 3 times. Then 100 µL of TMB Substrate was added to each well and incubated for 15 min in the dark on a plate shaker. Finally, 100 µL Stop Solution was added to each well. The plate was shaking for 1 min and the OD was recorded at 450 nm.
Chromatin immunoprecipitation-qPCR (ChIP-qPCR)ChIP-qPCR were performed as previously described (Le et al., 2021). 1 × 10⁴ cells were harvested per reaction and resuspended in nuclear extraction buffer. Chromatin was fragmented for 8 min using MNase at 25 °C, and stopped in 100 mmol/L EDTA solution, then diluted in ChIP immunoprecipitation buffer (20 mmol/L Tris-HCl pH 8.0, 2 mmol/L EDTA, 15 mmol/L NaCl, 0.1% Triton X-100, 0.1% deoxycholate, 1× EDTA-free protease inhibitor cocktail and 1 mmol/L phenylmethanesulfonyl fluoride (Sigma)). Fragmented chromatin was incubated with 1 μg of antibody–bead complexes (10 μL of protein G Dynabeads, Life Technologies) overnight at 4 °C. IPed complexes were washed twice with 200 μL of low salt wash buffer (20 mmol/L Tris-HCl, pH 8.0, 0.1% SDS, 1% Triton X-100, 0.1% deoxycholate, 2 mmol/L EDTA and 150 mmol/L NaCl) and twice with 200 μL of high salt wash buffer (20 mmol/L Tris-HCl pH 8.0, 0.1% SDS, 1% Triton X-100, 0.1% deoxycholate, 2 mmol/L EDTA and 500 mmol/L NaCl). Protein–DNA complexes were eluted in 100 μL of ChIP hot elution buffer (100 mmol/L NaHCO3 and 1% SDS) for 2 h at 65 °C. IPed material was purified by phenol chloroform, ethanol-precipitated. We diluted the purified DNA 5 times for ChIP-qPCR reaction. Primary antibodies were used as follows: IgG (ABIN101961, Antibodies-Online), H3K4me3 (C15410037, Diagenode), H3K9me3 (39161, Active Motif), H3K27me3(C15410195, Diagenode), H3K36me3(ab9050, Abcam), H3K9ac (zb4441, Abcam), H3K27ac (39133, Active Motif). Primers for ChIP-qPCR were listed in Data S5.
RNA-SeqRNA-seq libraries were performed as previously described (He et al., 2018). 200 ng of total RNA calculated by Qubit 2.0 (Invitrogen) was prepared for library construction. RNA-seq libraries were generated using the KAPA Stranded mRNA-Seq kit according to the manufacturer’s manual. In Short, the mRNA was enriched with oligo magnetic beads. Then cDNA was synthesized using random hexamer primers and purified with 1.0× Agencourt AMPure XP beads (Beckman). Finally, the cDNA fragments (approximately 300 bp) linked with sequencing primers were isolated by gel electrophoresis and amplified by PCR. The sequencing was performed by Berry Genomics Co Ltd. using the NovaSeq system developed by Illumina. 2 or 3 biological replicates were analyzed for each treatment condition.
Whole-genome Bisulfite Sequencing (WGBS)WGBS libraries had been described previously (Wang et al., 2018). Genomic DNA was isolated using the Wizard Genomic DNA purification kit. 30 ng of DNA calculated by Qubit was used per reaction. The libraries for sequencing were generated with the Pico Methyl-Seq Library Prep Kit following the manufacturer’s manual. Paired-end 150 bp sequencing was performed on a NovaSeq platform by Berry Genomics Co Ltd..
RNA-seq data analysisAdapter and low-quality reads were trimmed using cutadapt (v1.18) with parameters: -a AGATCGGAAGAGC -A AGATCGGAAGAGC --trim-n -m 50 -q 20,20. reads were aligned to the mouse reference genome (mm10) using hisat2 (v2.1.0) and sorted with Samtools (v1.9). IGV files were generated using bamCoverage from the deeptools suite (v3.1.3) with parameters: --normalizeUsing RPKM--binSize 25. Gene quantification was performed using feature Counts (v1.6.1) with parameters: -p -C -B. The gene counts were normalized using variance stabilizing transformations methods by DEseq2 and subsequently used for Principal component analysis (PCA) and detection of differentially expressed genes (DEGs). Genes with P-values < 0.01 and fold change > 2 were considered as significant DEGs. Gene expression levels (FPKM) were calculated using StringTie and R package ballgown with default parameters.
Functional enrichment analysisGene ontology analyses were performed using two online platforms, GENEONTOLOGY (96-98) and g: Profiler (Raudvere et al., 2019). For each enrichment analysis, we used Benjamini-Hochberg FDR to calculate the Significance threshold. The data sources we used are GO molecular function, GO biological process, KEGG pathway, and TRANSFAC motifs. Enrichment terms for each functional cluster were summarized to a representative term, and P-values or fold change was used to plot. For GSEA analysis, P-values were calculated based on one million permutations. For both types of analysis, pathways were considered significant if the FDR-corrected P-value was ≤ 0.01.
WGBS data analysisAdapter and low-quality sequences were removed by cutadapt (v1.18) as described above. Reads were mapped to a combined genome with mm 10 and 48052 lambda sequence with bsmap (100). The methylation level of each CpG site was estimated using mcall. The methylation level of the same CpG site from multiple replicates was determined using total methylated reads count across replicates versus total reads count across replicates, and CpG sites with less than 3 reads were discarded.
Quantification and statistical analysisMost statistical analyses were performed with GraphPad Prism (GraphPad Software, Inc.) or R (www.r-project.org/). Other specific statistical method was performed as indicated in the manuscript or figure legends. Statistical significance was calculated using a Two-tailed unpaired Welch’s t-test or a Two-tailed unpaired Student’s t-test. ns, not significant. *P < 0.05. **P < 0.01, ***P < 0.001. Regression analysis was also performed by GraphPad.
Comments (0)