
Remember me

Cysteine-rich motor neuron 1 (CRIM1; also known cysteine-rich transmembrane BMP regulator 1; Online Mendelian Inheritance in Man (OMIM) #606189) encodes a type I transmembrane protein that contains an extracellular N-terminal insulin-like growth factor-binding protein motif, six von Willebrand factor type C domains, four antistasin-like domains, a transmembrane domain, and a cytoplasmic C-terminal of 76 residues (Brastrom et al., 2019). The human gene has four isoforms, with the longest isoform containing 17 coding exons (NM_016441.3) and producing a 1,036 amino acid (Aa) protein. Heterozygous deletions predicted to result in haploinsufficiency for CRIM1 have been identified in families with eye defects comprising colobomatous macrophthalmia with an increased axial length of the globe, microcornea, and coloboma of the iris, chorioretinal structures, and optic disc (Toker et al., 2003; Beleggia et al., 2015; Haug et al., 2021). In these families, a deletion of approximately 22 kilobases (kb) that included exons 14 through 17 of CRIM1 was described in a family with microcornea, coloboma of the iris, choroid, retina, and optic disc, increased axial length, myopia, mild cornea plana, and a shallow anterior chamber (Toker et al., 2003; Beleggia et al., 2015). A deletion of approximately 9 kb removing exons 15–17 and the 3′ untranslated region (UTR) of CRIM1 was reported in a family with iris and chorioretinal colobomas and microcornea (Haug et al., 2021). These eye findings are known as colobomatous macrophthalmia with microcornea syndrome (MACOM; OMIM #602499) and are inherited as an autosomal dominant trait (Toker et al., 2003; Beleggia et al., 2015; Haug et al., 2021). Additional ocular findings in MACOM have included staphyloma and increased intraocular pressure (Bateman and Maumenee, 1984; Toker et al., 2003; Beleggia et al., 2015; Haug et al., 2021). The eye defects have shown variable expressivity, affecting eye laterality, axial length, and the severity of colobomas (Bateman and Maumenee, 1984; Haug et al., 2021). There have been no prior reports of pathogenic variants apart from the deletions resulting in CRIM1 haploinsufficiency. A duplication including CRIM1 and additional genes (GRCh37/hg19 2p23.3-21(chr2:24881528-43460021)x3) was noted in ClinVar, but no phenotypic details were provided. The predicted loss-of-function (pLoF) score for CRIM1 in gnomAD v4.1 (Chen et al., 2024) is 1.
In murine embryos, Crim1 expression begins throughout the lens placode at embryonic day (E)10.5 and becomes concentrated in the lens epithelial (LE) and lens fiber (LF) cells at E12.5 (Lovicu et al., 2000; Zhang et al., 2016). As the lens fibers continue to mature, Crim1 is downregulated, but strong expression is maintained in the LE cells and in the developing LF cells of the lens cortex until postnatal life (Lovicu et al., 2000). Within the LE cells, Crim1 is localized to the cell membranes and cytoplasm (Zhang et al., 2016). CRIM1 is also expressed in the endoplasmic reticulum and accumulates at cell–cell contacts after the stimulation of human microvascular endothelial cells with lipopolysaccharide (Glienke et al., 2002).
Although complete loss of function for Crim1 resulted in perinatal lethality in the mouse, there have been several studies examining eye formation in mice that are homozygous (HZ) for Crim1 hypomorphic or conditional null alleles (summarized in Supplementary Table S1; Pennisi et al., 2007; Wilkinson et al., 2007; Wilkinson et al., 2009; Chiu et al., 2012; Pennisi et al., 2012; Wilkinson et al., 2012; Phua et al., 2013; Beleggia et al., 2015; Tam et al., 2018; Furuichi et al., 2019). Ocular defects resembling MACOM in the mutant mice have included small lenses, microcornea, a restricted aperture of the anterior eye chamber, and a narrow eye without diminished axial diameter (Beleggia et al., 2015). Additional eye findings have included microphthalmia (Chiu et al., 2012; Zhang et al., 2016), retinal dysplasia (Zhang et al., 2016), and aberrant accumulation of an ‘endothelial-like’ cellular mass or hyaloid cells in the posterior vitreous chamber (Pennisi et al., 2007; Tam et al., 2018). Small and misshapen lenses (Pennisi et al., 2007; Fan et al., 2014; Beleggia et al., 2015; Zhang et al., 2016), congenital cataracts (Zhang et al., 2016), reduced numbers of LE cells with disorganized epithelial cell adhesion, and deficient development of the LF cell mass have also been noted (Beleggia et al., 2015; Zhang et al., 2016; Tam et al., 2018). Crim1 is critical for the maintenance of the lens epithelium, which becomes anteriorly restricted in the murine mutants due to the early differentiation of LE cells into LF cells (Tam et al., 2018).
Zebrafish have a single, crim1 transcript that encodes a protein of 1,027 amino acids with 69% identity to human CRIM1 and a conserved domain structure resembling the human protein (Kolle et al., 2000; Kolle et al., 2003; Kinna et al., 2006). crim1 expression was observed from early blastula up to 48 h post-fertilization (hpf), consistent with maternal and zygotic expression (Kinna et al., 2006). The expression of crim1 was first observed in a diffuse pattern along the entire anterior–posterior axis and the notochord (Kinna et al., 2006). crim1 was also noted in the brain, the intermediate cell mass (ICM), and otic vesicles (Kinna et al., 2006). Using Daniocell, expression in the eye is the strongest after 72 hpf and is predominantly observed in the anterior retinal pigment epithelium (RPE), retinal interneurons, and developing RPE (Farrell et al., 2018; Sur et al., 2023). Prior studies using antisense morpholino (MO) injections targeting crim1 resulted in embryos with small eyes, small heads, abnormal somite patterning, curved bodies, and an expansion of the ICM compared to controls (Supplementary Table S2; Kinna et al., 2006). The embryos also had an aberrant formation of the intersegmental vessels and dorsal longitudinal anastomotic vessels, implicating crim1 in vascular development (Kinna et al., 2006). A subsequent study that used a low (1.0–1.5 ng) dose of antisense MO injections revealed increased nuclei clustered in the medial portion of the lens with mild, nuclei-in-lens cataracts but preserved visual attentiveness (Brastrom et al., 2019). Injected larvae were otherwise normal (Brastrom et al., 2019). Higher (2.5–3.0 ng) doses of antisense MOs led to increased numbers of nuclei in the lenses, microphthalmia, and defective retinal lamination (Brastrom et al., 2019).
In this study, we present the clinical details pertaining to three unpublished patients from two families with ocular defects due to pathogenic variants predicting haploinsufficiency for CRIM1. To better understand the etiology of the eye defects associated with decreased CRIM1 expression, we used Clustered Regularly Interspaced Short Palindromic Repeats (CRISPR)/Cas9 to generate a stable zebrafish model of reduced crim1 function with smaller eyes and lenses. We describe the phenotype of the crim1−/− mutant larvae and provide bulk RNA-seq data to support the role of this gene in eye development.
Materials and methodsPatients with pathogenic variants predicting haploinsufficiency for CRIM1Patients with CRIM1 deletions and pathogenic variants were ascertained by GeneMatcher (Sobreira et al., 2015). Phenotypic and genotypic details were collected in a spreadsheet. Consent was obtained for the publication of anonymous clinical details for each participant.
Generation and phenotyping of crim1−/− larvaeAll animal experiments were performed under protocols approved by the Institute for Animal Care and Use Committee (IACUC) at the University of California, San Francisco, and the IACUC committee at Cincinnati Children’s Hospital Medical Center (IACUC #2022-0040). EKW strain zebrafish were maintained at 28°C on a 14-h (h) light/10-h dark cycle. We used a modification of the previous CRISPR methodology to target the single crim1 gene (ENSDART00000050534.6) in Danio rerio (Talbot and Amacher, 2014). We designed a small guide (sg)RNA targeting crim1 prior to the coding sequence for the von Willebrand factor type C domains, antistasin-like domains, and the cysteine-rich motor neuron 1 protein domain (Supplementary Table S3). We injected zebrafish eggs at the one-cell stage and used Sanger sequencing in batches of 10–20 larvae at 48 hpf to assess the success of the injections. F0 larvae with insertion/deletion (indel) variants were raised and genotyped at 6–8 weeks by fin clipping after inducing anesthesia by immersing the fish in 0.02% tricaine methanesulfonate (FINQUEL or Tricaine-S) until gill movement was slowed. DNA was extracted from the clipped tail fin and Sanger-sequenced to assess successful gene targeting (for genotyping primers, see Supplementary Table S4). We selected an F0 founder with a 2 base pair (bp) deletion, c.339_340delCT p.Leu112Leufs*3 that introduced a frameshift and predicted premature protein truncation and nonsense-mediated decay for the crim1 transcript (for Sanger sequencing traces, see Supplementary Figure S1). After outcrossing this F0 founder, F1 progeny were raised and genotyped using DNA obtained from fin-clipping, as mentioned above. Heterozygous F1 adults were in-crossed to obtain F2 zebrafish that were homozygous (HZ) for the 2 bp deletion in crim1. These HZ mutant larvae, henceforth referred to as crim1−/− larvae, were viable. We raised and bred crim1−/− larvae that appeared normal, without any eye defects, for our experiments. We also examined eye morphology in heterozygous crim1+/− larvae. Our control fish were derived from the EKW strain or the NBT:DsRed strain that labels neurons under the neural ß-tubulin promoter and is not known to have any eye defects (Mazzolini et al., 2018).
We examined the crim1−/− larvae, crim1+/− larvae, and controls at 1–6 days post fertilization (dpf) for the ocular and lens findings previously observed in patients with MACOM and prior models of Crim1 and crim1 loss of function. We measured eye and lens size, head size, and body length compared to control larvae of the same age and developmental stage. Larvae with bent tails were measured along the body axis and the curved tail to capture the full length of the larva. We examined eye and lens morphology with hematoxylin and eosin (H&E) staining and immunohistochemistry (IHC) and used light microscopy to visualize the LE cells, LF cells, and retinal cell layers according to previously described methods (Krall et al., 2018; see Supplementary Table S4 for antibodies used and Supplementary Data for Method). Larvae photographed with differential interference contrast (DIC) microscopy at 3 dpf were treated with propylthiouracil after fertilization according to standard methods (Elsalini and Rohr, 2003). We used rabbit anti-phospho-histone H3 at 1–400 dilution (PH3; #9701S, Cell Signaling, Danvers, MA) with anti-rabbit Alexa Fluor 488 (Invitrogen, Grand Island, New York) for PH3 staining. We scored two sections per eye for PH3+ cells. At 48 hpf, we scored 7 control larvae, 5 crim1+/− larvae, and 4 crim1−/− larvae. At 72 hpf, we scored 9 control larvae, 4 crim1+/− larvae, and 8 crim1−/− larvae.
5-Bromo-2′-deoxyuridine labeling and scoringFor BrdU labeling, 48 hpf and 72 hpf larvae were incubated in egg water containing 10 mM 5-bromo-2′-deoxyuridine (BrdU)/15% dimethyl sulfoxide (DMSO) solution (Sigma-Aldrich, St. Louis, MO) on ice for 30 min. Post-incubation, larvae were rinsed with fresh egg water and then placed at 28°C for 1 h (Janssens et al., 2013). BrdU-labeled larvae were euthanized and fixed with 4% paraformaldehyde in phosphate-buffered saline (PBS). BrdU-labeled sections were treated with 2N hydrochloric acid (HCl)/0.5% Triton/PBS for 60 min prior to incubation with mouse anti-BrdU (#B2531, 1-400, Sigma-Aldrich), followed by conjugation with anti-mouse Alexa 488 (Invitrogen, Carlsbad, CA). At least two sections per eye and both eyes were counted manually for BrdU + cells using ImageJ software.
‘Bulk’ RNA-seq in crim1−/− mutant larvaeWe performed ‘bulk’ RNA-seq experiments in dissected eyes from in-crossed crim1−/− larvae and controls at 72 hpf according to the previously described methods (Krall et al., 2018). RNA quality and quantity were reviewed using a bioanalyzer (2100 Bioanalyzer, Agilent), and libraries were prepared with an Ovation® RNA-Seq System V2 Kit (NuGEN). With this method, total RNA was reverse transcribed to synthesize first-strand cDNA using a combination of random hexamers and a poly-T chimeric primer (Krall et al., 2018). The RNA template was then partially degraded by heating, and the second-strand cDNA was synthesized using DNA polymerase. The double-stranded DNA was then amplified using single primer isothermal amplification (SPIA). SPIA is a linear cDNA amplification process in which RNase H degrades RNA in DNA/RNA heteroduplex at the 5′-end of the double-stranded DNA, after which the SPIA primer binds to the cDNA and the polymerase starts replication at the 3′-end of the primer by displacement of the existing forward strand (Krall et al., 2018). Random hexamers were then used to linearly amplify the second-strand cDNA. Finally, libraries from the SPIA-amplified cDNA were prepared using the Ultralow DR Library Kit (NuGEN). The RNA-seq libraries were analyzed for quality and primer dimers using a bioanalyzer and quantified by quantitative polymerase chain reaction (qPCR) prior to sequencing (KAPA Library Quantification Kit). High-throughput sequencing was conducted using single-end 50 lane(s) on a HiSeq 4000 instrument (Illumina).
The quality of raw single-end reads of the RNA-seq dataset was tested by FastQC (http://www.bioinformatics.babraham.ac.uk/projects/fastqc/) to evaluate the per-base sequence quality, quality scores, sequence length distribution, and overrepresented adapter/primer sequences. After quality control with FastQC, data trimming and clipping were performed using BBDuk and aligned against the zebrafish reference genome (GRCz11) using STAR. Alignment results were then assessed to check the quality with Qualimap. RSEM was used to quantify genes. Finally, DESeq2 was used to conduct a downstream analysis for differentially expressed genes. Statistically significant differentially expressed genes (DEGs) with log2 (fold change) greater than ±0.5, an adjusted p-value ≤0.05, and the mean fragments per kilobase of exon per million fragments mapped (FPKM) ≥1 in all datasets were identified by comparing crim1−/− mutants with control datasets using an in-house Python script. Principal component analysis (PCA) was performed on global gene expression to determine the relatedness between the individual replicates of wildtype and mutant datasets.
Reverse transcriptase quantitative polymerase chain reactionWe designed gene-specific, reverse transcriptase quantitative polymerase chain reaction (RT-qPCR) primers flanking at least one intron for the top-ranking up- and down-dysregulated genes in the bulk RNA-seq experiments (for primers, see Supplementary Table S5). Each RT-qPCR was run in triplicate with melt curve analysis showing a single peak. All experiments were performed on at least three biological replicates of control and crim1−/− larvae, following the previously described methods (Krall et al., 2018). We generated a time course of crim1 expression from 24 to 72 hpf. Eyes were dissected from zebrafish larvae into cold, 1x PBS at 72 hpf. A total of 40 pairs of eyes were pooled in a 1.5-mL microfuge tube, spun, and snap-frozen at −80°C after PBS removal. Total RNA was extracted using the PureLink RNA Mini Kit (Invitrogen, Carlsbad, CA). RNA was treated with Ambion™ DNase I (RNase-free, Invitrogen, Carlsbad, CA) to remove impurities. cDNA was synthesized from 1.5 µg of total RNA with oligo(dT)20 priming using SuperScript III Reverse Transcriptase (Invitrogen, Carlsbad, CA). Reactions were run on an ABI Prism 7500 Sequence Detection System, and data were analyzed according to the ΔΔCt method using eef1a1l1 (NM_131263.1) as an internal control according to previously described methods (Wu et al., 2015).
Terminal deoxynucleotidyl transferase dUTP nick end labeling assayTerminal deoxynucleotidyl transferase dUTP nick end labeling (TUNEL) staining was performed on cryosections of controls and crim−/− larvae from 48 to 72 hpf, according to the manufacturer’s protocol (1168479510, Roche, Indianapolis, IN). We examined a minimum of four larvae from each experimental group and analyzed 2–4 non-consecutive mid-eye sections per eye at each timepoint. For apoptotic cleaved caspase-3, we stained cryosections from controls and crim−/− larvae at 24, 30, 48, and 72 hpf. A minimum of four larvae from each experimental group were analyzed using 2–4 non-consecutive sections from the middle of each eye for each timepoint. Sections were stained and counted using the count tool in ImageJ software. The number of TUNEL-positive or cleaved caspase-3-positive cells was divided by the total number of nuclei labeled with 4′,6-diamidino-2phenylindole (DAPI) and plotted against age. After calculating the mean ± standard error (SE), groups with statistically significant differences compared to controls were determined using a Student’s t-test.
Enzyme-linked immunosorbent assayFifty whole larvae were collected from controls and crim1−/− larvae at 12 and 24 hpf. Additionally, 100 whole eyes were collected from controls and crim1−/− larvae at 48 and 72 hpf. These eye tissues were rapidly frozen on dry ice, then thawed, and mechanically homogenized. The homogenates were centrifuged at 8,000 relative centrifugal force (rcf) at 4°C. The resulting supernatants containing soluble proteins were carefully collected. These supernatants were then used for quantifying C1q levels using an enzyme-linked immunosorbent assay (ELISA), following the protocols provided by the manufacturer (MBS023066, MyBioSource, San Diego, CA). Optical density at 450 nm was read using a Bio-Tek Microplate Reader System with Gen5 software (Bio-Tek, Santa Clara, CA).
ImmunoprecipitationFifty heads were collected from control and crim1−/− larvae at 72 hpf. Whole heads were homogenized, solubilized, and washed (Michel and Miller, 2023). Supernatants were pre-cleared, and the protein lysates were measured using a Direct Detect Spectrometer system (DDHW00010, Millipore Sigma, Burlington, MA, United States). Lysates were incubated with recombinant anti-Crim1 (AB5699, 1:200, Sigma-Aldrich, St. Louis, MO) and anti-β1-integrin (Itgβ1; clone MB1.2, MAB1997, 1:50, Sigma-Aldrich, St. Louis, MO) at 2 µg of antibody overnight at 4°C. After washing, the supernatants were used for Western blot analysis according to standard methods. We loaded 20 µL of 40 µg of immunoprecipitants and 20 µL of 4 µg of input using 4%–20% Mini-PROTEAN® TGX Stain-Free™ Protein Gels (Bio-Rad, Hercules, CA).
StatisticsStatistical analysis was performed using t-tests according to standard methods. We used a significance level of P-value < 0.05.
ResultsPatients with pathogenic variants predicting haploinsufficiency for CRIM1 demonstrate coloboma and optic atrophyThe clinical and genetic data from patients with CRIM1 variants predicting haploinsufficiency are summarized in Table 1 and presented in full in Supplementary Table S6. We ascertained a 48-year-old female with bilateral cornea plana and microcornea, bilateral cataracts (right eye, dense nuclear and partially subluxated; left eye, surgically removed intraocular lens, aphakic), bilateral iris colobomas, and a coloboma of the retina in the left eye, with bilateral retinal detachments. Due to significant corneal band keratopathy and dense media opacity in the right eye, examination of the optic nerve and posterior pole of the retina could not to be performed. Her aphakic left eye distance visual acuity was 20/80 with a +7.00 + 2.00 × 81 refraction. Her right eye had no light perception. Other findings included mild, low-frequency sensorineural hearing loss that normalized in the mid frequencies and sloped to a mild-to-moderate loss at high frequencies bilaterally. A renal ultrasound (US) scan showed mild, focal caliectasis/hydronephrosis of the right kidney at the mid to lower pole of the collecting system and diffuse mild left hydronephrosis. The patient and her father had a heterozygous, 39,942 bp deletion encompassing exons 14 to 17 and the 3′ UTR region of CRIM1. The deletion also included exons 6 to 8 of Fasciculation and Elongation protein, Zygin/zeta-2 (FEZ2; OMIM #62486), which has not yet been associated with a phenotype in humans.
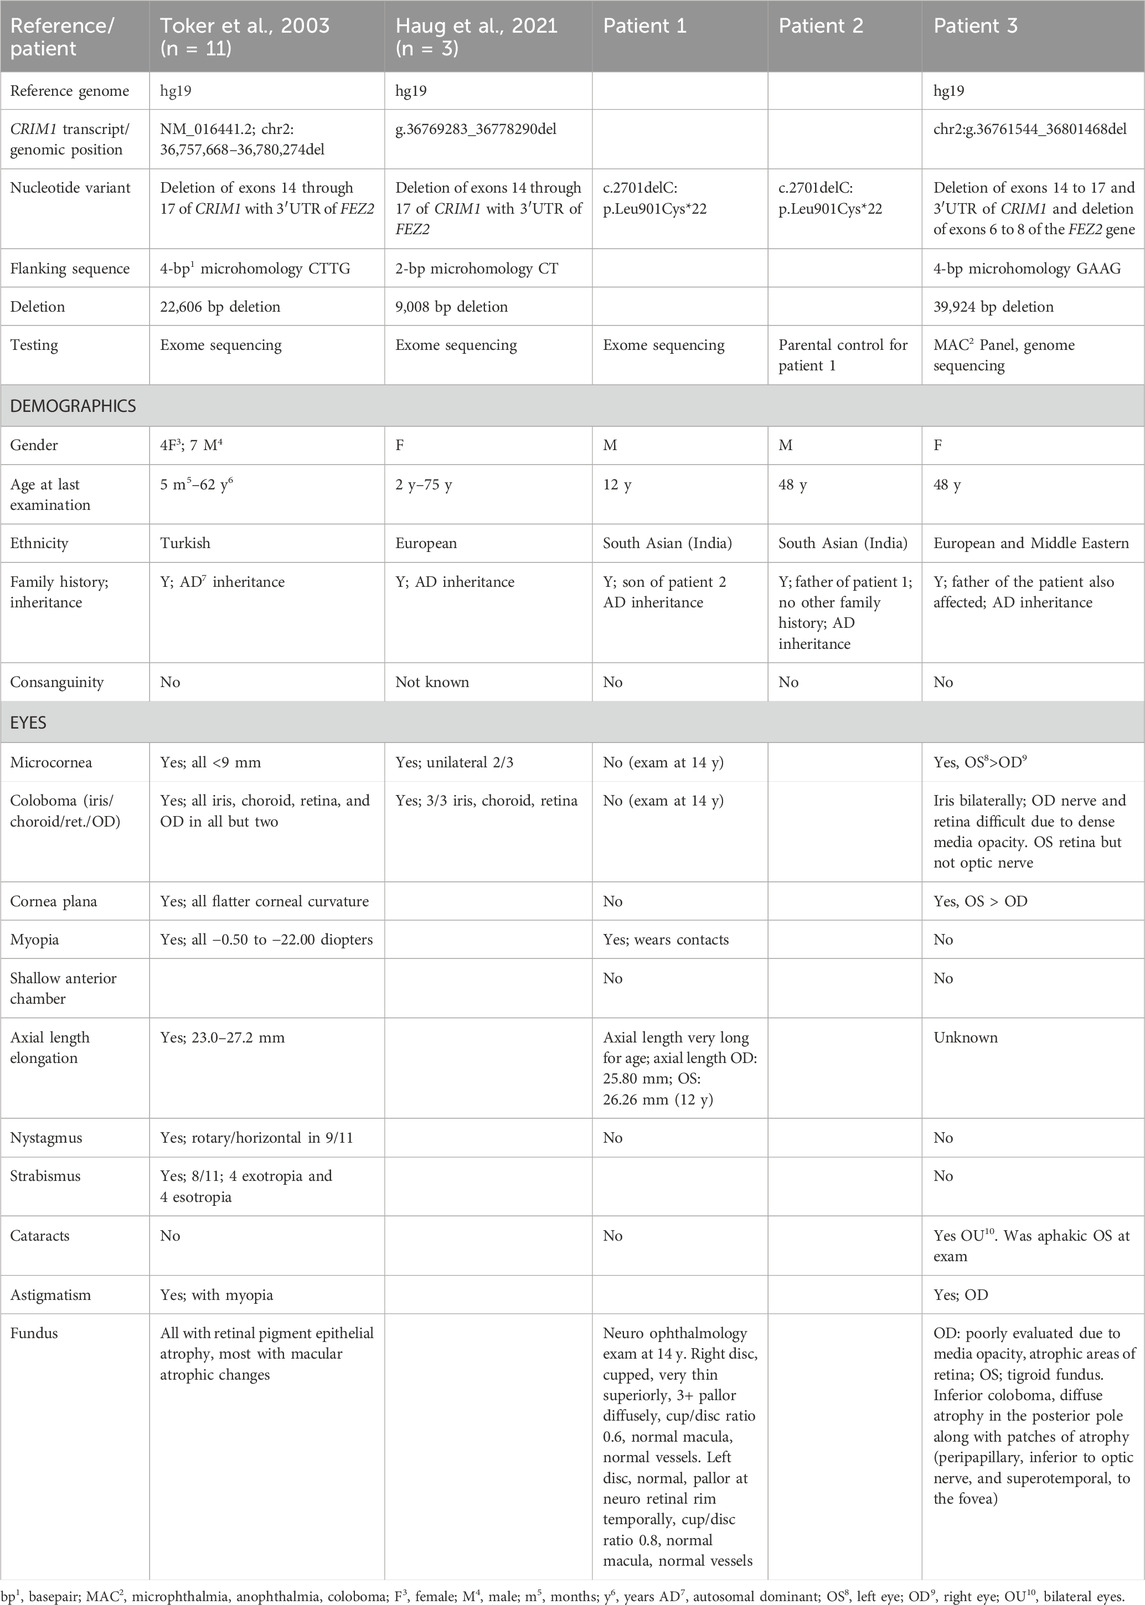
Table 1. Description of CRIM1 variants and eye findings in three new patients with CRIM1 haploinsufficiency.
A second family of two generations comprised a 12-year-old male with myopia and his father. The boy had an increased axial length and vision loss from optic atrophy in both eyes, with temporal field loss in the right eye and left total inferior temporal field loss. The optic nerves were cupped with 3+ optic atrophy of the neuro-retinal rim in the right eye. The left optic disc was normal, with pallor at the temporal neuro-retinal rim. Optical coherence tomography (OCT) showed a severely thin retinal nerve fiber layer in his right eye and a mildly thin retinal nerve fiber layer in his left eye. Other medical findings comprised febrile seizures at 2 years of age, testicular torsion treated with orchidopexy, an arachnoid cyst, and a Chiari malformation that reportedly resolved on subsequent magnetic resonance imaging (MRI) of the brain. His milestones and development were normal, except for requiring 6 months of speech therapy at the age of 2 years. His father was myopic and wore glasses from 10 years of age and was diagnosed with corneal pannus, cataract at a young age, and visual field loss. The father’s examination showed a similar optic nerve appearance to his son and bilateral, diffuse optic atrophy with cupping. Both father and son had a single-nucleotide deletion in CRIM1, c.2701delC p.Leu901Cysfs*22 (NM_016441.3). This variant affects exon 15 out of 17 exons in the longest isoform of CRIM1, which is the only known coding transcript. The variant is not present in the 1000 Genomes Project but was found in one individual in gnomAD v4.1 (1/1,424,618 alleles for an allele frequency of 7.02e−7; no homozygous allele) and predicts premature protein truncation and nonsense-mediated decay (MutationTaster; Schwarz et al., 2010). The nucleotide variant also increases an acceptor splice site (wildtype 0.21 mutant 0.27; exon gtgg/CCCA intron; MutationTaster; Schwarz et al., 2010).
crim1−/− mutant larvae demonstrate microphthalmia and lens defectsWe in-crossed male and female zebrafish that were HZ for the 2bp deletion in crim1. At 48 hpf, the crim1−/− larvae showed increased numbers of malformations and shortened body lengths compared to controls (Figure 1A). Curved and shortened body axes and shortened or deformed tails were observed in 81.3% of crim1−/− larvae compared to 3.2% of controls (Figure 1A). At 24 hpf, there were no obvious external differences between the controls, heterozygous crim1+/− larvae, and crim1−/− larvae (Figure 1B). However, by 48 hpf, the crim1−/− mutants demonstrated tail deformities (Figure 1C, panel iii), and at 72 hpf, the crim1−/− mutants had curved tails similar to prior MO models of crim1 loss of function (Figure 1C, panel vi; Kinna et al., 2006). Heterozygotes appeared similar to controls at 48 hpf (Figure 1C, panel ii) and 72 hpf (Figure 1C, panel v), and for this reason, we did not quantify the malformations or study the heterozygotes further. Approximately 18% of the HZ crim1−/− larvae retained a normal external appearance and ocular appearance (Figure 1A).
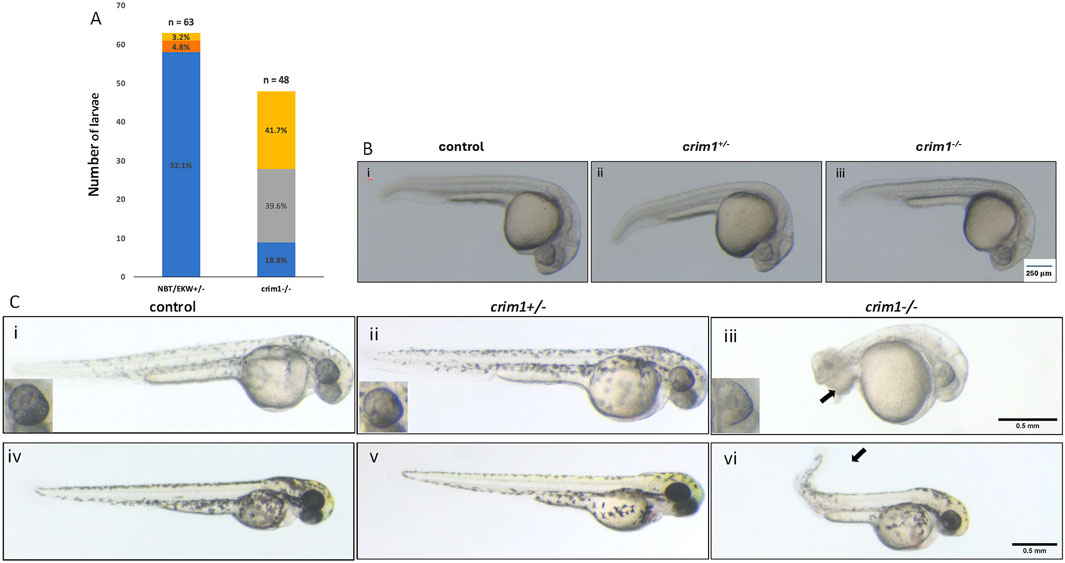
Figure 1. Morphology and appearance of control, heterozygous, crim1+/−, and crim1−/− larvae that are homozygous for a 2 base pair deletion, c.339_340delCT p.Leu112Leufs*3 at 24, 48, and 72 h post fertilization (hpf). (A) Morphology for control (n = 63) and crim1−/− larvae (n = 48) that are homozygous for a 2 base pair deletion in crim1. The columns are colored according to the numbers and percentages of larvae with a normal phenotype (blue), mild deformity (orange), curved body axis (yellow), and malformations such as edema, cardiac defects, and severely shortened body (gray). The crim1−/− larvae have an increased rate of abnormalities compared to controls. (B) Representative photographs of control larvae (panel i), heterozygous crim1+/− larvae (panel ii), and homozygous crim1−/− larvae (panel iii) at 24 hpf. The heterozygous crim1+/− larvae and homozygous crim1−/− larvae appear similar to the control. (C) Representative photographs of control larvae (panels i and iv), heterozygous crim1+/− larvae (panels ii and v), and homozygous crim1−/− larvae (panels iii and vi) at approximately 38 hpf (panels i, ii, and iii) and 72 hpf (panels iv, v, and vi). The heterozygous crim1+/− larvae appear similar to controls, but the homozygous crim1−/− larvae show shortened body axes and curved tails at both time periods, as indicated by the arrows. Scale bars = 500 µm.
We measured the longest axis for eye diameter, head diameter, and body length in the crim1−/− larvae and controls (see Figures 2A–C for measurements obtained). We found a significant decrease in the eye size in the crim1−/− larvae at 48 hpf and 72 hpf (Figure 2D; P-value for 48 hpf = 0.003 and P-value for 72 hpf = 0.002). This decrease in the eye size resembles microphthalmia observed in the mouse models of Crim1 loss of function (Supplementary Table S1; Chiu et al., 2012; Fan et al., 2014; Zhang et al., 2016). In contrast, the ratio of eye diameter to body length was significantly increased in the crim1−/− larvae at 48 hpf and 72 hpf (P-value for 48 hpf = 1.71e−06 and P-value for 72 hpf = 2.65e−05), consistent with a greater reduction in the body length than in the eye size (Figure 2E). Finally, the ratio of eye diameter to head diameter was increased in the crim1−/− larvae compared to controls at 48 hpf but not at 24 hpf or 72 hpf (Figure 2F).

Figure 2. Eye, head, and body measurements from control and crim1−/− larvae that are homozygous for a 2 base pair deletion, c.339_340delCT p.Leu112Leufs*3, at 48 and 72 h post fertilization (hpf). (A) Control larva showing measurements obtained for eye diameter and head length. (B, C) Control larva showing site of measurements for eye diameter and body and tail length. (D) Measurements of eye diameter in control larvae (white columns) and crim1−/− larvae (black columns) at 48 hpf and 72 hpf. Each dot represents a single measurement. Eye diameter is significantly decreased in the crim1−/− larvae compared to controls. (E) Ratio of eye diameter to body length in control larvae (white columns) and crim1−/− larvae (black columns) at 48 hpf and 72 hpf. Each dot represents a single measurement. The crim1−/− larvae demonstrate a significantly increased ratio for eye diameter to body length compared to controls. (F) Ratio of eye diameter to head diameter in control and crim1−/− larvae. Each gray dot represents a measurement at 24 hpf, 48 hpf, and 72 hpf. The height of the white columns represents the mean of the ratio of eye diameter to head diameter for control larvae and the height of the black columns representing the mean of the ratio of eye diameter to head diameter for the crim1−/− larvae. The crim1−/− larvae show a significantly increased ratio of eye diameter to head diameter at 48 hpf (P = 0.008), but the ratio was not significantly increased at 24 hpf or 72 hpf.
We used cryosections with H&E staining and light microscopy to examine eye and lens morphology in the crim1−/− larvae compared to controls at 3, 4, and 5 dpf (Figure 3). We also used differential interference contrast (DIC) microscopy to examine lens morphology in the crim1−/− mutant larvae compared to controls at 3 dpf (Figure 4). The lenses from crim1−/− mutant larvae appeared smaller in size compared to controls (Figure 3, panels A and E), and this difference in eye size persisted at 4 dpf and 5 dpf (Figure 3, panels B, C, and D and F, G, and H). The lens morphology also appeared to be irregular in crim1−/− mutant larvae compared with the typical spherical shape of control lenses (Figure 3, panel F compared to panel B and panel H compared to panel D). Examining the lenses with DIC microscopy showed that controls had a regular appearance of the lens in 8/8 larvae (Figure 4, panels A and B) compared to 3/14 crim1−/− mutant larvae that had an irregular, roughened appearance of the lens (Figure 4, panels D-F). However, some of the crim1−/− mutant larvae retained a normal appearance of the lens (Figure 4, panel C). The quantification of lens diameter for 16 lenses in controls and crim1−/− mutant larvae showed that crim1−/− larvae had significantly smaller lenses than controls (Figure 4, panel G, showing the method of measurement, and panel H, showing lens diameters; P-value = 0.036).
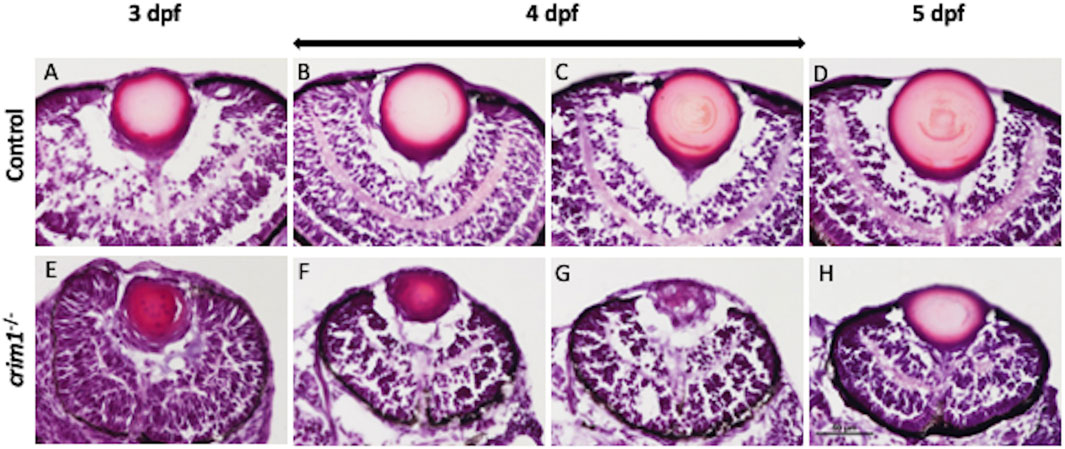
Figure 3. Representative images of zebrafish eyes stained with H&E from control and crim1−/− larvae that are homozygous for a 2 base pair deletion, c.339_340delCT p.Leu112Leufs*3, at 3–5 days post fertilization (dpf). The top row shows control larvae at 3 dpf (A), 4 dpf (B, C), and 5 dpf (D), showing normal lens and eye development. The bottom row shows homozygous crim1−/− larvae at 3 dpf (E), 4 dpf (F, G), and 5 dpf (H), showing reduced lens and eye size in the crim1−/− lenses at 3 and 4 dpf (E, F). At 3 dpf, 6–8 larvae were scored, and at 4 and 5 dpf, 10–12 larvae were scored. Scale bar = 50 µm.
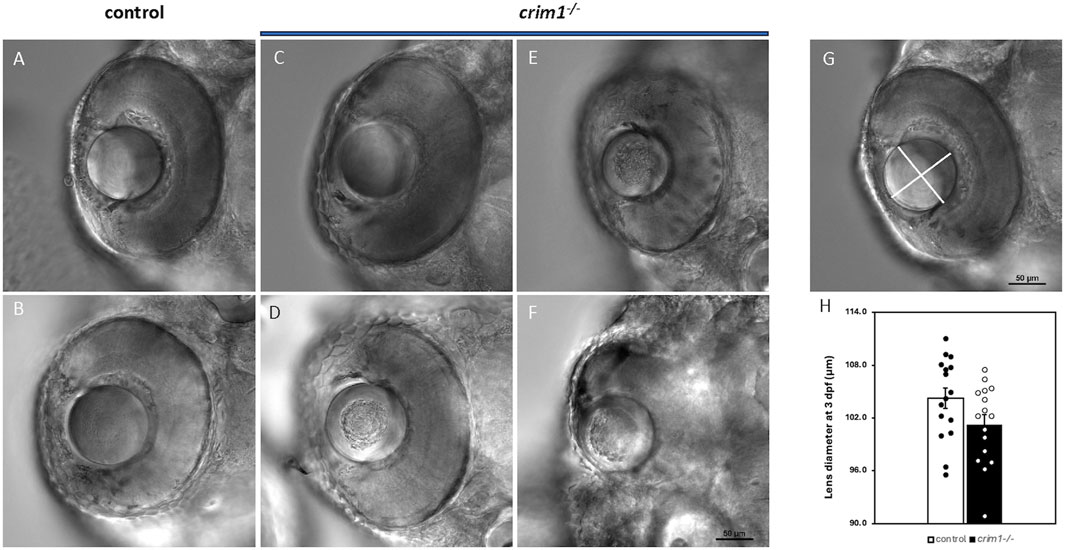
Figure 4. DIC microscopy of control and crim1−/− larvae that are homozygous for a 2 base pair deletion, c.339_340delCT p.Leu112Leufs*3, at 3 days post fertilization (dpf). (A–C) Lenses from control larvae and a crim1−/− larva that have a smooth and regular appearance. (D–F) Lenses from crim1−/− larvae that have a roughened and irregular appearance. (G) Method for obtaining measurements of lens diameter. (H) Measurements of lens diameter (in μm) in control and crim1−/− larvae in 16 lenses. There is a significant reduction in lens diameter for the crim1−/− larvae compared to controls (P = 0.036).
We then examined various ocular cell types for differences between the crim1−/− mutant larvae and controls. Staining with the zl-1 antibody that binds to differentiating LF cells (Greiling et al., 2010) showed irregular and amorphous-appearing lenses in the crim1−/− larvae compared to controls (Figure 5, panels A and B). Staining of the corneal epithelium with the E-cadherin antibody that binds to the corneal epithelium was similar between controls and crim1−/− larvae (Figure 5, panels C and D). Retinal lamination was grossly normal when examined using the zn-5 antibody that binds to amacrine cells and retinal ganglion cells in the retinal ganglion cell layer (Figure 5, panels E and F), but there was a significant increase in thickness of the retinal ganglion cell layer in the crim1−/− larvae compared to controls (Supplementary Figure S2; P-value = 0.00034). There was no obvious difference between controls and crim1−/− mutant larvae using the zpr-1 antibody that binds to photoreceptor cells (Figure 4, panels G and H). We did not observe colobomas in the crim1−/− larvae.
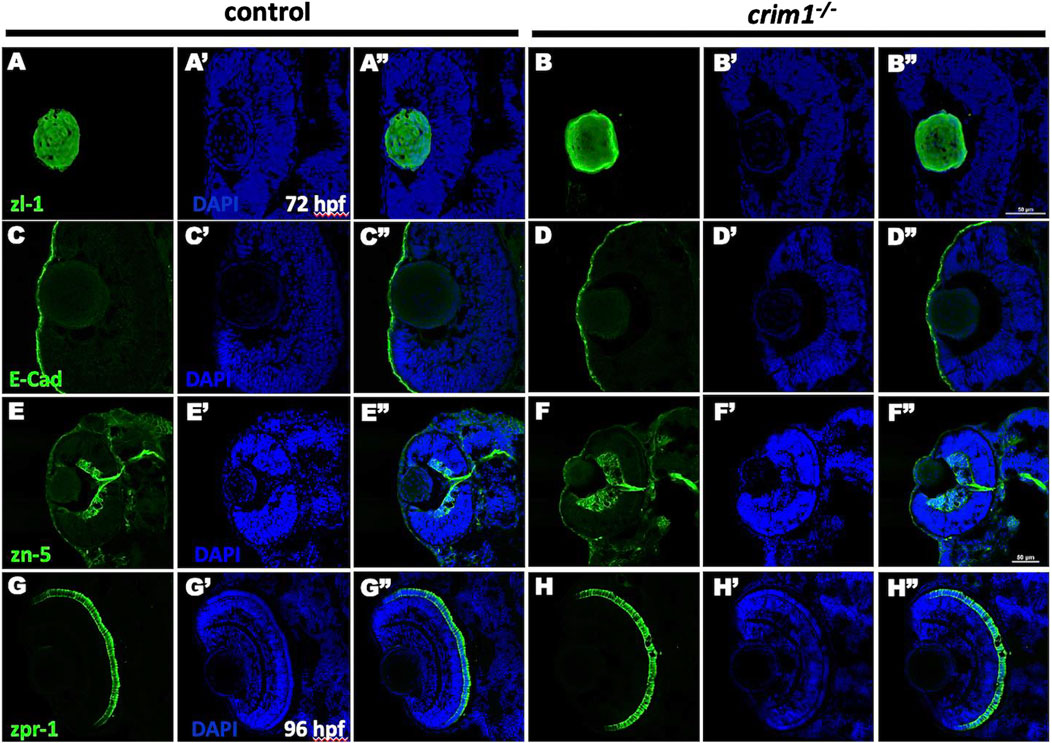
Figure 5. Immunohistochemistry in control and crim1−/− larvae that are homozygous for a 2 base pair deletion, c.339_340delCT p.Leu112Leufs*3, at 72 and 96 h post fertilization (hpf). Representative sections of eyes from control larvae (A, C, E, G) and crim1−/− larvae (B, D, F, H) at 72 hpf stained with zl-1 (A, B), E-cadherin (C, D), zn-5 antibody (E, F) and at 96 hpf stained with zpr-1 (G, H). The lens fiber cells in the crim1−/− larva stained with z-l1 are less homogenous compared to the lens from a control larva (A, B). The corneal epithelium showed mild clumping of cells in the crim1−/− larva stained with E-cadherin (C, D) compared to a control larva. The retinal ganglion cell layer was thicker in the crim1−/− larva stained with the zn-5 antibody than in a control larva (E, F). There was no obvious difference in the photoreceptors in crim1−/− and control larvae stained with zpr-1 (G, H). (A–H) Larvae stained with Alexa Fluor 488 dye (green). (A′–H′) Larvae stained with DAPI (blue). (A′′–H′′) Merged images. Scale bars = 50 µm.
We reasoned that the smaller eye size in the crim1−/− mutant larvae could be due to reduced cell proliferation. Staining with PH3 did not show any difference between crim1+/− heterozygous larvae and controls and between crim1−/− mutant larvae compared and controls (Figure 6, panels A–F; Figure 7A). There was a significant reduction in staining in crim1−/− mutant larvae compared to controls at 48 hpf (P = 0.013; Figure 6 panels G–I; Figure 7B), consistent with reduced cellular proliferation, but this difference was not statistically significant for heterozygous crim+/− larvae compared to controls at 48 hpf or between crim1−/− larvae compared to controls at 72 hpf.
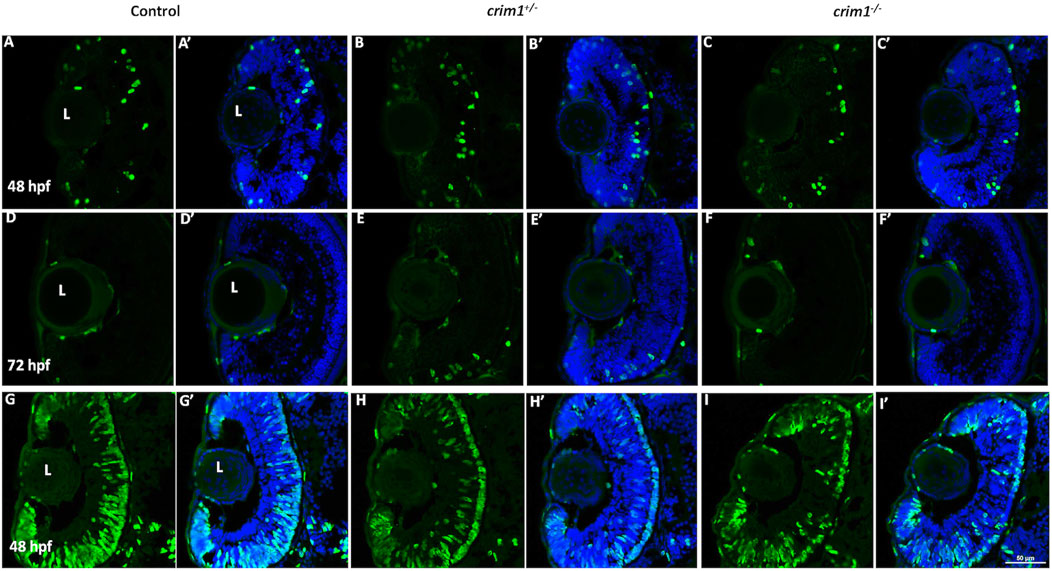
Figure 6. Phospho-histone H3 and 5-bromo-2′-deoxyuridine staining in control, crim1+/− larvae, and crim1−/− larvae that are homozygous for a 2 base pair deletion, c.339_340delCT p.Leu112Leufs*3, at 48 and 72 h post fertilization (hpf). Representative sections of eyes from control larvae (A, D, G), crim1+/− larvae (B, E, H), and crim1−/− larvae (C, F, I) stained with the PH3 antibody (Alexa Fluor 488 dye; green) and DAPI (merged (A’–F’), blue) at 48 and 72 hpf (A–F) and with BrdU (Alexa Fluor 488 dye; green) and DAPI (merged (G’–I’), blue) at 48 hpf (G–I). The quantification of the BrdU antibody showed a significant reduction in BrdU staining in the homozygous crim1−/− larvae compared to control at 48 hpf (P = 0.013). L = lens.
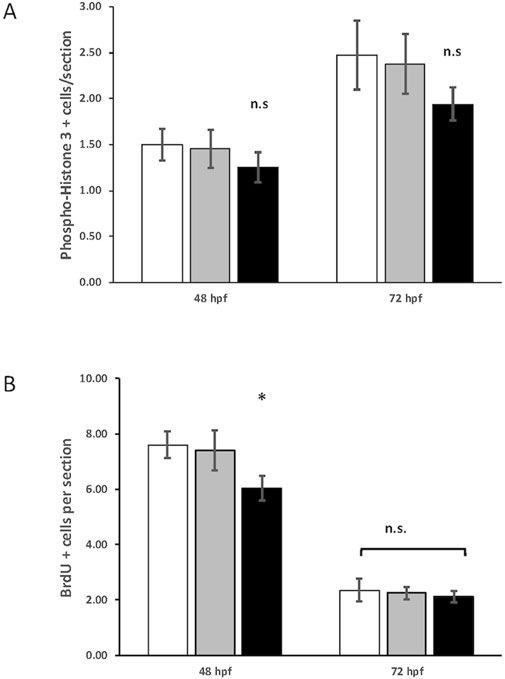
Figure 7. Quantification of phospho-histone H3 and 5-bromo-2′-deoxyuridine (BrdU) staining in control, heterozygous crim1+/−, and crim1−/− larvae that are homozygous for a 2 base pair deletion, c.339_340delCT p.Leu112Leufs*3, at 48 and 72 h post fertilization (hpf). (A) The quantification of the PH3 antibody showed no significant difference between control, heterozygous crim1+/−, and crim1−/− larvae. A total of 14 control larvae were scored, 11 crim1+/− larvae were scored, and 8 crim1−/− larvae were scored at 48 hpf. A total of 19 control larvae, 8 crim1+/− larvae, and 17 crim1−/− larvae were scored at 72 hpf. (B) The quantification of the BrdU antibody showed a significant reduction in BrdU staining in the homozygous crim1−/− larvae compared to control and heterozygous crim1+/− larvae at 48 hpf (P = 0.013) but not at 72 hpf. A total of eight control larvae were scored, three crim1+/− larvae were scored, and seven crim1−/− larvae were scored at 48 hpf. A total of five control larvae, five crim1+/− larvae, and five crim1−/− larvae were scored at 72 hpf.
Bulk RNA-seq comparing gene expression between crim1−/− larvae and controls shows the downregulation of clic4 and the upregulation of fgf1bA three-dimensional PCA plot confirmed the separation of gene expression in the crim1−/− samples compared to the control samples (Figure 8A). There were 223 genes that were significantly dysregulated (adjusted P-value < 0.05), with 109 upregulated genes and 114 downregulated genes (Supplementary Table S7). A heatmap showing the separation of the DEGs in control and crim1−/− larvae is shown in Figure 8C, and a volcano plot showing the distribution of dysregulated genes is shown in Figure 8B. The top 16 downregulated and upregulated DEGs and transcripts from the bulk RNA-seq experiments comparing gene expression from crim1−/− larval eyes with those of controls at 72 hpf are shown in Table 2. crim1 expression was downregulated in the crim1−/− larvae compared to controls with an adjusted P-value of 1.72e−11 (Table 2), consistent with the predicted decrease in crim1 expression after CRISPR targeting of this gene. This result was confirmed with RT-qPCR at 24, 48, and 72 hpf (see Figure 9A; P-value = 0.04; Supplementary Figure S3). Chloride intracellular channel 4 (clic4) was the most significantly downregulated gene, with an adjusted P-value of 2.77e−41 (Table 2). RT-qPCR also confirmed reduced expression for this gene in RNA from crim1−/− mutant eyes compared to controls (P-value = 0.02; Figure 9A). IHC revealed mildly reduced expression of clic4 in the lens at the same timepoint (Supplementary Figure S4), but expression of this gene was still detectable in the crim1−/− mutant lenses.
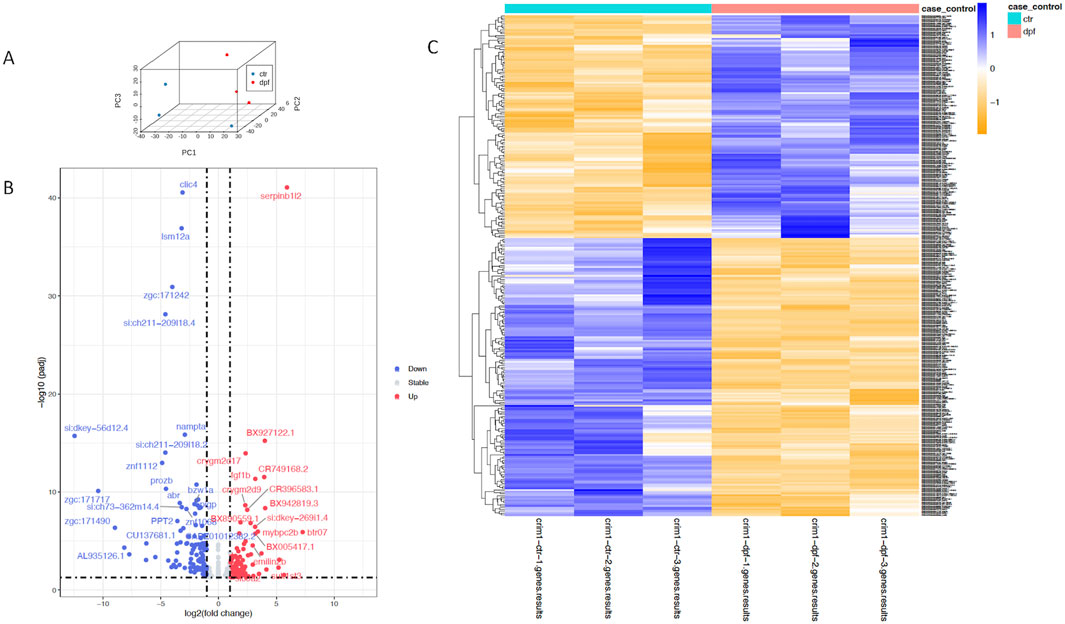
Figure 8. Principal component analysis, heatmap, and volcano plot showing DEGs for controls and crim1−/− larvae. Data from DEGs with adjusted P-values </ = 0.05 and an absolute (log2foldchange) >/ = 1 were used to generate the plots. (A) Three-dimensional PCA plot showing the separation of samples from control larval eyes (blue dots) compared to samples from crim1−/− larval eyes (red dots). (B) Volcano plot showing differential gene expression for crim1−/− mutant larvae and controls. The log2 fold change indicates the mean expression level for each gene. Each dot represents one gene. Selected genes with an adjusted P-value </ = 0.01 and absolute (log2foldchange) >/ = 2 have been named. Downregulated genes are shown in blue and upregulated genes are shown in red. (C) Heatmap of expressed genes in crim1−/− larvae and controls, showing separation of gene expression between control and crim1−/− mutant larvae. The type of sample (control or crim1−/− mutant) is listed on the X axis and the Y axis contains DEGs.
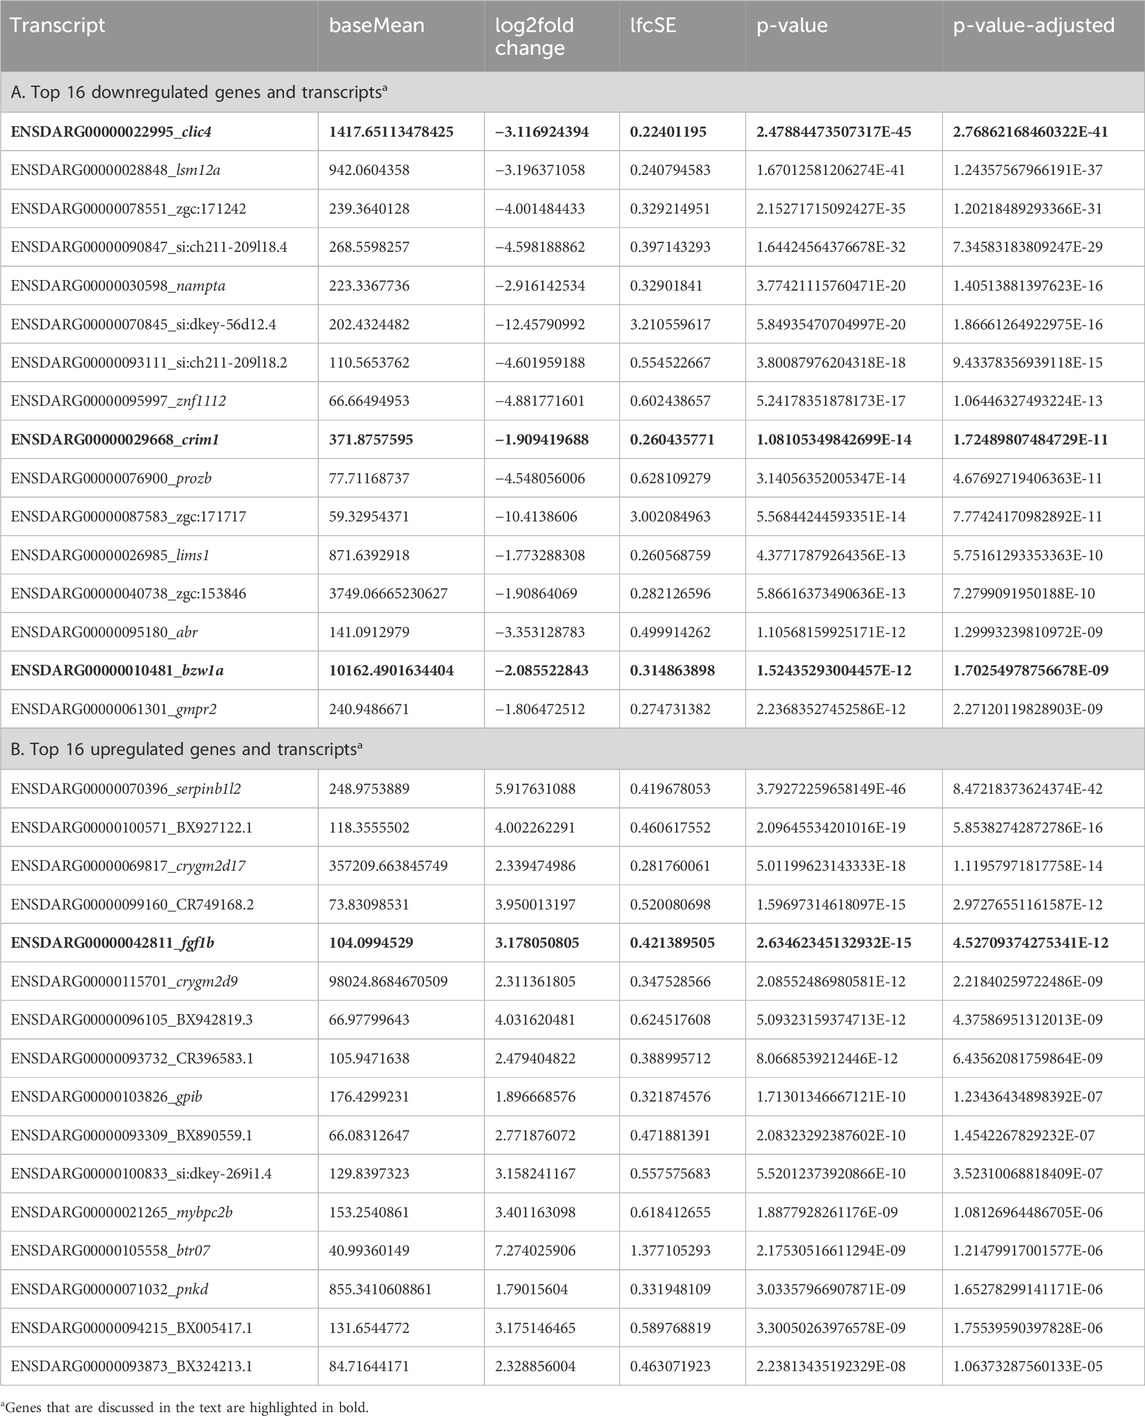
Table 2. ‘Bulk’ RNA-seq data comparing gene expression in pooled eyes from crim1−/− larvae and controls at 72 h post fertilization.
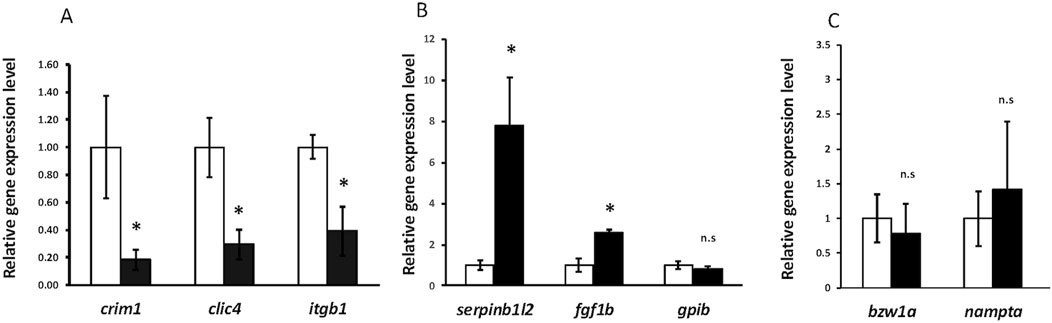
Figure 9. RT-qPCR showing significant downregulation of crim1, clic4, and itgb1 and significant upregulation of serpinb1l2 and fgf1b. (A) RT-qPCR showing expression of crim1, clic4, and itgb1 in crim1−/− larvae compared to controls. RT-qPCR was performed on dissected eyes for all experiments from control (white columns; expression normalized to 1.0) and crim1−/− larvae (black columns) at 72 hpf. The results show significantly reduced expression of crim1 (P = 0.04), clic4 (P = 0.02), and itgb1 (P = 0.02) in crim1−/− larvae compared to controls. (B) RT-qPCR showing expression of serpinb1l2, fgf1b, and gpib in crim1−/− larvae compared to controls. The results show significantly increased expression of serpinb1l2 (P = 0.02) and fgf1b (P = 0.02) but not gpib (P = 0.25) in crim1−/− larvae compared to controls. (C) RT-qPCR showing expression of bzw1a and nampta in crim1−/− larvae compared to controls. The results do not show significantly reduced expression for bzw1a (P = 0.4) or nampta (P = 0.16) in crim1−/− larvae compared to controls.
Crim1 recruits and co-localizes with β1-integrin at the plasma membrane and is involved in integrin recycling and β1-integrin-dependent cell adhesion (Argenzio et al., 2014). We, therefore, performed RT-qPCR to measure the expression of itgb1 encoding β1-integrin in the crim1−/− mutant eyes compared to controls. We observed significant downregulation of itgb1 (P-value = 0.02; Figure 9A). We considered a model in which the reduced clic4 expression observed in the crim1−/− larvae disrupts integrin-mediated cell interactions and investigated whether Crim1 can directly bind to Clic4. Immunoprecipitation showed a faint band at the expected size (29 kDa) in a lysate obtained from whole larval heads from controls at 72 hpf incubated with the recombinant Crim1 antibody and using the anti-Clic4 antibody for Western blotting (Supplementary Figure S5). However, the polyclonal nature of the Clic4 antibody resulted in non-specific bands, and our results do not demonstrate a definite interaction. We could not identify a suitable antibody for itgb1 to verify interactions between itgb1 and Clic4 or Crim1 (data not shown). There are multiple itgb1 homologs in zebrafish including integrin beta 1a (itgb1a), integrin beta 1b (itgb1b), integrin beta 1b.1 (itgb1b.1), and integrin beta 1b.2 (itgb1b.2; Mould et al., 2006; Wang et al., 2014). The Danio rerio genes itgb1a and itgb1b are closely homologous to integrin beta1 subunits present in other vertebrates, but itgb1b.1 and itgb1b.2 are unconventional beta1 subunits
Comments (0)