
Remember me


A total of 42 DVT patients diagnosed with DVT and treated at the Second Affiliated Hospital of Nantong University, Cina, were selected for the study. Participants were divided into two groups: the control group that consisted of 20 patients admitted between January 2023 and August 2023, and the experimental group comprising 22 patients admitted between September 2023 and March 2024.
Inclusion criteriaParticipants who fulfilled the following criteria were included in the study: (1) age < 75 years; (2) disease duration of ≤ 28 days; (3) presence of unilateral limb swelling, with a diagnosis of DVT confirmed by digital subtraction angiography (DSA) in accordance with the criteria set forth by the 4th Academic Conference of the Peripheral Vascular Disease Professional Committee of the Chinese Association of Integrative Medicine in October 1995 [14]; (4) treatment with DPVT drugs for a duration of 7–10 days [15], with a minimum follow-up period of 3 months; and (5) written informed consent obtained from all patients for their participation in this study.
Exclusion criteriaPatients with the following conditions were excluded from the study: (1) a history of gastrointestinal bleeding, cerebrovascular hemorrhage, and/or surgery within the past three months; (2) acute or chronic inflammation, skin damage, or allergic reactions affecting the affected limb; (3) coagulation disorders; (4) refractory hypertension (blood pressure > 180/100 mmHg) [16].
Sample size calculationThe aim of this randomized controlled study was to analyze the impact of two distinct balloon pressure band compression regimens on the efficacy of thrombolysis and lower limb blood flow velocity in patients undergoing anterograde thrombolysis via the superficial dorsalis pedis vein. Sample size estimation was performed using a formula comparing sample means, with μα and μβ representing the values corresponding to a test significance level (α) of 0.05 and a type II error probability (β) of 0.2, yielding μα = 1.960 and μβ = 0.842. The difference in venous thrombus clearance rate was denoted by δ, with previous research [12] indicating a mean difference of 13 before and after intervention. Accordingly, δ was set to 13, and the estimated standard deviation (σ) was 14.1. Based on the formula: \(N=_+_)\sigma }\right]}^\), the required minimum sample size was calculated as 36. Accounting for an anticipated loss to follow-up rate of 15%, the final sample size required was 42 cases.
The study was approved by the Hospital Ethics Committee.
Research methodsInstruments and equipment1) A specialized sphygmomanometer for thrombolysis (model XJ-B, Jiangsu Yuanyan Medical Equipment Co., Ltd.) with a cuff length of 70 cm, balloon length of 40 cm, and a balloon width of 7.5 cm. 2) A color Doppler ultrasonic detector (Mindray DC-26, Shenzhen Mindray Bio-Medical Electronics Co., Ltd., Shenzhen, Guangdong). 3) A computerized infusion pump (model AJ5808, Shanghai Angel Electronic Equipment Co., Ltd.). 4) a reusable vena cava filter (466-F210AF, Cordis [Shanghai] Medical Devices Co., Ltd.).
Low-dose thrombolytic therapyIn both patient groups, indwelling needles were inserted into the superficial dorsalis pedis vein, and a computerized infusion pump was used to continuously administer a low-dose thrombolytic drug regimen. The thrombolytic solution consisted of 100 ml of 0.9% sodium chloride solution mixed with 200,000 U/d of urokinase per day, delivered at a flow rate of 50 ml/h. In addition to thrombolytic therapy, all patients received a subcutaneous injection of nadroparin (Nasaichang, 4100 U every 12 h, Nanjing King-Friend Biochemical Pharmaceutical Co., Ltd.) as an anticoagulant. Coagulation parameters were monitored daily throughout the intravenous thrombolytic therapy.
Thrombolytic therapy was discontinued under the following conditions: (1) resolution of limb swelling and pain, with venography confirming complete thrombus dissolution, restored blood flow, and unobstructed venous lumen; (2) occurrence of treatment-related complications such as venous inflammation or bleeding; (3) no significant improvement in symptoms such as swelling and pain of the affected limb or no change in intravenous thrombosis on angiography after five consecutive days of treatment; (4) fibrinogen levels dropping to < 1.0 g/L [17, 18].
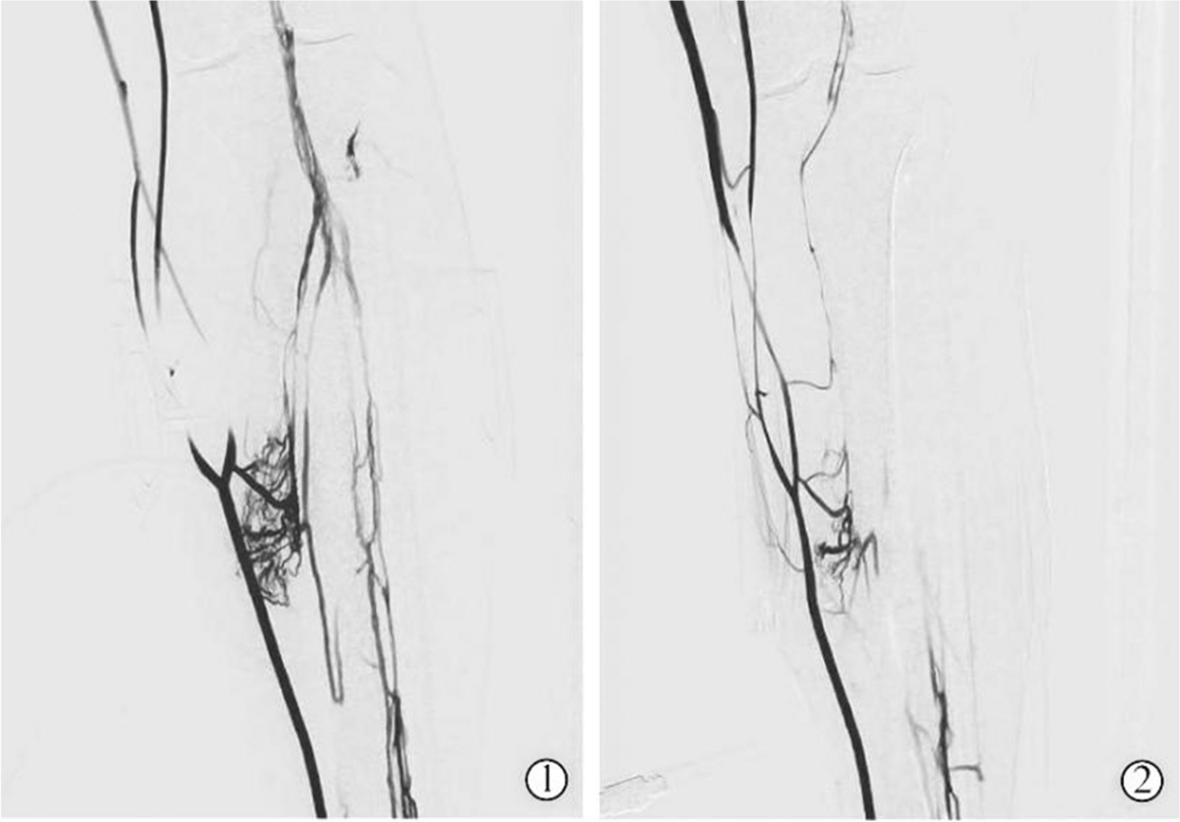
Methods of blocking superficial venous blood flowThe blood flow of superficial veins of patients in both groups was obstructed using a specialized thrombolysis sphygmomanometer. The occlusion pressure was adjusted to achieve complete disappearance of superficial vein imaging via Digital Subtraction Angiography (DSA) while ensuring complete visualization of deep veins (Figs. 1 and 2). Since each individual’s veins are distinct, the required pressures are also different, making the approach personalized.
(1)Control group: Prior to thrombolysis, the lower edge of the cuff of the special sphygmomanometer for thrombolysis was placed 15 cm above the highest bony landmark of the medial malleolus, and the cuff was wrapped around the limb, maintaining a space sufficient to accommodate one finger. The rotational compression protocol was as follows: after initiation of thrombolysis, alternating cycles of inflation and deflation were performed for 15 min, followed by a 15-min pause, continuously repeated until the completion of the thrombolytic therapy.
(2)Experimental group: Before initiating superficial venous thrombolysis therapy, a specialized thrombolysis sphygmomanometer was used to apply compression alternatively above the ankle and below the knee. The procedure involved positioning and applying pressure above the ankle as per the same parameters used in the control group. Additionally, the upper edge of the pressure band below the knee was placed 10 cm below the midpoint of the patella, and the cuff was wrapped around the limb, ensuring a one-finger space. The rotational compression protocol involved inflating the pressure band above the ankle for 15 min, followed by relaxing the pressure. Immediately after, the pressure band below the knee was inflated for 15 min, then relaxed. This cycle of alternating compression was repeated until the conclusion of the thrombotic treatment.
Fig. 1
The deep venous opacification of the lower limbs under pressure via balloon pressure band. The optimal pressure for venous occlusion is determined based on the opacification status of the deep veins
Fig. 2
Cannulation of the dorsal superficial vein of the foot (left); balloon pressure band (right)
Quality control(1) Preparation of testing instruments: The same model of infusion pump, specialized thrombolysis sphygmomanometer, and color Doppler ultrasonic detector were used in all tests. The performance of all instruments and equipment was verified to be optimal before use. (2) Data collection stage: The intraoperative procedures for all patients were consistently performed by the same group of doctors and catheter room nurses. Data collection during procedures was carried out by a single designated nurse from the catheter room. The nursing staff of the ward underwent standardized training from physicians on the correct use of the thrombolysis sphygmomanometer and compression protocols to ensure uniformity in nursing procedures and techniques. Measurements of venous blood flow velocity were conducted by the same sonographer for all patients. (3) Data verification and entry: Data entry was conducted independently by two staff members and cross-verified to ensure the accuracy and integrity of the data entered.
Evaluation procedure (1)Limb circumference difference and detumescence rate: The patient was positioned supine, and the attending nurse placed the upper edge of a measuring tape 10 cm below the midpoint of the patella every day. The measuring tape was wrapped around the leg in a complete circle, and the circumference of the leg was measured. The difference in limb circumference was defined as the difference between the circumference of the affected limb and the circumference of the healthy limb. The limb detumescence rate was calculated as follows:
$$\text= (\text-\text) /\text\times 100.$$
(2)Marder score and limb venous patency rate: The Marder score, a widely accepted measure proposed by Professor Marder in 1977, was used to quantify the extent of intravascular thromboembolism in patients with DVT [19]. Each patient underwent a minimum of two evaluations: the first was during venography at the time of admission, and the second was upon review of venography before removal of the thrombolytic catheter. This score was determined by two experienced interventional physicians (with over five years of experience), who evaluated images uploaded to the hospital’s Picture Archiving and Communication System (PACS) [19].
The venous vascular patency rate was calculated as follows [20]:
$$\text= (\text-\text) /\text\times 100.$$
(3)Venous blood flow velocity of lower extremities: Blood flow measurements of the femoral and popliteal veins were conducted using the Mindray DC-26 color Doppler ultrasound detector with a 5–12 MHz probe. The femoral vein, located in the groin, is positioned obliquely medial to the femoral artery, while the popliteal vein is located in the popliteal fossa and runs parallel to the popliteal artery. After identifying the measurement site, markings were made for consistency across repeated assessments. Blood flow velocities in the femoral and popliteal veins were recorded before thrombolysis (baseline) and at 30 min, 45 min, and 60 min post-thrombolysis.
Statistical analysisSPSS 22.0 statistical software was used for data analysis. Measurement data conforming to a normal distribution were represented using the mean ± standard deviation (\(\overline\) ± s). An independent samples t-test or analysis of variance (ANOVA) was used for comparison between groups, while the paired t-test was used for within-group comparisons of pre- and post-intervention. Categorical data were represented as the number of cases and percentages (%), with comparisons made using the x2 test. For repeatedly measured data, repeated measures ANOVA was used to evaluate the effects of the intervention across different time points. The difference was considered statistically significant at a P value < 0.05.
Comments (0)