
Remember me
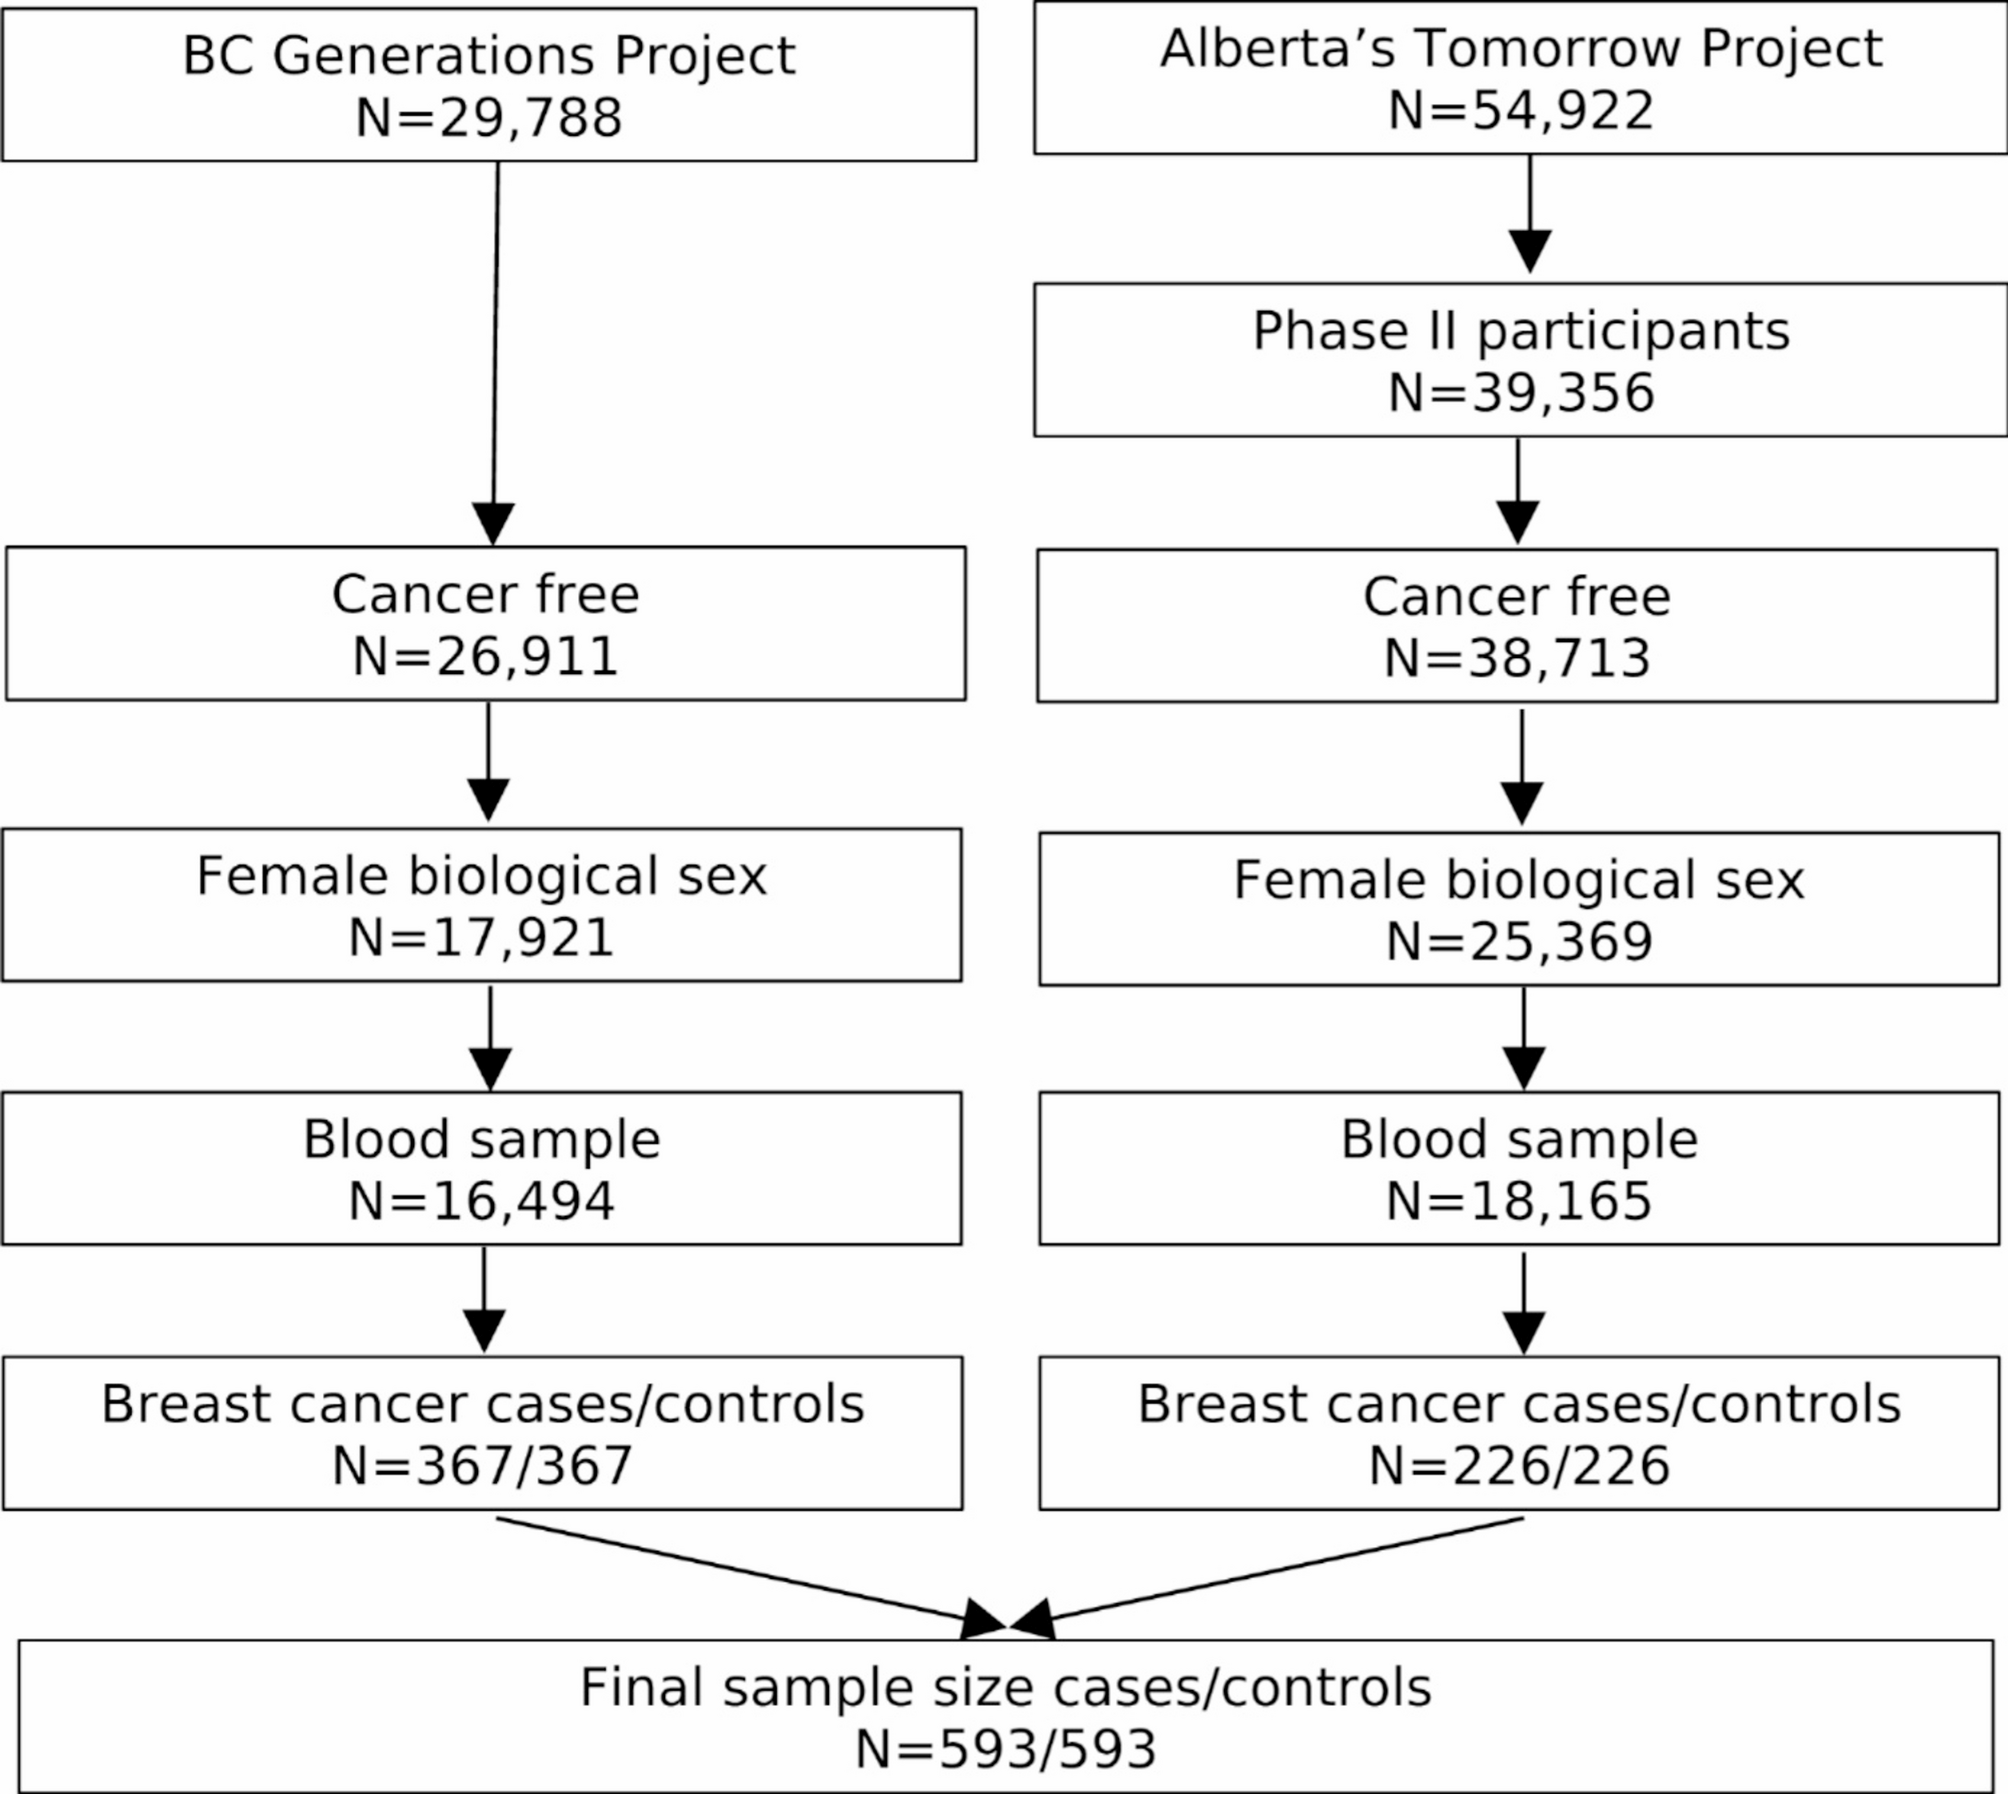


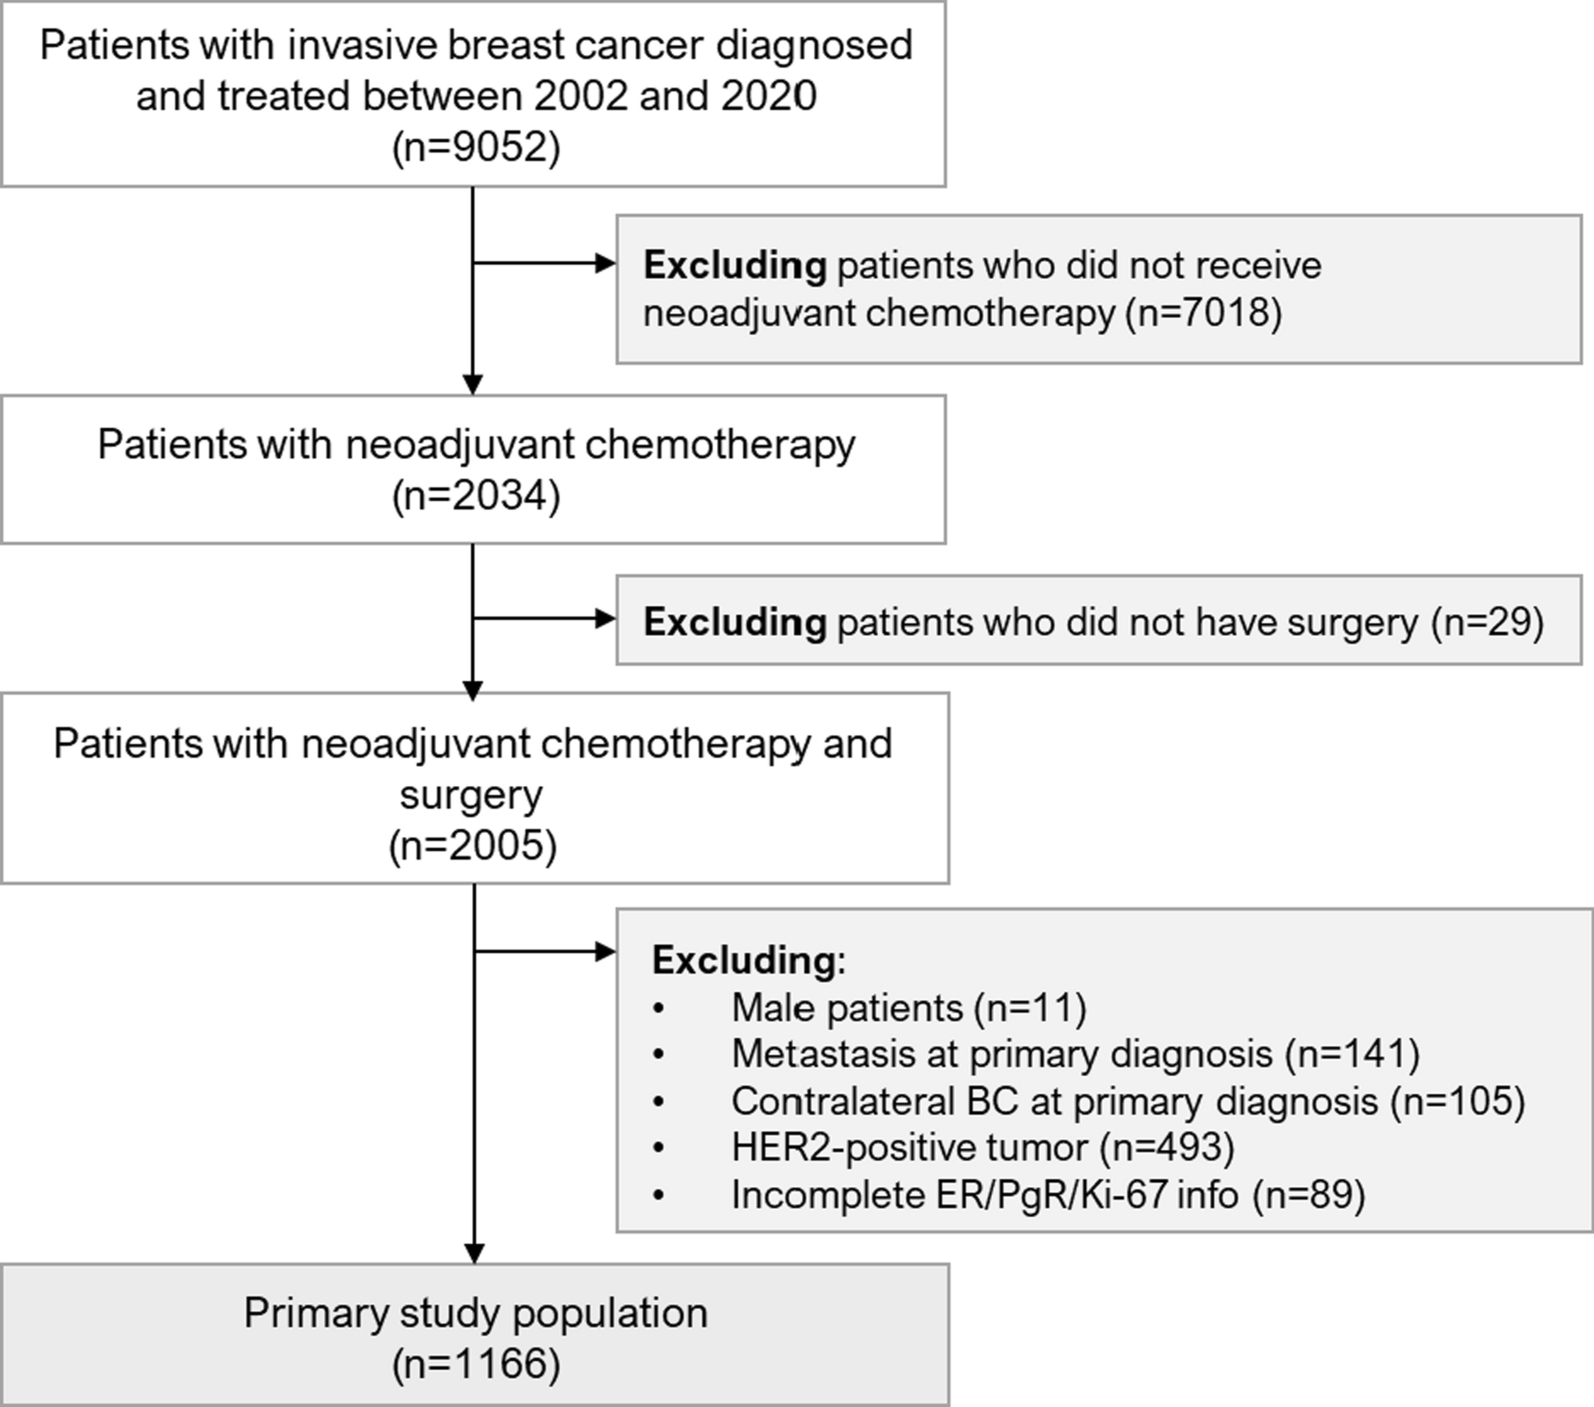
This retrospective, single-center, hospital-based observational study included 1166 patients with HER2-negative BC from the Erlangen Neoadjuvant Study Breast (ERNEST-B) study [12] who underwent neoadjuvant chemotherapy from 2002 to 2020, were ≥ 18 years of age, and had available information about their pCR status. Patients with metastases or contralateral breast cancer at primary diagnosis and patients with incomplete biomarker information were excluded. Approval for the analyses was obtained from the ethics committee of the University of Erlangen–Nuremberg. Further information is provided in Fig. 1 and the Supplement.
Fig. 1
Patient flow diagram for the primary study population (CONSORT diagram). BC, breast cancer; ER, estrogen receptor (expression); PgR, progesterone receptor (expression)
Data were collected prospectively in accordance with the breast center certification requirements of the German Cancer Society. Follow-up data were collected for ≤ 10 years after the primary diagnosis.
All histopathological parameters were documented from the original pathology reports. Tumor grade, tumor type, HER2 status, ER/PgR expression, and Ki-67 staining were assessed as part of clinical routine testing on formalin-fixed, paraffin-embedded tumor tissue at initial diagnosis. The staining procedures are described in the Supplement.
Study outcomepCR was defined as a complete absence of tumor cells from the breast (ypT0) and lymph nodes (ypN0) after chemotherapy at the time of surgery.
Disease-free survival (DFS) was defined as the period from the date of diagnosis to either the earliest date of disease progression (ie, distant metastasis, local recurrence, or death from any cause) or to the last date the patient was known to be disease free within the 10-year maximum observation time.
Univariable statistical analysesThe possibly nonlinear relationship between the biomarkers ER, PgR, and Ki-67 (each continuous, 0% to 100% of positively stained cells) and pCR (yes vs no) was described using natural cubic spline functions. Optimal cutoff values for these biomarkers were calculated using the minimum p value approach. Full details are provided in the Supplement.
Developing pCR prediction modelsSeveral logistic regression models were fitted to assess different usages of the biomarkers ER, PgR, and Ki-67 for predicting a patient’s likelihood of pCR. A logistic regression model (hereafter referred to as the basic model) was set up with established predictors for pCR: age at diagnosis (continuous), inverse body mass index (1/BMI, continuous), tumor stage (ordinal, cT1–cT4), grade (ordinal, grade 1–grade 3), lymph node status (categorical, cN0 vs cN +) and tumor type (categorical; ductal, lubular, other). Continuous predictors (age, 1/BMI) were used as cubic spline functions in which the degrees of freedom (df; 1 or 2) were determined using the Akaike information criterion (AIC). Missing predictor values were substituted by predicted expected values based on nonmissing data. All other prediction models were extensions of the basic model, including the biomarkers of interest.
Two logistic regression models were fitted with the biomarkers of interest as binary categorical predictors, one using established cutoff points (1% for ER and PgR [9], 14% for Ki-67 [15]) and the other using optimal cutoff points from the univariable analyses mentioned in the Univariable Statistical Analyses subsection. The biomarkers ER, PgR and Ki-67 were used continuously (0% to 100% of positively stained cells) as natural cubic spline functions, with 1 to 3 df in 27 (ie, 33) further regression models considering all combinations of df. To improve prediction, shrinkage of regression coefficients after estimation was applied [16].
Internal assessment of prediction modelsThe performance of the models in relation to calibration and discrimination was assessed using the mean squared error (MSE), receiver operating characteristic (ROC) curve, and area under the ROC curve (AUC). These measures were obtained by threefold cross-validation with 100 repetitions in order to obtain stable and realistic results [17,18,19]. In particular, all model-building steps were performed using training data, and the performance of the model was assessed using validation data that had not been used for model building. Apparent measures on the complete dataset were calculated to assess overfitting. In addition, the AIC was used as an alternative model performance measure. It was applied to the complete dataset and took overfitting into account by penalizing complex models.
The model with the smallest cross-validated MSE was considered the final model, which had the best usage of the biomarkers ER, PgR, and Ki-67 in comparison with the other usages [17, 18]. It was fitted on the complete dataset and analyzed in greater detail. An explicit formula for a patient’s predicted pCR probability (pCR-prob) was derived, implemented in an online calculator, and graphically presented as a nomogram. Model performance was also assessed using the Hosmer–Lemeshow calibration plot and χ2 test, as previously done [20]. Cross-validated sensitivities and specificities are presented. Spearman correlation coefficient ρ was calculated for pCR-prob and the IHC3 + C score, which incorporates ER, PgR, and Ki-67 (IHC3) and clinical predictors (C) and provides prognostic information on the risk of distant recurrence [21]. The IHC3 score is virtually identical to IHC4 when HER2 is negative [21].
The association between pCR-prob and the impact of pCR on the prognosis was analyzed using a Cox regression model with the following predictors: observed pCR status (yes vs no), pCR-prob obtained from the final logistic regression model as a cubic spline function with 2 df, and the interaction between the two predictors. To obtain hazard ratios for pCR (yes vs no) as a continuous function of pCR-prob, 20,000 random sample splittings were carried out in which the final model was fitted on half the data first and the Cox regression analysis was then performed on the remaining half.
Kaplan–Meier curves for DFS are shown in accordance with recently suggested pCR probability groups [3] and IHC3 + C risk classes.
External validation of the final prediction modelThe observational Hannover Breast Cancer Study (HaBCS [22], n = 338, see Supplement) and two randomized clinical trials (GeparSepto [23], n = 781; GeparOcto [24], n = 269; see Supplement) were each used to validate the final prediction model that had been fitted on the primary study dataset. The discrimination ability was assessed using the AUC. Its 95% CI was estimated using 10,000 bootstrap samples. Calibration was checked using a calibration plot in addition to a simple logistic regression model with observed pCR as the outcome and the logit of pCR-prob as the only predictor (hereafter termed the calibration model). If the intercept significantly (p < 0.05) differed from 0, or if the slope significantly differed from 1, then the calibration intercept and slope were used to update the original prediction model for future application in the validation cohort [19, 25].
The final prediction model was further assessed (AUC) in subgroups according to hormone receptor status to control for heterogeneity within and across study populations.
Calculations were carried out using the R system for statistical computing (version 4.1.1; R Foundation for Statistical Computing, Vienna, Austria).
Comments (0)