
Remember me
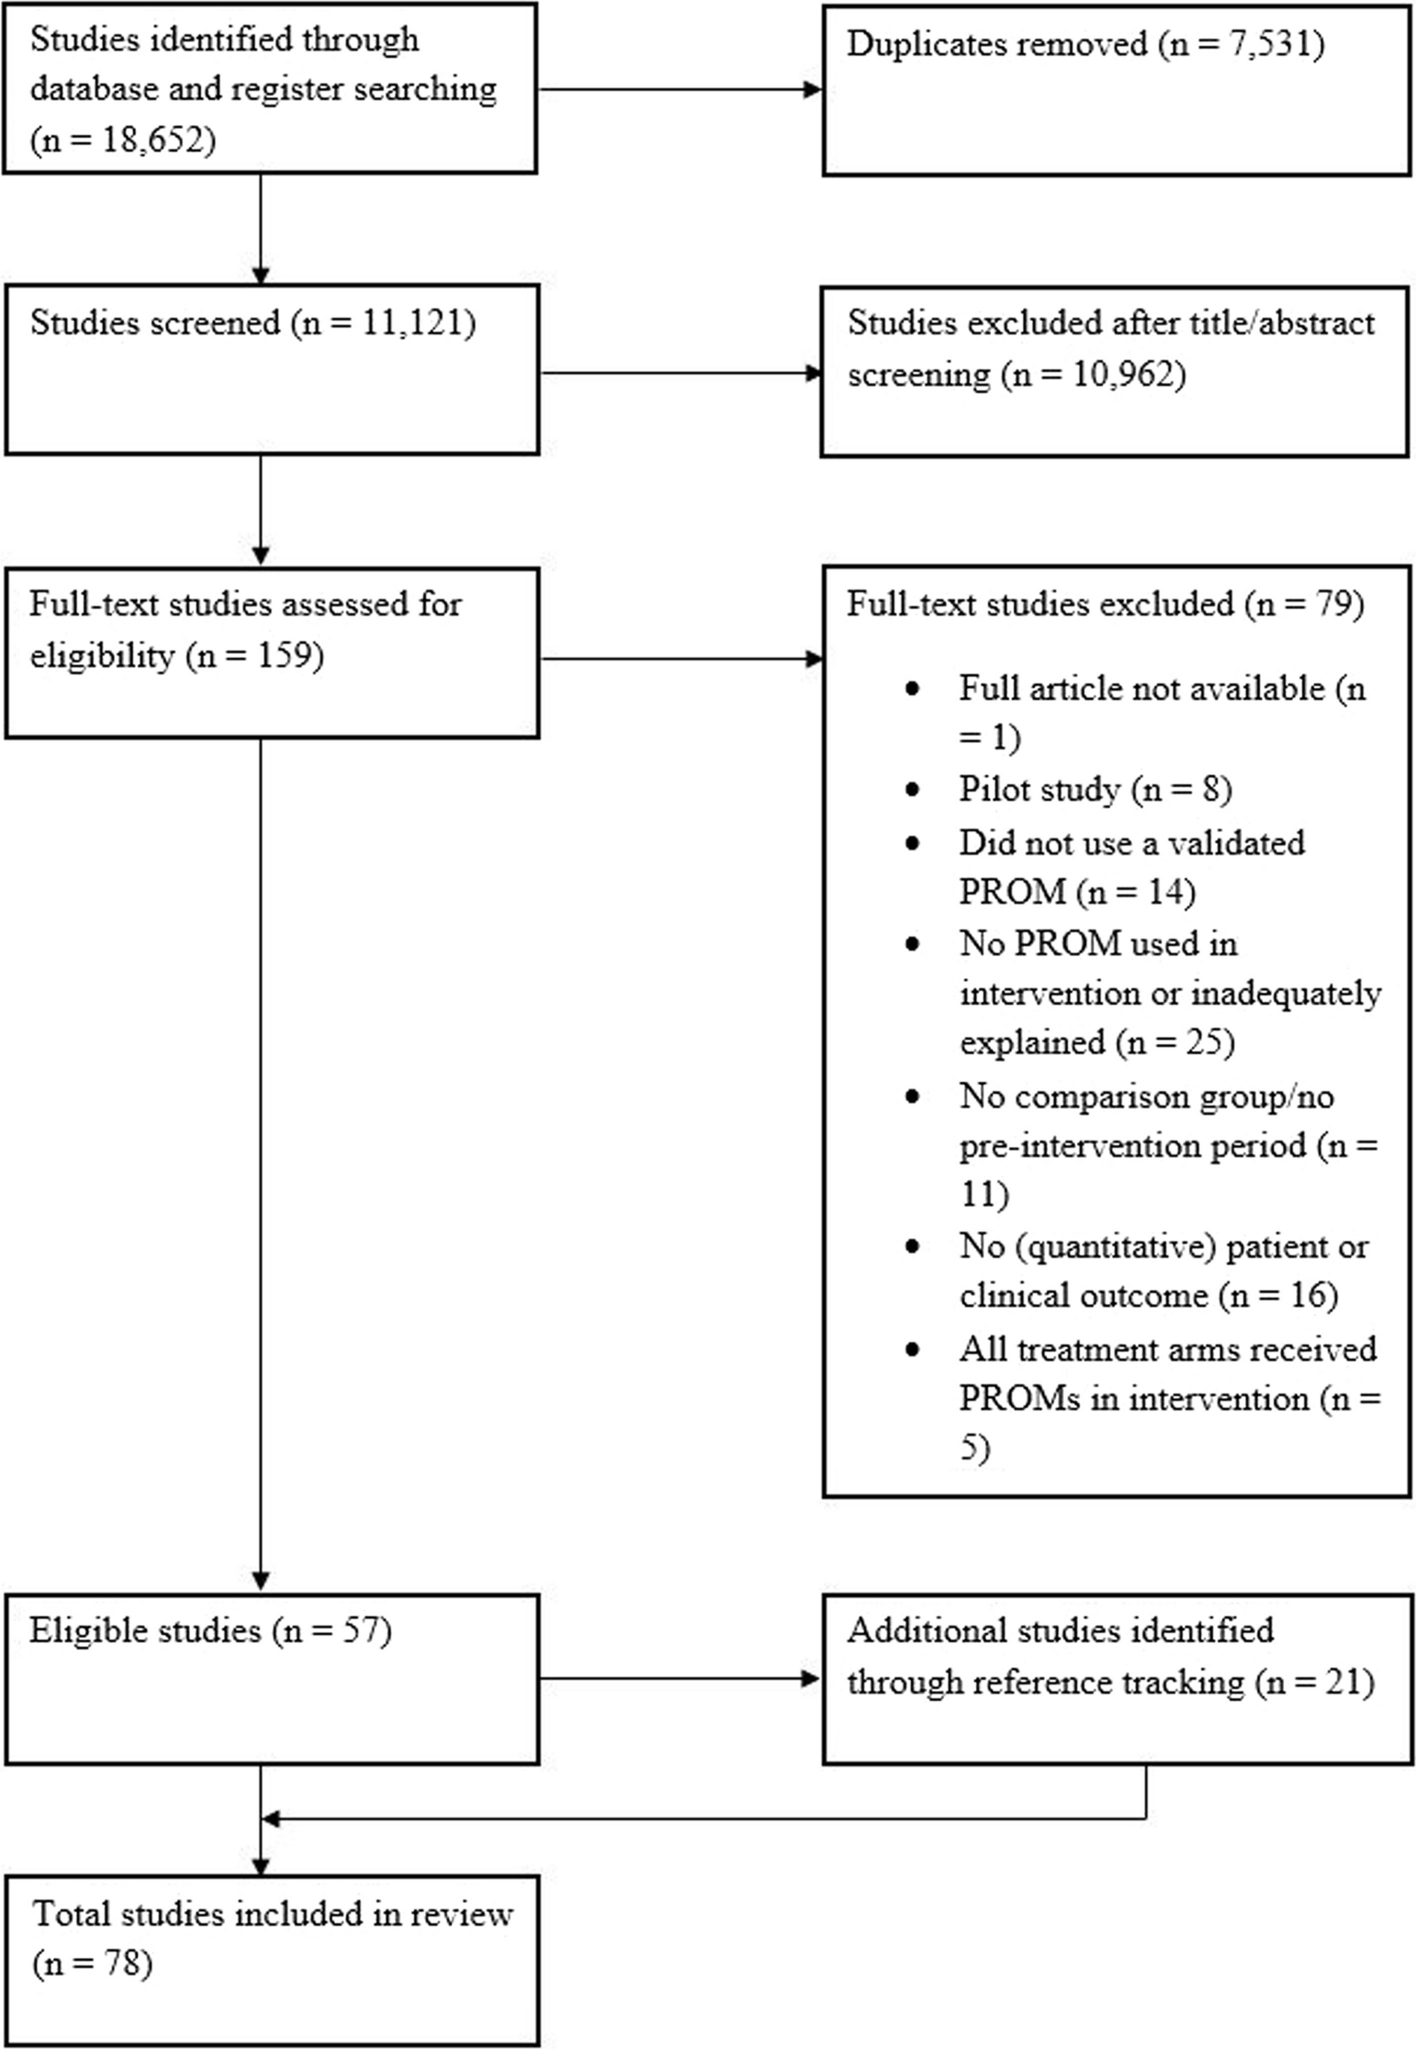
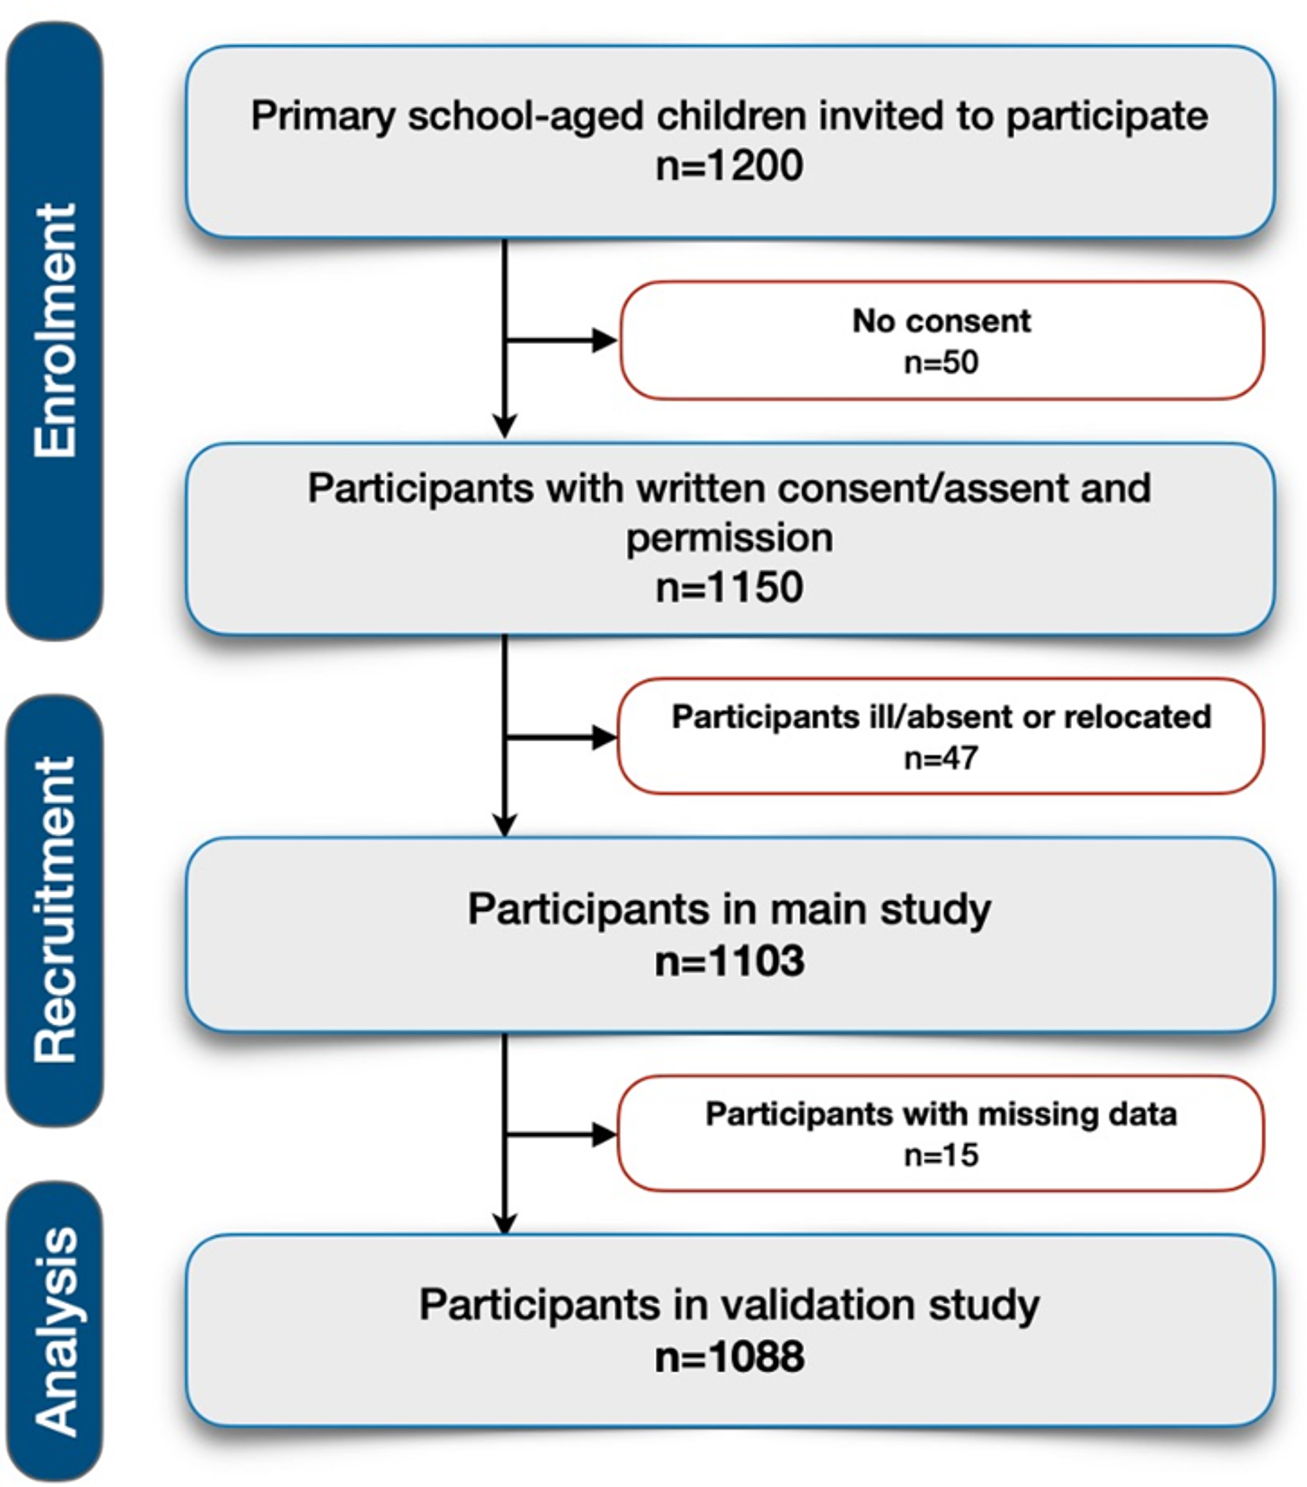
The PRISMA diagram depicting the selection process is presented in Fig. 1. A total of 18,652 records were identified. After removing duplicates, 11,121 records were screened at title-abstract level, of which 159 were screened at full-text; 57 records were found to be eligible for inclusion [17, 19, 28, 34,35,36,37,38,39,40,41,42,43,44,45,46,47,48,49,50,51,52,53,54,55,56,57,58,59,60,61,62,63,64,65,66,67,68,69,70,71,72,73,74,75,76,77,78,79,80,81,82,83,84,85,86,87,88]. Through reference tracking another 21 records were identified [17, 89,90,91,92,93,94,95,96,97,98,99,100,101,102,103,104,105,106,107,108], leading to a total of 78 included studies. Two studies presented outcomes in two separate publications; these were combined resulting in 76 unique studies [17, 74, 75, 87].
Fig. 1
PRISMA flowchart of study selection
Study characteristicsAn overview of study characteristics, PROMs used, overall study impact and quality is presented in Table 1 (micro-level) and Table 2 (meso-/macro-level). Below we shortly describe the included studies: for a more detailed description of study characteristics refer to Supplementary Material 2, and for extended tables of study characteristics, quality assessment and outcomes extracted refer to Supplementary Material 3.
Table 1 Study characteristics at the micro-level (sorted by medical domain)Table 2 Study characteristics at the meso-/macro-level (sorted by medical domain)Micro-levelSixty-eight out of 76 studies provided evidence on the use of PROMs at the micro-level [17, 19, 28, 34,35,36, 38,39,40,41,42,43,44, 46,47,48, 50,51,52,53,54,55,56, 58, 59, 62,63,64,65,66,67,68,69,70,71, 73,74,75,76,77,78,79,80,81,82,83,84,85,86,87,88,89,90,91,92,
Comments (0)