Study population
The present cohort included a selection of patients from the prospective tumor-specific T-Cell IMMunity in patients with solid tumors study (TCIMM study). This prospective observational cohort study aimed to understand the immune factors related to the efficacy and side effects of immunotherapy in treated cancer patients by performing an in-depth analysis of systemic and intra-tumoral immune parameters using blood, tumor, intestinal and fecal samples.
The TCIMM study included patients aged 18 years or older, with a histological or cytological confirmed solid tumor, who received immunotherapy between 2015 and 2023 and had a WHO score of 0–2 at the time of study entry. Written informed consent was obtained from all participants. Patients presenting with severe anemia (Hb < 6.0 mmol/L), human immunodeficiency virus (HIV) or chronic hepatitis B or C infection were excluded for safety reasons. Peripheral blood samples were drawn at baseline (prior to treatment), during treatment and after treatment at 1 month, 3 months and 6 months. The study was approved by the Medical Ethics Committee of Leiden University Medical Center (Committee of Medical Ethics; NL59959.058.17). All patients signed informed consent.
For the current study, patients were eligible if they had irresectable stage IIIC or stage IV melanoma and started anti-PD1 treatment as first line monotherapy. In total, 60 patients were included. For the immunological analyses, patients were randomly selected, to avoid any potential sources of biais, and divided in 3 almost equally large groups of patients composed of young patients (< 65 years) (n = 22), old patients without frailty (n = 19) and older patients with frailty (both > 65 years) (n = 19).
Frailty definition
The Clinical Frailty Scale (CFS) was used to define frailty in the cohort and was collected retrospectively. The clinical frailty scale is a 9-point scale that quantifies frailty based on function in individual patients. It is complemented by a visual chart to assist with the classification of frailty. Higher scores indicate increased frailty and associated risk [21]. The validity of retrospective CFS assignment has been demonstrated in various studies [22,23,24,25]. Patients with a CFS score of 4 or higher were classified as pre-frail or frail, thus categorized in the “older patients with frailty” group. Considering the relatively fit nature of the cohort with only few patients with a CFS of 5 or higher, a CFS cut-off of 4 instead of 5 was used to define frailty. However, previous studies have employed a CFS cut-off of 4 to define frailty, with the frail patients to experience poorer outcomes supporting the validity of our approach [26]. Patients with a score of 0–3 were classified as non-frail.
Clinical data
All clinical data was registered from medical charts. This information about patient and tumor characteristics included comorbidity defined by the Charlson Comorbidity Index (CCI) [27], tumor characteristics (superficially spreading, acro lentiginous, desmoplastic, nodular, lentigo maligna), stage of disease, and detailed information on ICI treatment as well as previous treatment (with a BRAF inhibitor, type of anti-PD-1 treatment) and outcome.
Response outcomes
Imaging assessment, including CT or PET CT or MRI (in case of cerebral metastases), was performed after 3 months and 6 months of treatment, or in some cases earlier if there were clinical signs of progression before these timepoints. Responses were evaluated according to the RECIST 1.1. For the current study, the radiological response to treatment was categorized as follows: a partial or complete response observed at 3 months. Should the disease remain stable or present a mixed response at the 3-month time point, assessment was deferred to the 6-month mark. A partial or complete response at 6 months, or the persistence of stable disease at this time point, was classified as a response to treatment. In case progression occurred after either 3 or 6 months, the patient was classified as a non-responder to treatment.
Sample collection
The blood sampling of patients on anti-PD-1 immunotherapy was done at baseline as part of the study “Longitudinal analysis of tumor-specific T-cell immunity in patients with solid tumors” (NL59959.058.17). 100 mL of blood of patients prior to immunotherapy were collected in sodium heparin tubes (BD Bioscience, Drachten, the Netherlands) and processed within 6 h upon withdrawal. Peripheral blood mononuclear cells (PBMCs) were isolated and cryopreserved. Buffy coats from three healthy donors after informed consent were obtained from Sanquin (Leiden, the Netherlands) and the isolated PBMCs used as third parties for the mixed lymphocyte reaction (MLR) assay [28].
Isolation of white blood cells
Viable PBMCs were purified by Ficoll (LUMC pharmacy, Leiden, the Netherlands) density gradient separation, washed with Phosphate buffered saline (PBS; Fresenius Kabi, Huis ter Heide, the Netherlands), cryopreserved in 80% fetal calf serum (FCS; Serana Europe, Pessin, Germany) and 20% dimethyl sulfoxide (DMSO; WAK-Chemie Medical, Steinbach, Germany) and stored in the vapor phase of liquid nitrogen until further use [28]. The handling, immune assays and analysis of the PBMCs were done according to the standard operation procedures (SOPs) of the Leiden department of Medical Oncology by trained personnel [29].
Immune assays
The immune profiles between the 3 groups of patients in blood samples taken at baseline were compared, and it was investigated whether the obtained immune cell populations were associated with a response to the applied immunotherapy. We performed the following analyses.
Immunophenotyping of PBMCs
The cryopreserved PBMC samples were thawed in IMDM + 10% FCS, washed with Iscove’s Modified Dulbecco’s Medium (IMDM, Thermo Fisher Scientific, Eindhoven, the Netherlands) + 10% FCS and counted according to standard SOP, as published previously [28]. The samples of the 3 above-mentioned patient groups were divided equally between the 3 staining runs.
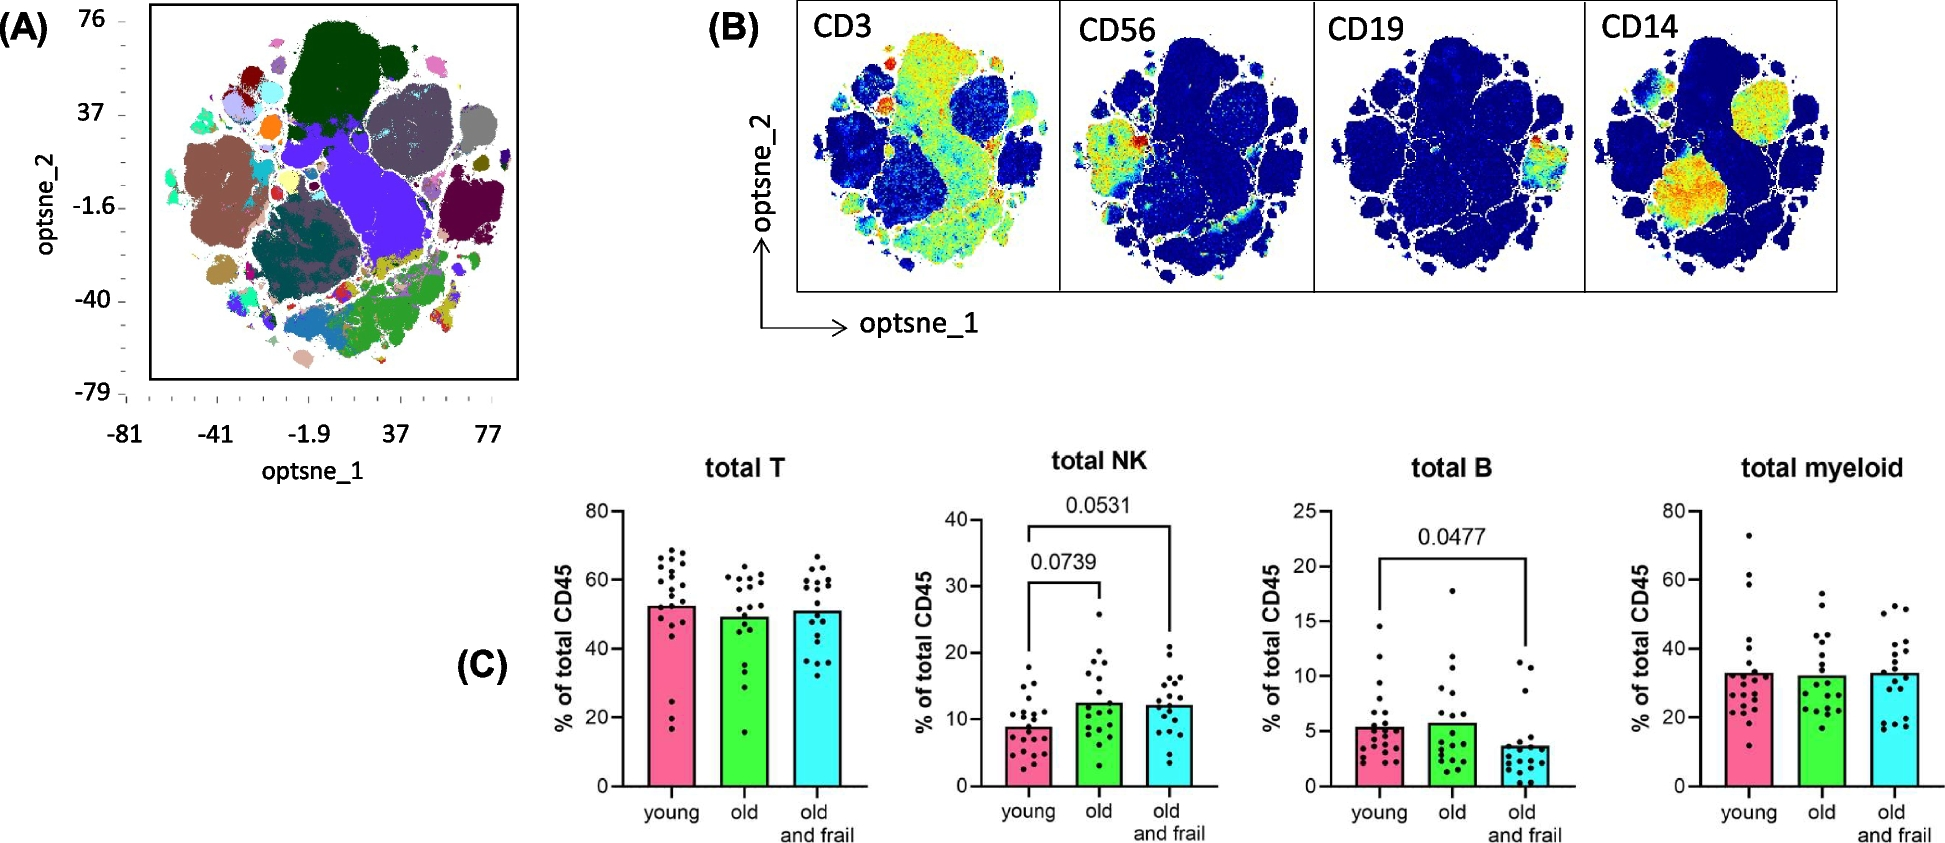
Immunophenotype of the PBMC was assessed by multispectral flow cytometry (AURORA, Cytek Biosciences, Amsterdam, the Netherlands) staining using our previously described 40-marker panel [28]. The PBMCs were first stained with 1:2400 diluted LIVE-DEAD zombie UV fixable amine-reactive dye (Biolegend Europe, Amsterdam, the Netherlands) at room temperature (RT) for 20 min, after which the cells were washed with FACS buffer consisting of PBS + 0.5% Bovine serum albumin (BSA, Sigma, St Louis, USA), and subsequently incubated with 50 µl PBS/0.5%BSA/5%Trustain FcX blocking solution (Biolegend) for 10 min on ice to block Fc receptors. Next, the cells were stained for 30 min at RT and in the dark with the cell surface antibodies in two consecutive rounds with three times washing with FACS buffer in between. Intracytoplasmic/nuclear staining was performed using the True-nuclear Transcription Factor Buffer set (Biolegend) according to manufacturers’ instruction. Details on antibodies, titers and unmixing are listed in Table S1. After staining the cells were washed twice and stored in FACS buffer. Acquisition was done within 24 h on a 5-laser Aurora CytekTM spectral analyzer (Cytek Biosciences). High-dimensional single cell data analysis was performed by opt-Distributed Stochastic Neighbor Embedding (optSNE) dimensionality reduction followed by FLOWSOM consensus metaclustering using the cloud-based OMIQ data analysis software (OMIQ, Boston, USA). OptSNE/FLOWSOM analysis were performed on the total CD45 + immune cell population, as well as on cellular subsets (T cells, natural killer (NK) cells, B cells and myeloid cells after gating on CD3 + , CD3-CD56 + , CD19 + and CD3-CD56-CD19-remaining cells, respectively). The different cell populations were visualized and quantified. Expression levels of each of the indicated markers were depicted for the individual cell populations and frequencies of CD3 T cells, NK cells, B cells and myeloid cells, and remaining cells were shown as percentage of total CD45.
Mixed lymphocytes reaction assay
The antigen-presenting capacity of PBMCs was determined in a Mixed Lymphocyte Reaction (MLR) assay as published previously [28, 30]. The MLR assay is based on a third party (allogeneic) T cells proliferation response. PBMCs from three healthy donors served as third parties for the MLR assay. The MLR assays were carried out in triplicate wells in round bottomed 96-well plates to ensure efficient third party PBMCs/patient APC (within PBMCs) contact. Irradiated PBMCs alone, as well as third party PBMCs alone, were used as negative controls. Proliferation of cells was measured by addition of 3H-thymidine (50ul/ well, stock 10 µCi/mL, Perkin Elmer, Boston, USA) for 16–18 h at 37 °C, whereafter the cells were harvested on MicroBeta glass fiber filter paper (Perkin Elmer). Incorporation of 3H-thymidine was determined on a Wallac MicroBeta TRILUX 1450 LSC & Luminescence counter (Perkin Elmer). The proliferation of the third party PBMCs is expressed as the stimulation index (SI) calculated as the ratio of the counts per minute of 3H-thymidine in MLR co-culture to that in the third party only (control) culture. A threshold of at least 3 is defined as a positive response. The number of positive responses out of the tested three third parties as well as the strength of response (SI) were determined.
Phytohemagglutinin (PHA) proliferation assay
The proliferative potential of PBMCs was evaluated in a proliferation assay [26], using PHA stimulation and 3H-thymidine incorporation (as described above). PBMCs from patients were cultured in quadruplicate wells in the presence or absence of PHA (1 ug/ml). The SI was calculated as the ratio of lymphocytes cultured with PHA over that of the unstimulated control cultured lymphocytes. To discard the outliers, we determined the mean (m) of the value of the replicate wells, then determined the most distant value (data point x). Next, we calculated the mean (m) and the standard deviation (s) of the replicate wells excluding this data point x. We considered x an outlier when x > m + 3 s or x < m—3 s. Finally, the mean was recalculated excluding the outlier point x.
Statistical analysis
Statistical evaluation was performed using the statistical package SPSS version 25.0 and Graphpad version 9.3.1. First, the baseline clinical characteristics between the three groups of patients (young, old without frailty and old with frailty) were compared using chi-square tests. Second, the differences between the cell populations as identified by OMIQ analyses between the three groups were assessed. Cell population data were not normally distributed. All cell populations were presented as percentage of the total CD45. For this, as well as for the PHA assay data the Kruskal–Wallis tests were used. The MLR assay data was analyzed using Chi-square tests. Third, the association between the presence of frailty and response to treatment was assessed using Chi-square for trend tests. Finally, the association between the cell populations and response to treatment was determined using Mann–Whitney tests. A p-value of < 0.05 was defined as statistically significant.
Laboratory environment
Immunomonitoring of patients PBMCs was performed in the laboratory of the department of Medical Oncology (LUMC) that operates under research conditions but uses standard operation procedures for all tests, with pre-established definitions of positive responses and trained personnel. This laboratory has been externally and internally audited according to the reflection paper for laboratories that perform immunomonitoring and participated in all proficiency panels of the CIMT Immunoguiding Program (CIP; of which SHvdB and MJPW are steering committee members; http://www.cimt.eu/workgroups/cip/) as well as many of the proficiency panels (including ICS gating and ELISPOT plate reading panels) of the USA-based Cancer Immunotherapy Consortium (CIC of the Cancer Research Institute) to validate its standard operating procedures (SOPs) [29].


Comments (0)