
Remember me


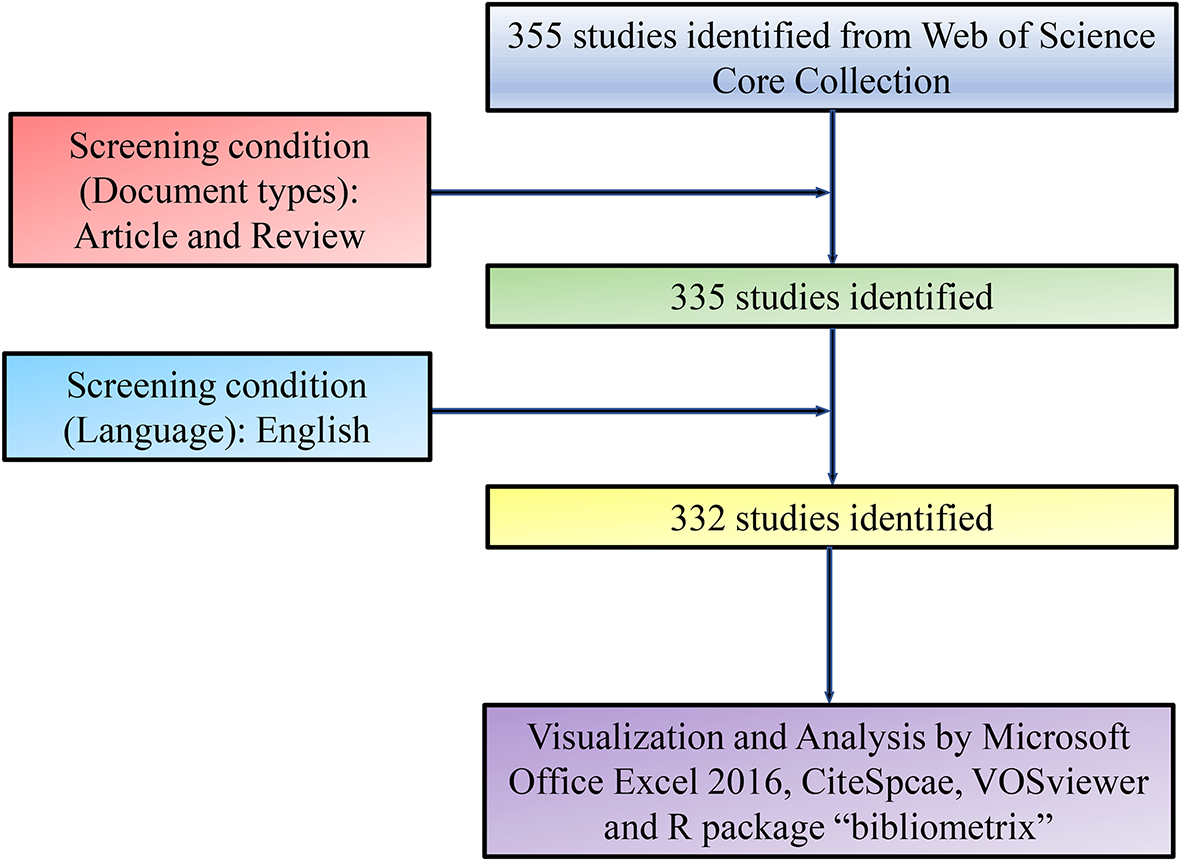

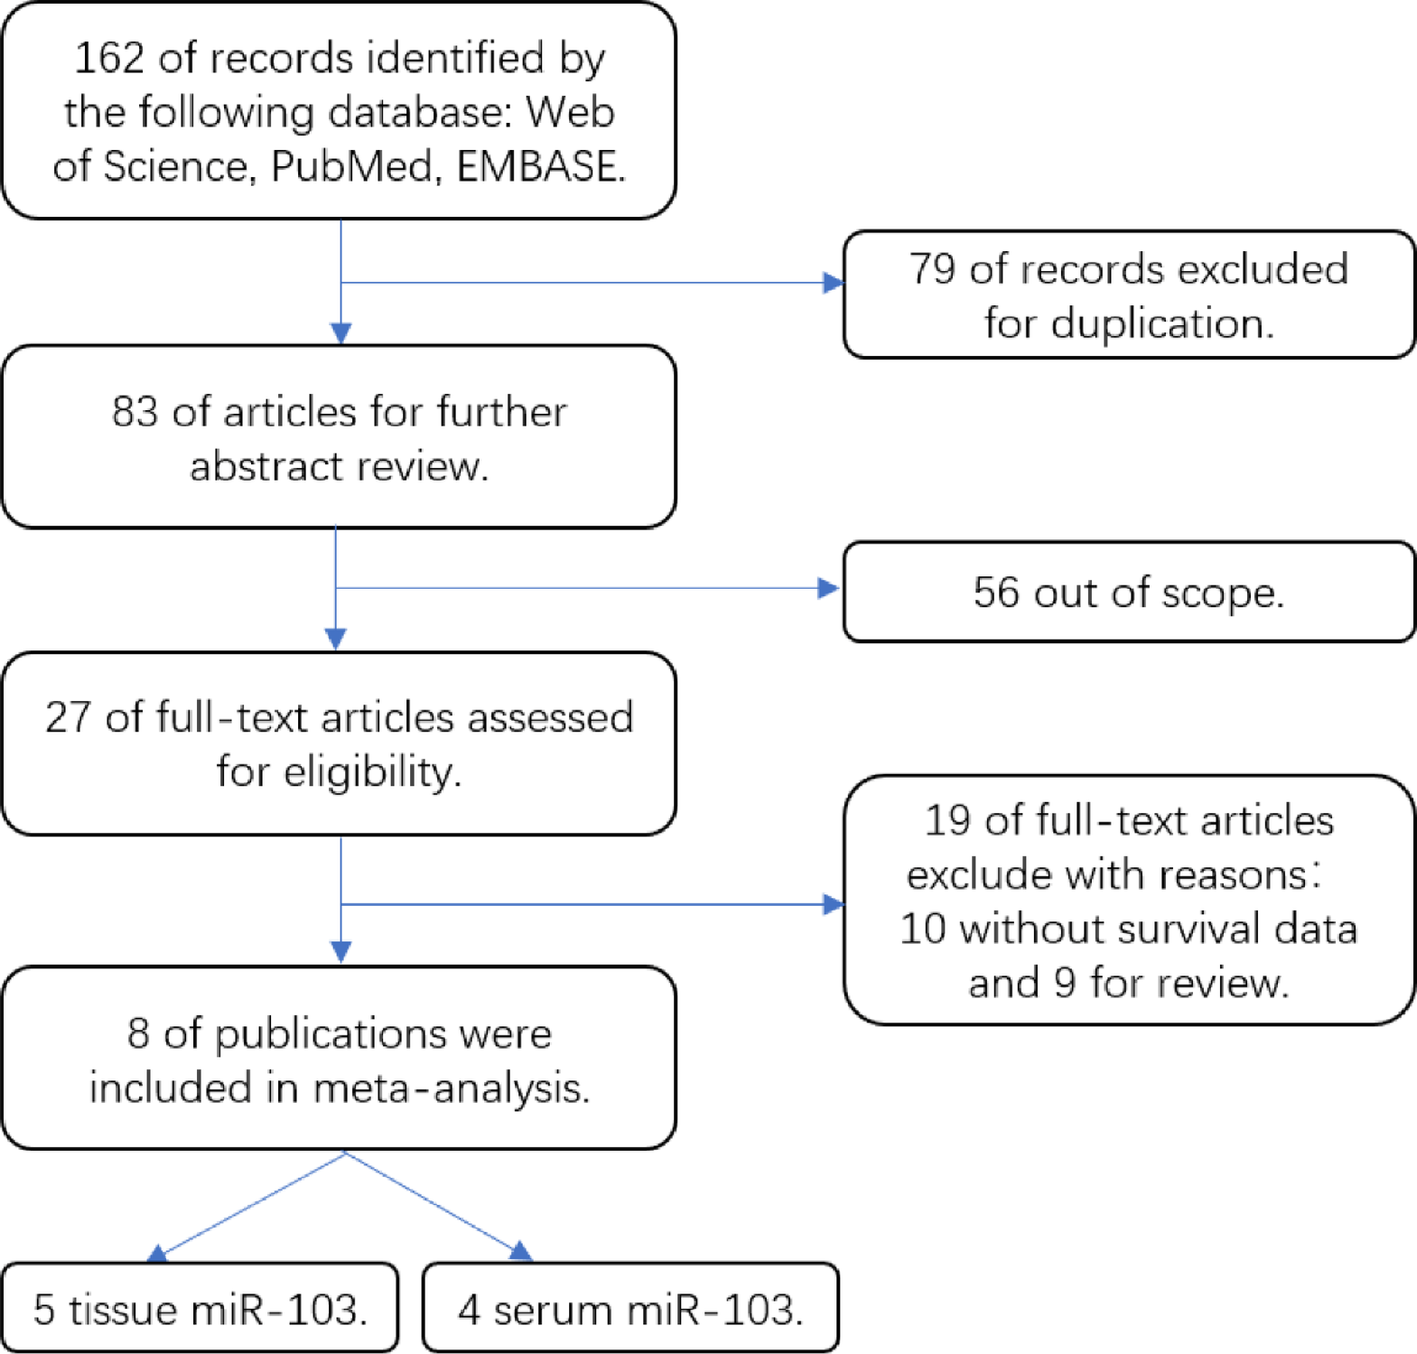

The flowchart of this study is depicted in Fig. 1. Through data mining, a dataset containing FRlncRNAs was provided in Fig. 2A. Following differential analysis, we identified 126 DEFRlncRNAs, including 105 upregulated and 21 downregulated (Fig. 2B, C).
Fig. 1 Fig. 2
Identification of DEFRlncRNAs. A Co-expression networks of ferroptosis-related genes and lncRNAs. Volcano (B) and heatmap (C) and plot of DEFRlncRNAs
3.2 Identification and verification of a prognostic signatureUnivariate Cox, LASSO, and multivariate Cox regression analyses of the data revealed 18 DEFRlncRNA pairs, all of which were included in the prognostic signature (Fig. 3A–C). We discovered that AL355353.2 serves as a protective factor against BLCA [hazard ratio: 0.516 (0.382–0.696), p < 0.001]. In contrast, AL136084.3 was identified as a risk factor for BLCA [hazard ratio: 2.038 (1.471–2.824), p < 0.001, Fig. 3C]. Functional experiments were used to assess the impacts of AL355353.2 overexpression (OE) and AL136084.3 knockdown (KD) on cell apoptosis, colony formation, and proliferation. Flow cytometric analyses revealed that, compared with the control groups, AL355353.2 OE promoted apoptosis in both 5637 (Fig. 4A2) and T24 (Fig. 4B2) cell lines (Fig. 4A1, B1). Similarly, AL136084.3 KD elevated apoptosis in both 5637 (Fig. 4A3) and T24 (Fig. 4B3) cell lines. Additionally, colony formation was examined using a light microscope. In cell line 5637, the AL355353.2 OE group (Fig. 5A2) showed a notable reduction in the number of cell colonies compared to the control group (Fig. 5A1). A similar observation was observed among T24 cells (Fig. 5B2). In addition, compared to the control group (Fig. 5A1, B1), the AL136084.3 knockdown group exhibited a marked decrease in the number of cell colonies in both 5637 (Fig. 5A3) and T24 (Fig. 5B3) cell lines. The CCK-8 assay demonstrated a significant reduction in cell proliferation with the AL355353.2 OE in both 5637 (Fig. 6A) and T24 (Fig. 6B) cell lines. Similar outcome was observed in both 5637 and T24 cell lines in the AL136084.3 knockdown group.
Fig. 3
Identification of DEFRlncRNA pairs signature. A,B The Lasso regression model. C Forest plot of 18 DEFRlncRNA pairs formed after multivariate Cox regression analysis
Fig. 4
Evaluation of AL355353.2 over-expression (OE) and AL136084.3 knock-down (KD) on cell apoptosis. Flow cytometric analysis showed that over expression of AL355353.2 could promote the apoptosis of both 5637 (A2) and T24 (B2) cell lines, compared with control group (A1, B1). Similarly, knock-down of AL136084.3 can increase the apoptosis of 5637 (A3) and T24 (B3) cell lines
Fig. 5
Analysis of colony formation under light microscope. In 5637 cell lines, the AL355353.2 OE group (A2) displayed a diminished number of cell colonies when compared with control group (A1). Similar finding was observed in T24 cell lines (B2). Compared with the control group (A1, B1), the number of cell colonies in AL136084.3 KD group were also decreased significantly in 5637 (A3) and T24 (B3) cell lines
Fig. 6
Effects of AL355353.2 OE and AL136084.3 KD on cell proliferation. CCK-8 assay revealed that over expression of AL355353.2 could significantly attenuate cell proliferation in both 5637 (A) and T24 (B) cell lines. Similar finding was revealed in both 5637 and T24 cell lines in AL136084.3 KD group
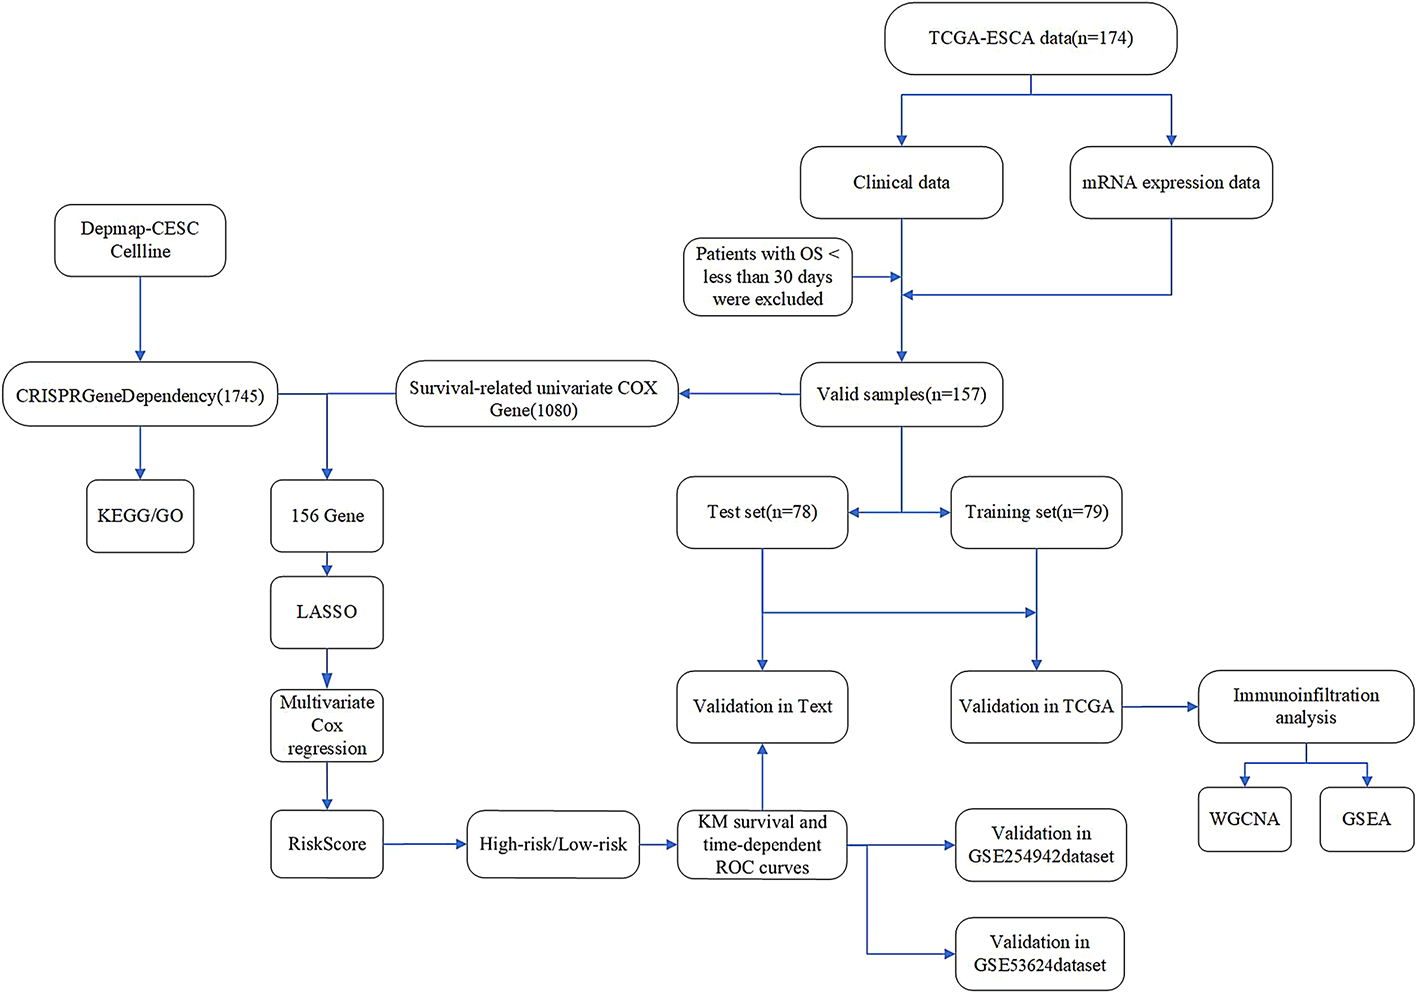
3.3 Assessment of ROC curves and clinical characteristicsFor each sample, the risk value was reckoned (Fig. 7A) and cut-off points were chosen to distinguish between high and low risks. ROC curves were generated at 1, 3, and 5 years, with all three curves displaying a high area under the curve (AUC; Fig. 7B). The significant larger area under of the curve (AUC) of the 5-year ROC curve suggested the excellent prognostic potential of the signature (Fig. 7C). In high-risk and low-risk groups classified by the calculated risk score, a significantly higher survival rate was detected in the latter group (Fig. 8A–C).
Fig. 7
ROC curve of DEFRlncRNA pairs signature. A For the risk score of each BLCA patient, the cut-off value is the maximum inflection point. B The ROC curves at 1, 3, and 5 years. C Comparison of 5-year ROC curve with other clinical characteristics
Fig. 8
Survival analysis assessment of DEFRlncRNA pairs signature. Risk score (A) and survival status (B) of BLCA patients. C KM survival analysis between high-risk group and low-risk group
3.4 Validation of the independent prognostic significance of DEFRlncRNA pairsWe then performed univariate and multivariate Cox regression analyses of the risk scores, age, sex at birth, tumor grade, and tumor stage. We found that age, tumor stage, and risk score were independent prognostic factors (Fig. 9A, B). Subgroup analyses based on the risk factors were then conducted. A higher survival was observed in both the young (≤65 years of age) and elderly subgroups (>65 years of age) of the low-risk BLCA patients than in those of the high-risk subgroups (p < 0.001, Fig. 9C, D). Furthermore, when patients were divided by tumor stage into early (stages I–II) and late (stages III–IV), and a survival analysis was performed, low-risk patients had improved survival compared to that of high-risk patients (p < 0.001, Fig. 9E, F).
Fig. 9
Independent prognostic validation of DEFRlncRNA pairs signature. Forest plot obtained from A univariate COX regression analysis and B multivariate COX regression analysis. KM survival curves between C the young group and D the old group for the high-risk and low-risk groups. KM survival curves between E the early group and F the old group for the high-risk and low-risk groups
3.5 Correlation between DEFRlncRNAs and clinicopathological features in BLCA patientsA relationship between the DEFRlncRNA pair signature and clinicopathological features was examined through the chi-square (Fig. 10A) and the Wilcoxon signed-rank tests (Fig. 10B–F). Both tests demonstrated a significant correlation between the risk score and age, tumor grade, clinical stage, and T and N stages.
Fig. 10
Clinical relevance evaluation of DEFRlncRNA pairs signature. A–F Heat Plot and Scatter Plot of Risk Score and Clinical Relevance. The results showed that B age, C grade, D clinical stage, E T stage and F N stage were significantly associated with risk score
3.6 Effects of AL136084.3 on patients with BLCAWe further used the Starbase database to investigate the expression of AL136084.3 on patients with BLCA. As shown in Fig. 11A, the expression of AL136084.3 was down regulated in BLCA as compare to normal samples. For patients with BLCA, those with high expression of AL136084.3 may have shorter overall survival time than those with low expression (Fig. 11B, p = 0.007). Volcano plot evaluation of differentially expressed genes between NUPR1high and NUPR1low groups was described in Fig. 11C. The R language was used to investigate the relationship between NUPR1 and COPB2, TIMM44, PPARG in BLCA (Fig. 11D, E). The relationship between AL136084.3 and NUPR1, PPARG, TIMM44 in BLCA was also explored by the Starbase database. The results revealed that AL136084.3 was positively correlated to NUPR1 (R = 0.229, p < 0.001, Fig. 12A). No positive correlation was revealed for PPARG (R = −0.072, p = 0.143, Fig. 12B). There was a weak association between AL136084.3 and TIMM44 (R = −0.116, p = 0.0189, Fig. 12C). Similar result was revealed for COPB2 (R = 0.106, p = 0.0324, Fig. 12D). Additionally, we used RIP to investigate the potential interaction between AL136084.3 and NUPR1 in bladder cancer. As shown in Fig. 12E and F, we revealed the reciprocal binding of NUPR1 and AL136084.3 (p < 0.0001).
Fig. 11
Effects of AL136084.3 on patients with BLCA. Results from the Starbase database show that the expression of AL136084.3 was down regulated in BLCA (A). For patients with BLCA, those with high expression of AL136084.3 may have shorter overall survival time than those with low expression (B). Volcano plot evaluation of differentially expressed genes between NUPR1high and NUPR1.low groups was described in C. The R language was used to investigate the relationship between NUPR1 and COPB2, TIMM44, PPARG in BLCA (D, E)
Fig. 12
The association between AL136084.3 and NUPR1, PPARG, TIMM44 in BLCA. The results revealed that AL136084.3 was positively correlated to NUPR1 (R = 0.229, p < 0.001, A). No positive correlation was shown for PPARG (R = −0.072, p = 0.143, B). There was a weak association between AL136084.3 and TIMM44 (R = −0.116, p = 0.0189, C). Similar result was revealed for COPB2 (R = 0.106, p = 0.0324, D). As shown in E and F, we revealed the reciprocal binding of NUPR1 and AL136084.3 (p < 0.0001)
3.7 Evaluation of NUPR1, COPB2, TIMM44, and PPARG in BLCAWe used the R language to further explore the effects of NUPR1, COPB2, TIMM44, and PPARG on the patients with BLCA. The AUC value for NUPR1, COPB2, TIMM44, and PPARG is 0.703 (Fig. 13A), 0.756 (Fig. 13B), 0.611 (Fig. 13C), and 0.624 (Fig. 13D). Patients with high expression of NUPR1 may have a worse prognosis than those with low NUPR1 expression (Fig. 13E). There was no significant difference in prognosis between patients with high and low expression of COPB2 and TIMM44 (Fig. 13F, G). Patients with low expression of PPARG may have a poor prognosis than those with high PPARG expression (Fig. 13H). The correlation analysis of NUPR1, COPB2, TIMM44, and PPARG are illustrated in Fig. 13I. The Lasso regression model was revealed in Fig. 13J.
Fig. 13
Effects of NUPR1, COPB2, TIMM44, and PPARG on patients with BLCA. The ROC curves of NUPR1, COPB2, TIMM44, and PPARG were revealed in A–D. Patients with high expression of NUPR1 may have a worse prognosis than those with low NUPR1 expression (E). There was no significant difference in prognosis between patients with high and low expression of COPB2 and TIMM44 (F, G). Patients with low expression of PPARG may have a poor prognosis than those with high PPARG expression (H). The correlation analysis of NUPR1, COPB2, TIMM44, and PPARG are illustrated in I. The Lasso regression model was revealed in J
3.8 Correlation between immune infiltration and DEFRlncRNAs in BLCA patientsWe later analyzed the correlation between immune infiltration and DEFRlncRNAs in BLCA patients. In the high-risk group, DEFRlncRNAs were positively correlated with the levels of tumor-associated fibroblasts, macrophages, monocytes, neutrophils, NK cells and CD8 + T cells, but negatively correlated with the levels of CD4 + naive T cells and B cell/plasma cells (Fig. 14A). Moreover, the risk score was positively correlated with expression levels of ICI-related genes, including PDL1 (Fig. 14B, p < 0.05), CTLA4 (Fig. 14C, p < 0.05), LAG3 (Fig. 14D, p < 0.05), and HAVCR2 (Fig. 14E, p < 0.05).
Fig. 14
Immune infiltration analysis and ICIs correlation analysis of DEFRlncRNA pairs signature. A The results of immune infiltration analysis showed that the risk score was positively correlated with most of the immune infiltrating cells. The results of correlation analysis between risk score and ICIs gene showed that high risk score was significantly positively correlated with PDL1 (B, p < 0.05), CTLA4 (C, p < 0.05), LAG3 (D, p < 0.05), and HAVCR2 (E, p < 0.05)
3.9 Correlation analysis between DEFRlncRNA pair signatures and sensitivity to chemotherapeutic drugsWe finally evaluated the correlation between DEFRlncRNAs and IC50 values against common chemotherapeutic drugs in BLCA. The risk score was negatively correlated with the sensitivity to cisplatin (Fig. 15A, p < 0.001), paclitaxel (Fig. 15B, p = 0.018), and docetaxel (Fig. 15C, p < 0.001), but correlated with the IC50 of gemcitabine (Fig. 15D, p = 0.31). Hence, we believed that the prognostic signature of DEFRlncRNAs was also capable of predicting the chemotherapy sensitivity in BLCA patients.
Fig. 15
Chemosensitivity of DEFRlncRNA pairs signature. The results showed that the high-risk score was negatively correlated with the IC50 of cisplatin (A), paclitaxel (B) and docetaxel (C), but was not statistically significant with the IC50 of gemcitabine (D)
Comments (0)