This research was approved by Yamagata University School of Medicine Ethics Review Board (Approval No. 2020–375; Approval Date: April 7, 2021). All participants provided written informed consent. Before study commencement, registration in the University Hospital Medical Information Network was completed (Study ID: UMIN000043879; Reception Number: R000050079; Publication Date: April 10, 2021).
The participants were surgical patients who underwent general anesthesia with intubation in our institution. The eligibility requirement was an age of 18–85 years. The exclusion criteria were allergy to any component of remimazolam; history of central nervous system disease (e.g., cerebral infarction or hemorrhage), neuromuscular disease (e.g., myasthenia gravis), uncontrolled heart or respiratory failure, renal failure (serum creatinine ≥ 2 mg/dl), or liver failure (aspartate transaminase/alanine transaminase ratio 2.5 × the upper limit of normal); and inability to provide informed consent. Patients requiring postural adjustment or isolated lung ventilation, those undergoing head-and-neck surgery and emergency procedures, and those with hemorrhage that might influence cardiac performance were also excluded. Patients receiving epidural anesthesia were not excluded.
Anesthetic management and monitoring
A transcutaneous oxygen saturation monitor, electrocardiogram device, noninvasive arterial pressure monitor, bispectral index (BIS) monitor (BIS XP; Aspect Medical Systems, Newton, MA, USA), and peripheral venous and arterial lines were applied upon entering the operating room. Before general anesthetic induction, the supraorbital forehead temperature was recorded using a zero-heat-flux (ZHF) thermometer (SpotOn; 3 M, Saint Paul, MN, USA). After general anesthetic induction, a urethral catheter with a bladder temperature sensor (BARD Silver TSC Tray; Becton, Dickinson and Company, Franklin Lakes, NJ, USA) was placed.
Before anesthetic induction, VO2 and VCO2 were measured with an indirect calorimeter (CCM Express; MGC Diagnostics, Saint Paul, MN, USA), and oxygen supply was simultaneously estimated (T1). Following preoxygenation, remifentanil (0.2–0.5 μg/kg/min) and remimazolam (Anerem 50 mg; Mundipharma K.K., Tokyo, Japan) (12 mg/kg/h) were administered. Upon confirming loss of consciousness, the remimazolam dose was lowered to 1.0 mg/kg/h and subsequently adjusted to maintain a BIS of 40–60. Rocuronium was administered at 0.8 mg/kg, followed by intubation 2–3 min later. Post-intubation, the remifentanil dosage was decreased to 0.1 μg/kg/min and maintained. In addition, the dose of remifentanil was increased to 0.2–0.4 μg/kg/min after T2 and maintained until surgery. The body surface heating system was set to 38 °C in areas not covered by the surgical field. The heating device was not applied above the patient’s neck. The crystalloid solution administration speed was not changed from T1–T3.
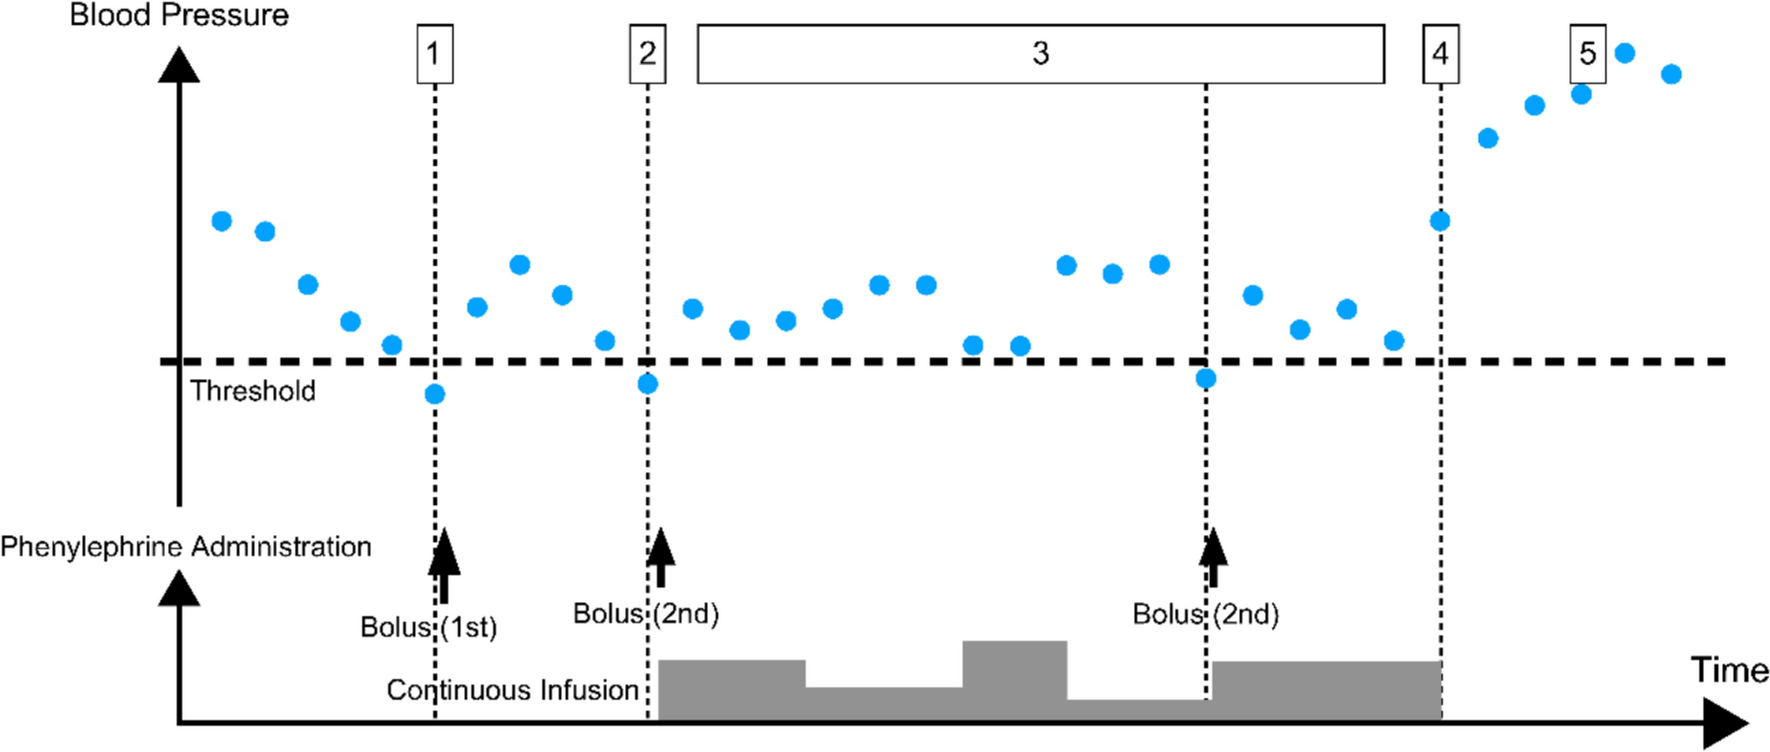
Systolic arterial pressure of < 80 mmHg was defined as hypotension. For hypotension, 0.1 mg of phenylephrine and 4 mg of ephedrine were administered when the pulse rate was ≥ 80 and ≤ 79 beats/min, respectively. These participants were excluded from the study.
Inspiratory oxygenation was set to 45%, the tidal volume for ventilation was 8 ml/kg [male body weight (kg): 50 + 0.91(height (cm) − 152.4); female body weight (kg): 45.5 + 0.91(height (cm) − 152.4)] [26], the end-expiratory positive-pressure ventilation was 5 cmH2O, and the respiratory rate was adjusted to an end-tidal carbon dioxide concentration of 35–40 mmHg. A Perseus A500 ventilator (Dräger, Lübeck, Germany) was used.
Using an indirect calorimeter, the metabolic rate was assessed 15 min after tracheal intubation and stabilization of the hemodynamic and respiratory state (T2), and again 1 h after T2 (T3).
The oxygen supply–demand balance was determined using the indirect calorimeter measurements of VO2 and VCO2. The indirect calorimeter measured VO2 and VCO2 based on the oxygen or carbon dioxide concentration and the breathing rate for inspiratory and expiratory air [27].
Cardiac output was measured with a FloTrac (Edwards Lifesciences, Irvine, CA, USA) and combined with the arterial blood gas measurements to calculate DO2 as follows [7]:
DO2 = [1.34 × Hb × SaO2 + (0.003 × PaO2)] × cardiac output × 10,
where Hb is hemoglobin (g/dl), SaO2 is arterial oxyhemoglobin saturation (%), and PaO2 is arterial oxygen tension (mmHg). The cardiac output measured by the FloTrac was calculated as the product of stroke volume and heart rate.
When the respiratory and circulatory dynamics were steady, measurements were collected once, and the 3 min mean of the measurements was used. The variables are displayed as median (interquartile range).
Outcomes
The primary endpoint was the changes in VO2 and VCO2 evaluated by indirect calorimetry before and after general anesthetic induction, as well as DO2 derived from cardiac output.
The secondary endpoints included various vital signs, such as blood pressure, heart rate, cardiac output, and BIS. We also studied indices of the oxygen supply–demand balance before and after general anesthetic induction, namely ERO2, R/Q, double product (heart rate × systemic blood pressure) [28], and VO2 using the LaFarge–Miettinen prediction equation (LMVO2) for men and women [men: LMVO2/body surface area (BSA) = 138.1 − (11.19 × log age) + (0.378 × heart rate), women: LMVO2/BSA = 138.1 − (17.04 × log age) + (0.378 × heart rate)] [29].
Patients were divided into two cohorts on the basis of VCO2 values at T2, which is a metabolic byproduct and indicator of respiratory function [30]. VCO2 per body surface area of 96.3 ml/min/m2 was defined as the boundary value, with patients exceeding this value comprising the high VCO2 group and those below this value comprising the low VCO2 group. This boundary value was determined from the resting VO2 value [31], the predicted decrease in VO2 under general anesthesia [23], and a respiratory quotient of 1. The cohort division aimed to elucidate differences in oxygen metabolic parameters, such as VO2 and VCO2, between wakefulness and after induction of anesthesia.
Sample size and statistical analyses.
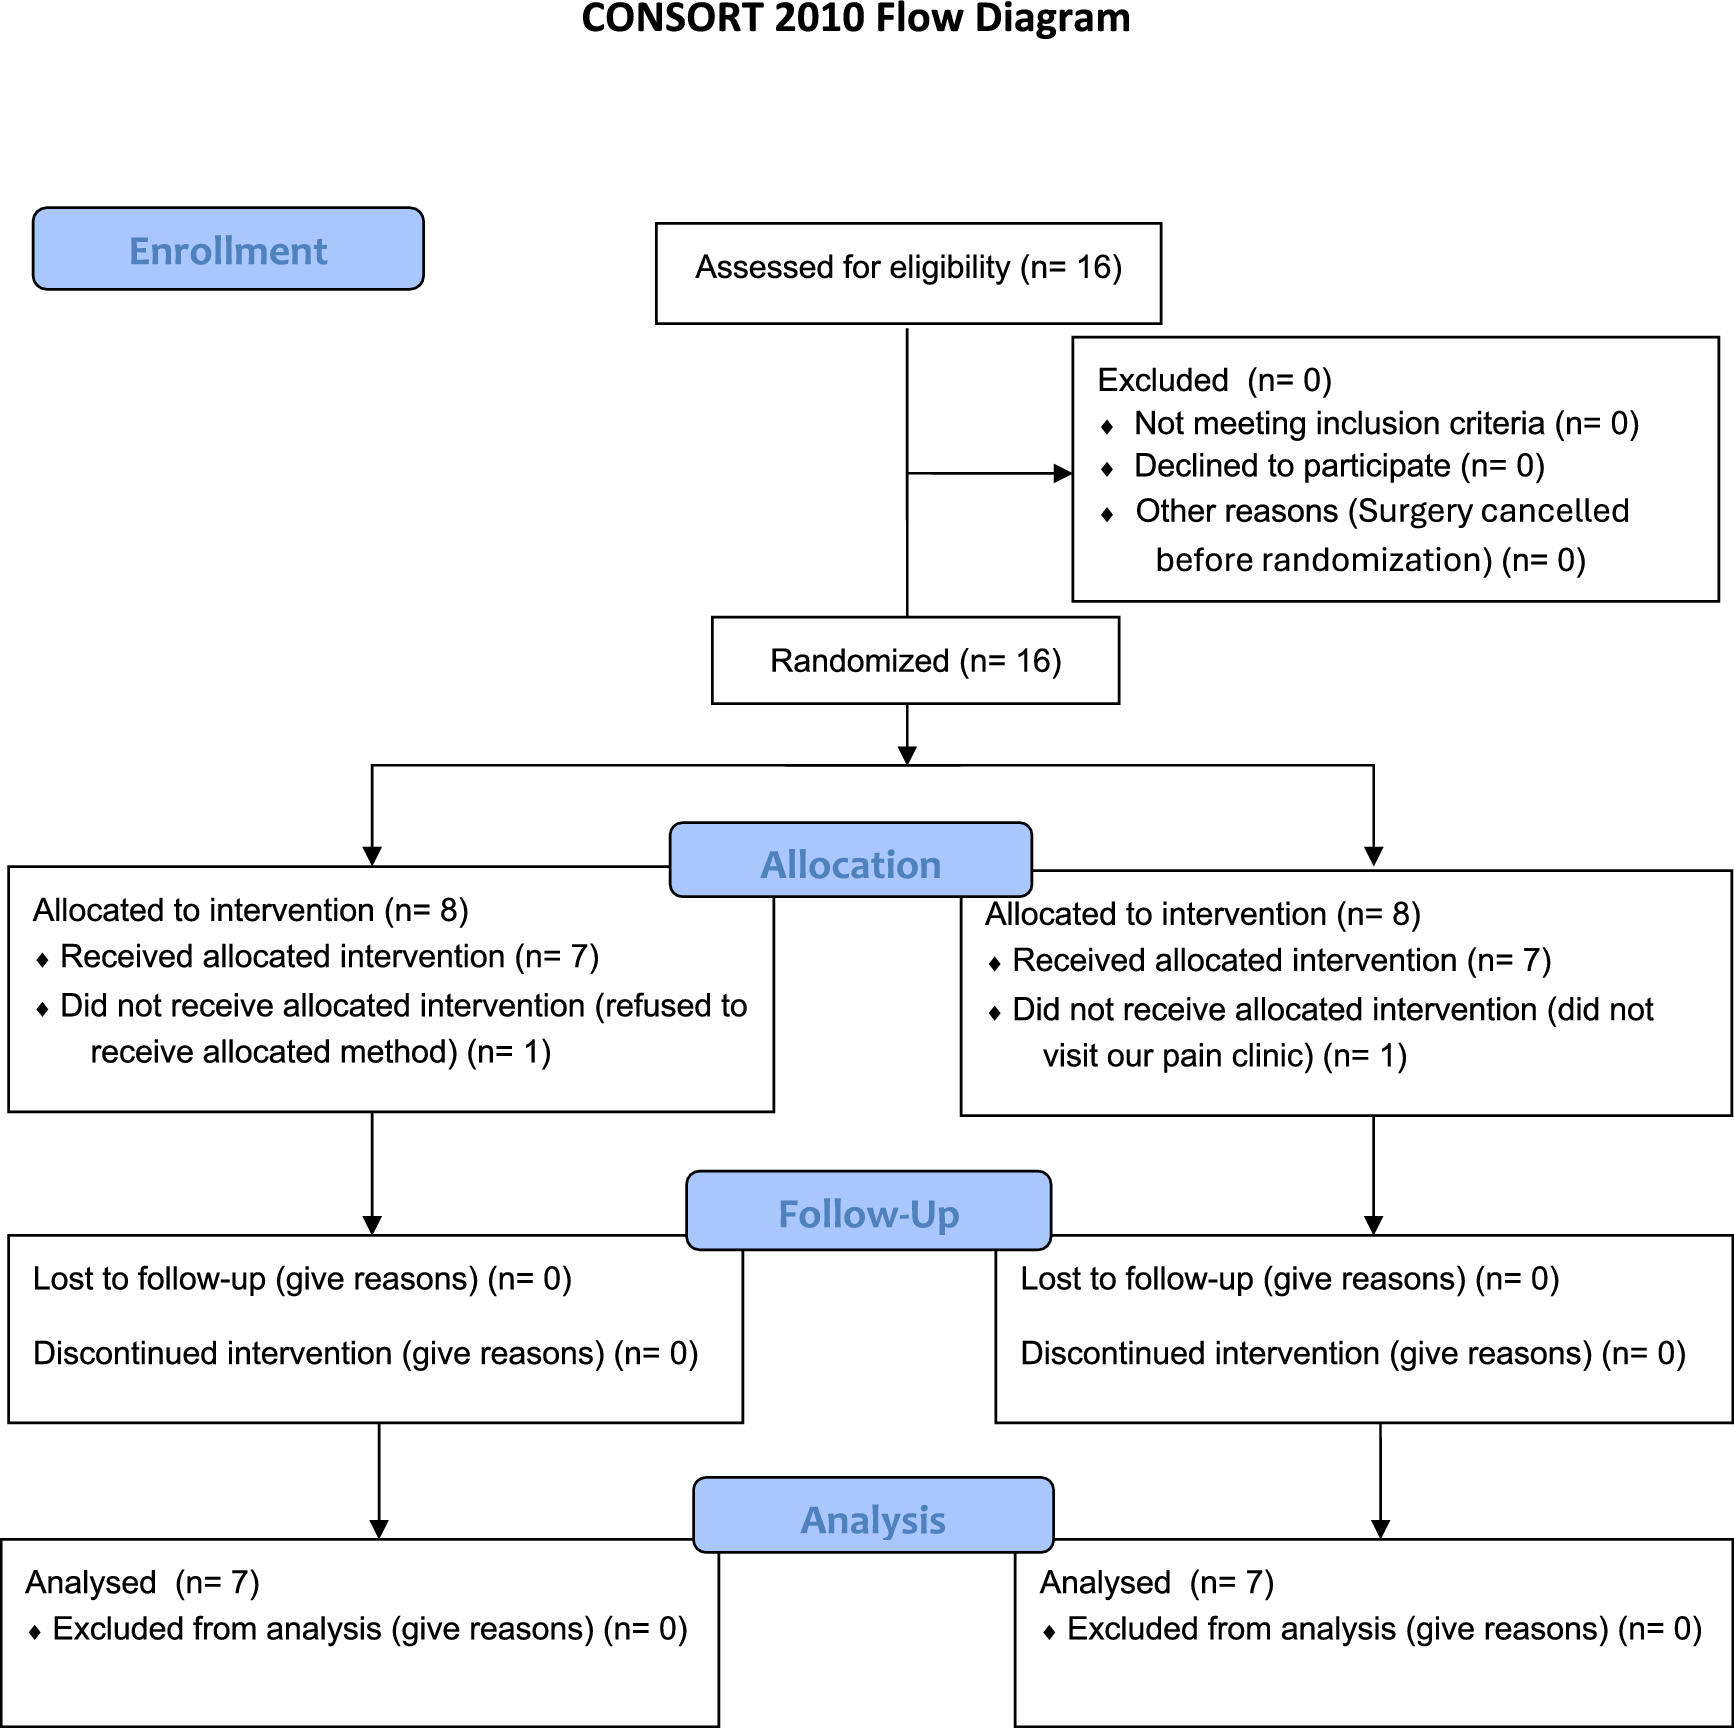
The sample size was determined based on the standardized mean difference of 1.31 and standardized difference of 25 as previously described [32]. A sample size of 11 was needed to detect a > 30% change in VO2 with a significance level of 0.05 (two-tailed) and a power of 0.80, as previously reported [23]. Because indirect calorimetry measurement involves skill, the target number of patients was set at 22, assuming that measurement errors would occur in approximately 50% of cases.
The Friedman test for comparing measurement data at three sites and the Wilcoxon rank-sum test for comparing two groups were used for statistical analyses. Two-tailed tests were conducted, and p < 0.05 was considered significant.
All statistical analyses were conducted using GraphPad Prism version 5.00 (GraphPad Software, San Diego, CA, USA).
On the consent form, the participants were informed that they would receive remimazolam for general anesthesia. The anesthesiologist in charge of each case also performed the measurements and analyzed the results. One anesthesiologist performed the measurements with the assistance of one anesthesia assistant.
The figures were created using GraphPad Prism version 5.00 (GraphPad Software Inc., San Diego, CA, USA) and Microsoft PowerPoint (Microsoft Corporation, Redmond, WA, USA).


Comments (0)