
Remember me
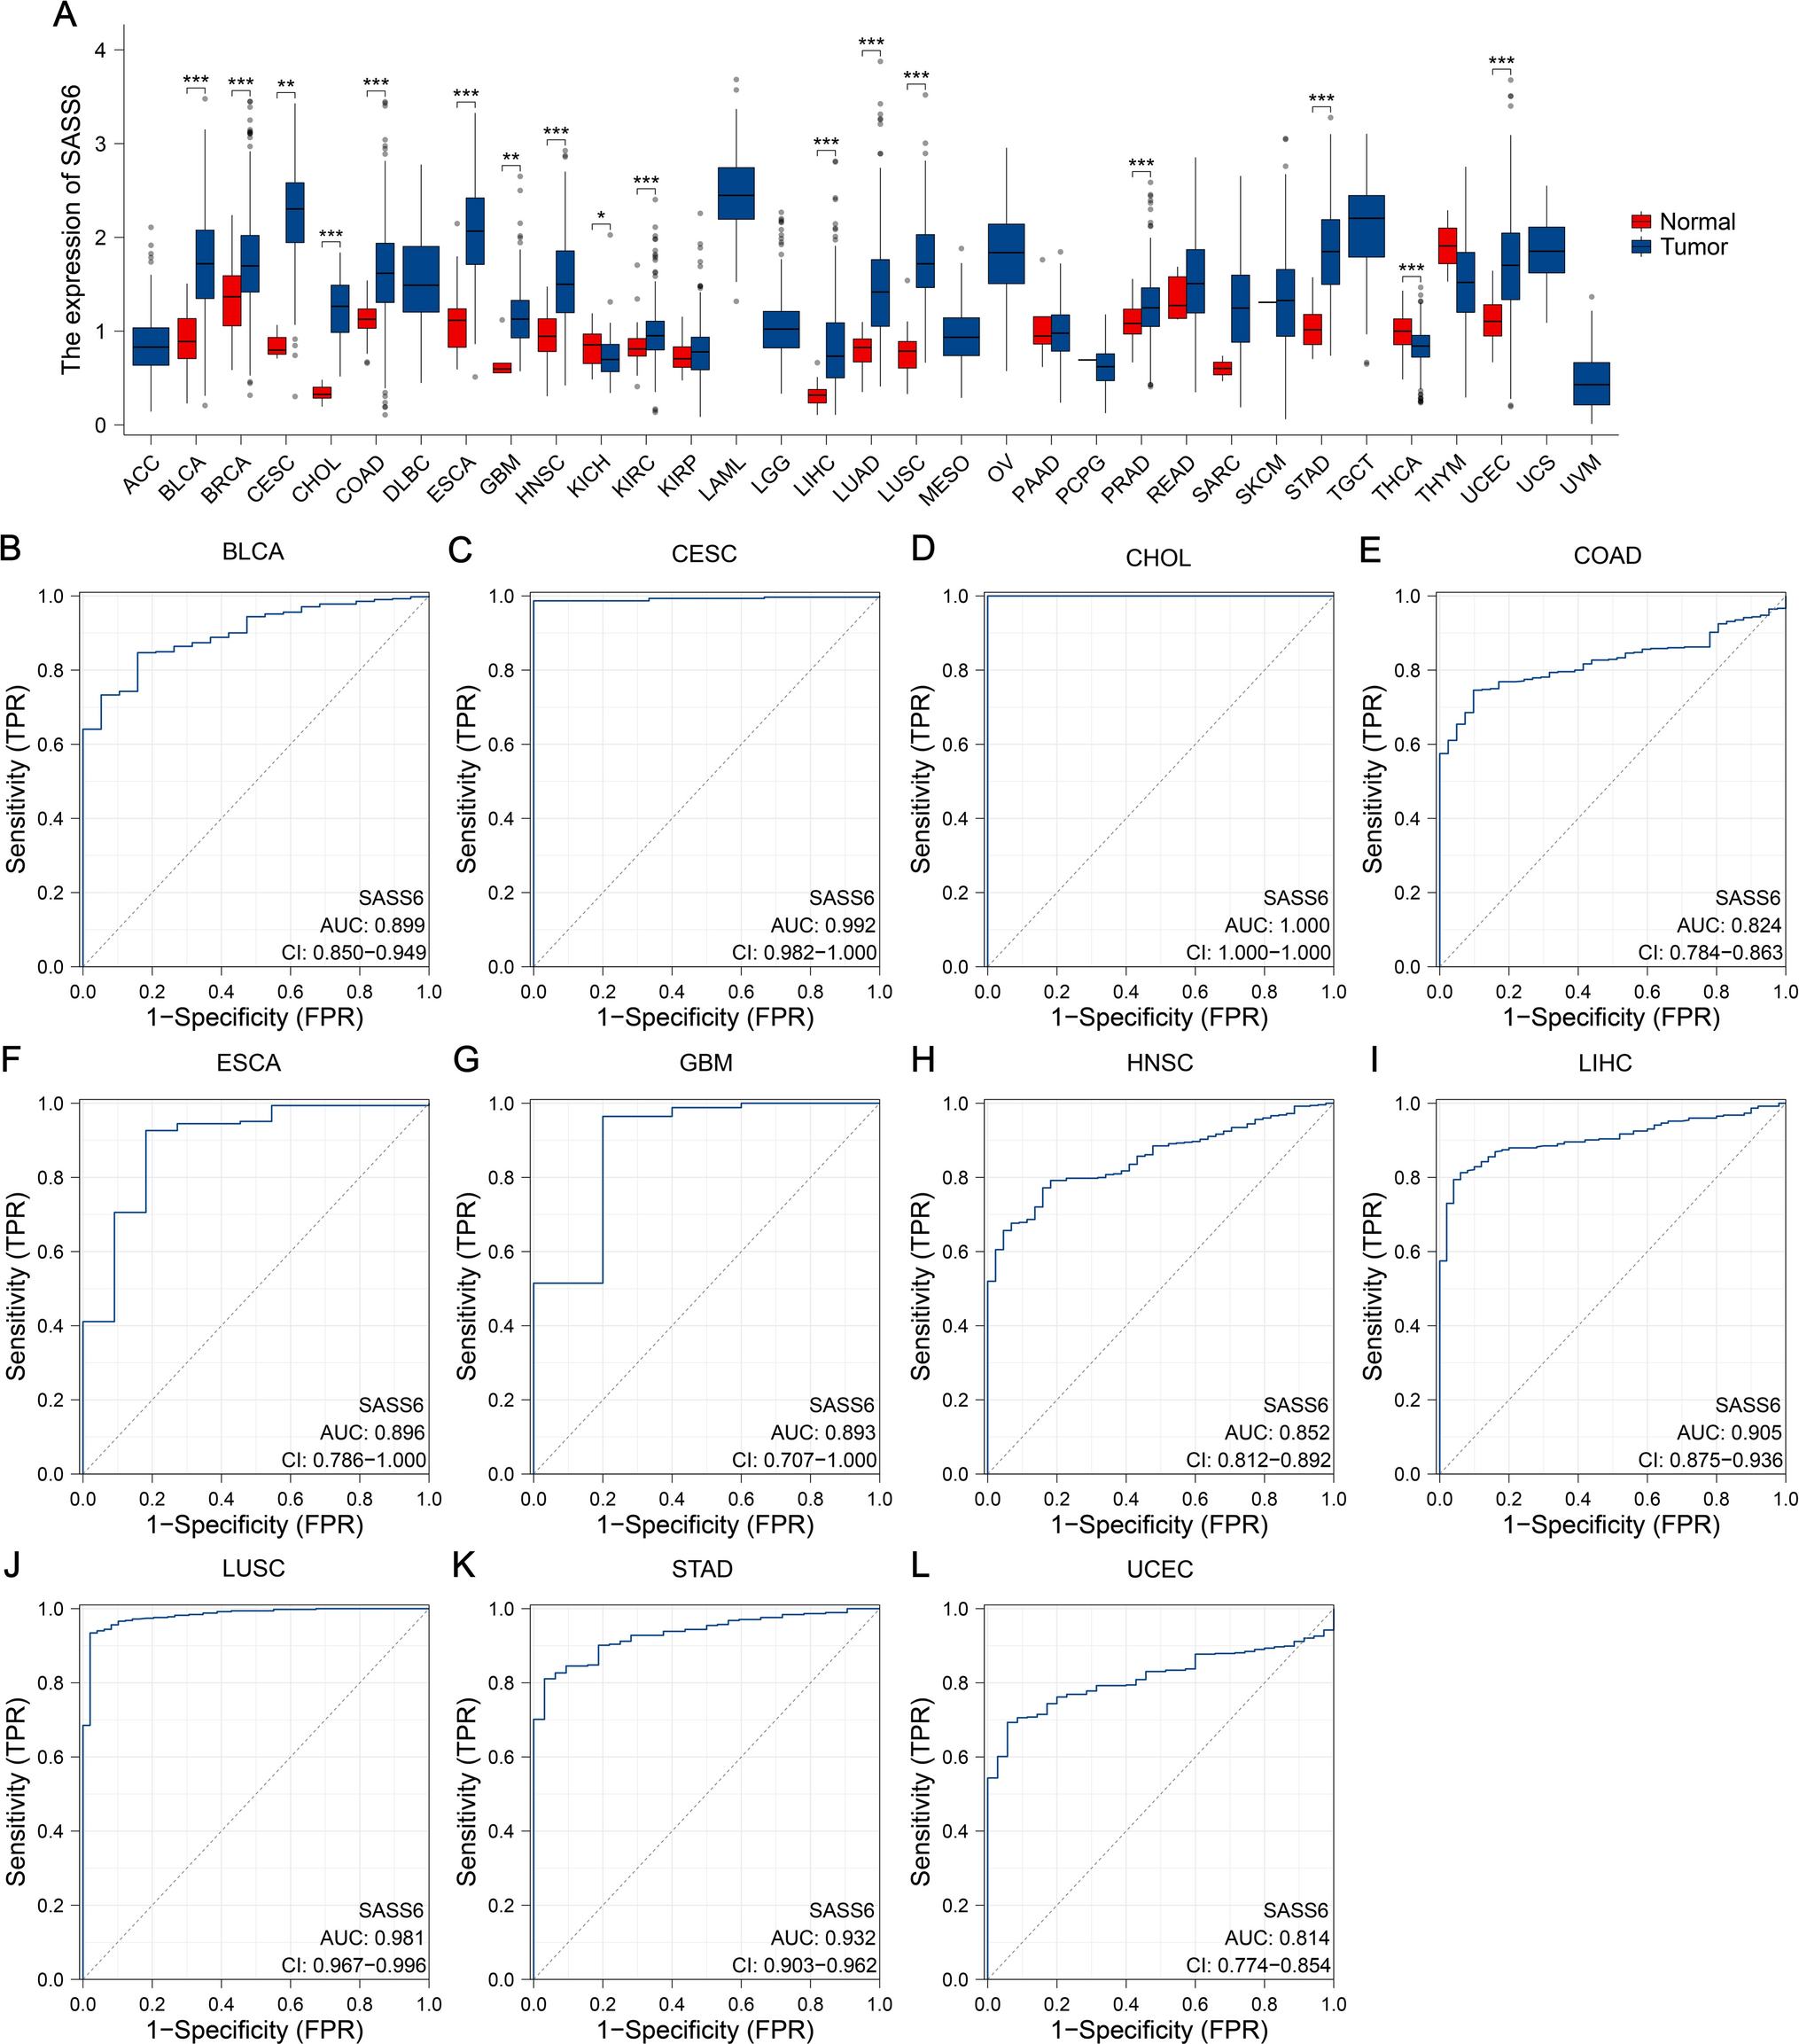


TCGA and GTEx database analyses of tumor tissues from 33 cancer types showed that Bud31 mRNA expression levels were tumor-specific and showed that the Bud31 mRNA levels were upregulated in the adrenocortical carcinoma (ACC), bladder urothelial carcinoma(BLCA), breast invasive carcinoma (BRCA), cervical squamous cell carcinoma and endocervical adenocarcinoma (CESC), cholangiocarcinoma (CHOL), colon adenocarcinoma (COAD), esophageal carcinoma (ESCA), glioblastoma multiforme (GBM), head-and-neck cancer (HNSC), kidney renal clear cell carcinoma (KIRC), acute myeloid leukemia (LAML), brain lower grade glioma (LGG), liver hepatocellular carcinoma (LIHC), lung adenocarcinoma (LUAD), lung squamous cell carcinoma (LUSC), ovarian serous cystadenocarcinoma (OV), pancreatic adenocarcinoma (PAAD), prostate adenocarcinoma (PRAD), skin cutaneous melanoma (SKCM), stomach adenocarcinoma (STAD), testicular germ cell tumors (TGCT), thyroid carcinoma (THCA), and uterine carcinosarcoma (UCS) tumor tissues compared to the corresponding normal tissues, while decreased in testicular germ cell tumors (TGCTs) (Fig. 1A). In addition, the expression results of Bud31 in the KIRC datasets GSE36895, GSE53757, and GSE66272 were the same as those in the TCGA dataset (Fig. 1B). IHC staining in the HPA database further confirmed the upregulation of Bud31 at the protein level in KIRC (Fig. 1C). Kaplan–Meier curves indicated that patients expressing higher levels of Bud31 exhibited a shorter OS relative to patients expressing lower levels of this gene. (Fig. 1D, E). Together, these data indicate that the consistent pattern of higher Bud31 expression in tumor samples across most cancer types could imply that Bud31 plays an important role in tumorigenesis or tumor maintenance. It may also suggest that Bud31 has the potential to be a biomarker for the presence of cancer or possibly a target for therapeutic intervention.
Figure 1
Differential expression and prognostic value of Bud31 in various malignancies. A Expression profile of Bud31 across multiple cancer types, depicted as box plots. Data are segregated into normal (blue) and tumor (red) groups for each study identifier. B Violin plots illustrating the distribution of Bud31 expression in normal versus tumor samples from three independent datasets, with p-values indicating statistical significance. C Comparative immunohistochemical analysis of Bud31 protein levels in normal (left) and neoplastic (right) tissue sections. D Heatmap correlation matrix of Bud31 expression levels across different cancer subtypes, with intensity gradients representing expression magnitude. E Kaplan–Meier survival plots evaluating the correlation between Bud31 expression and overall survival in six distinct cancer cohorts, stratified by high (red) and low (blue) expression levels, accompanied by p-values and hazard ratios. * P < 0.05, **P < 0.01, ***P < 0.001
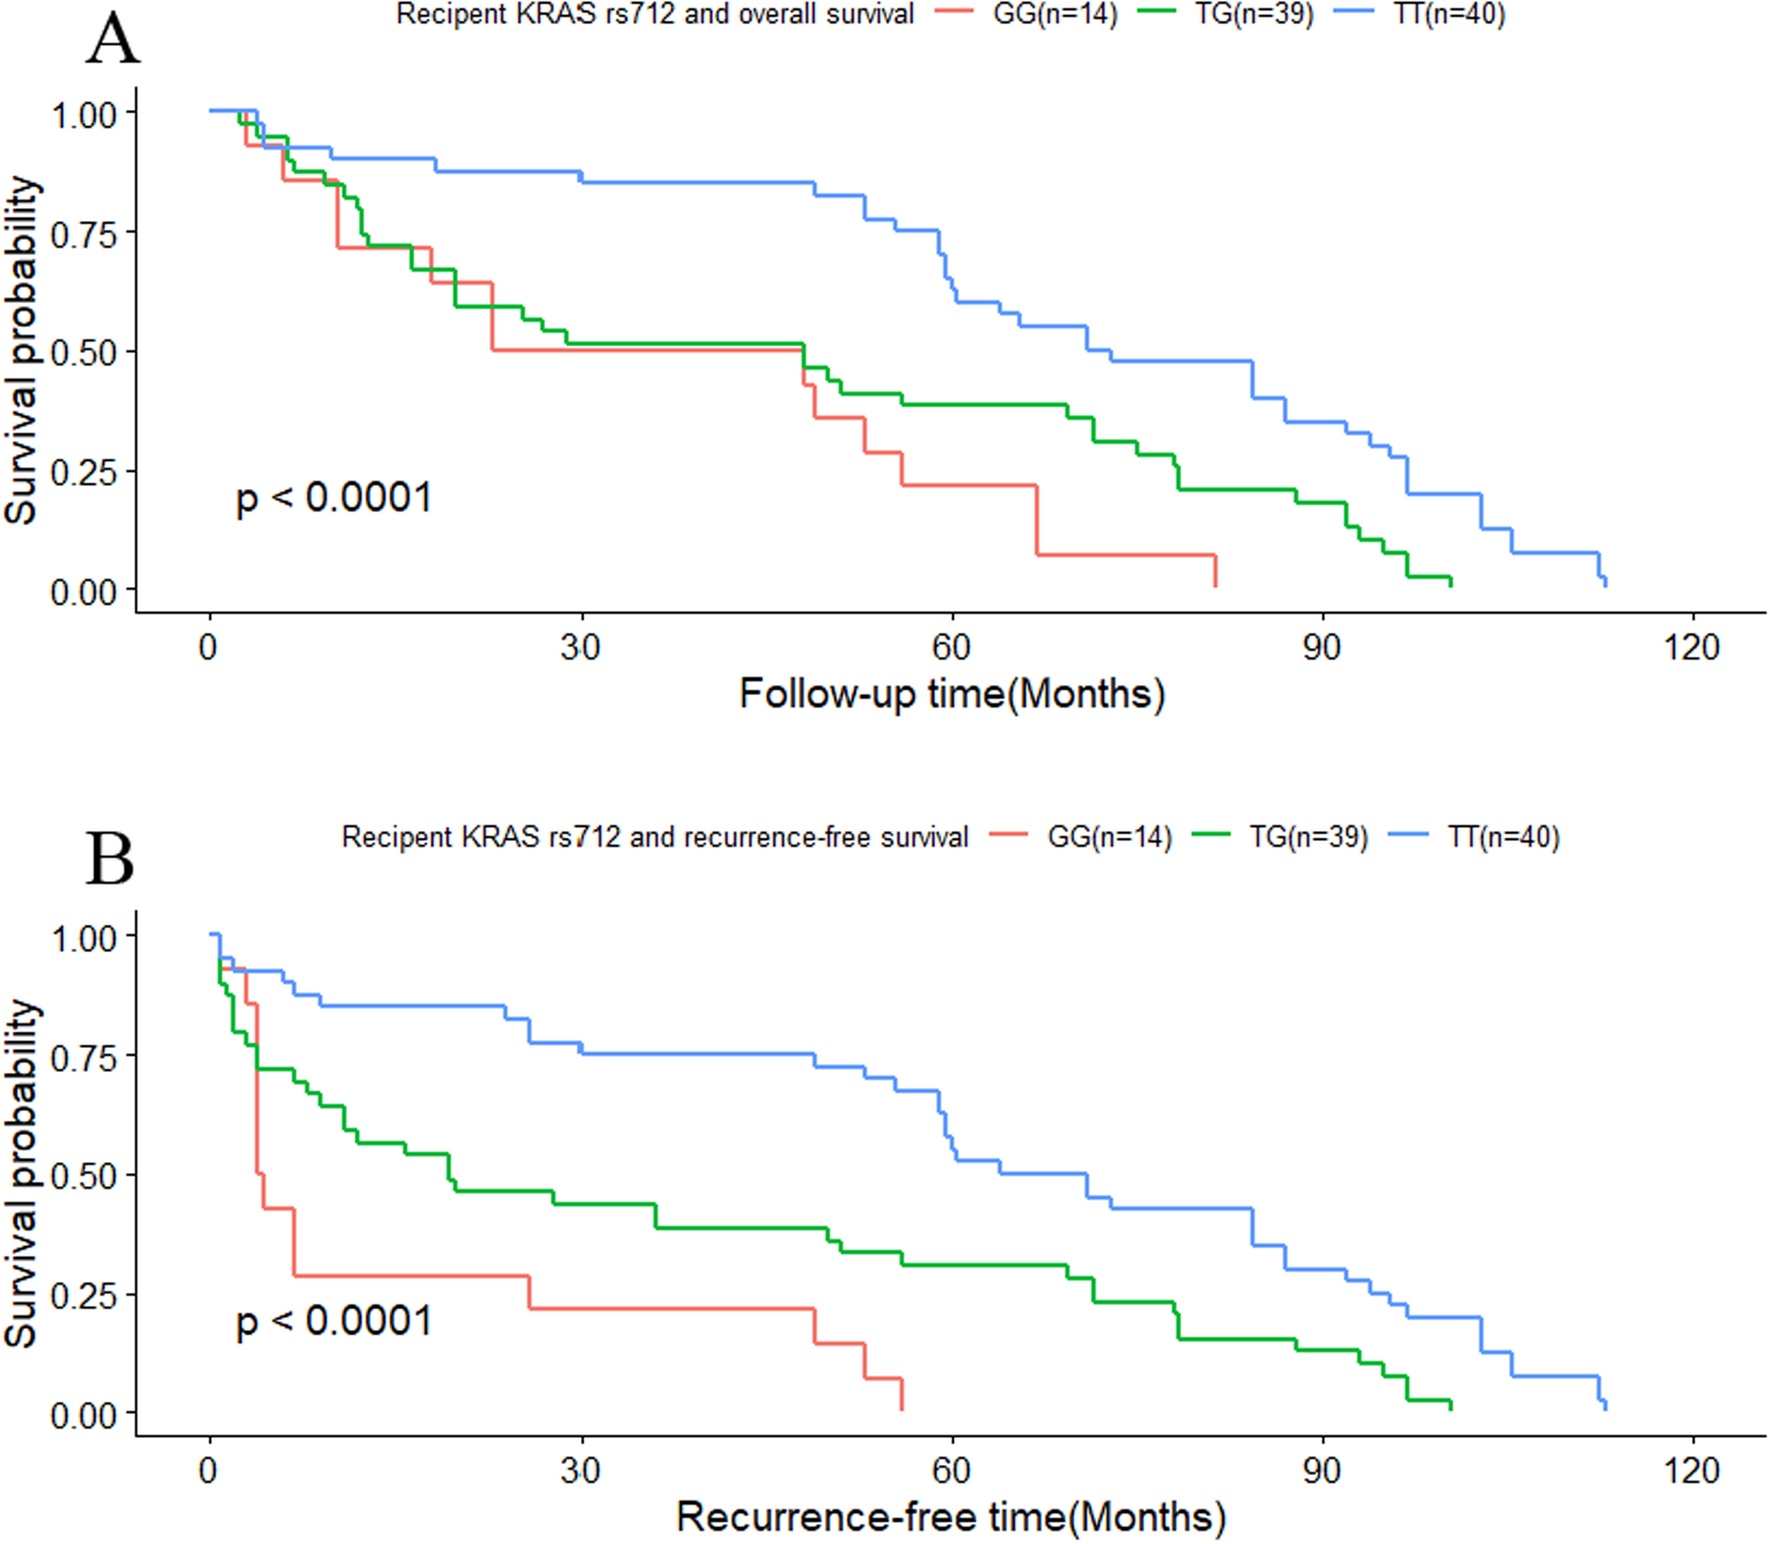
Bud31 expression correlates with prognostic outcomes in diverse tumors, including clear cell renal cell carcinoma (ccRCC)The relationship between BUD31 expression and clinical outcomes, including overall survival (OS), disease-specific survival (DSS), and progression-free survival (PFS), was evaluated across various cancer types. High BUD31 expression was found to be associated with worse OS in several cancers, including UVM, MESO, LIHC, KIRC, KICH, GBMLGG, and ACC, as indicated by the hazard ratios (HR) in Fig. 2A. For example, the HR for UVM was 2.91 (p = 0.030), for MESO was 7.41 (p = 0.030), and for KIRC was 1.90 (p < 0.001). Kaplan–Meier survival curves in Fig. 2B show that patients with high BUD31 expression had significantly lower OS compared to those with low BUD31 expression in ccRCC (p =0.00018). Similarly, high BUD31 expression correlated with worse DSS in cancers such as MESO, LGG, KIRC, KICH, GBMLGG, COADREAD, and ACC, as shown in Fig. 2C. For instance, the HR for LGG was 3.41 (p < 0.0001), for KIRC was 2.31 (p =0.000002), and for KICH was 33.16 (p = 0.0027). Kaplan–Meier curves in Fig. 2D confirm that high BUD31 expression is significantly associated with reduced DSS in ccRCC (p < 0.0001). For PFS, high BUD31 expression predicted poorer outcomes in cancers including MESO, LGG, KIRC, COADREAD, KICH, GBMLGG, and ACC, as depicted in Figure E. For example, the HR for MESO was 2.70 (p = 0.0012), for LGG was 2.35 (p = 0.0000036), and for KIRC was 2.09 (p = 0.0000015). Kaplan–Meier survival curves in Figure F demonstrate that high BUD31 expression is significantly linked to poorer PFS in ccRCC (p < 0.0001). Overall, these results highlight that high BUD31 expression is consistently associated with worse clinical outcomes across multiple cancer types, including ccRCC, suggesting its potential as a prognostic marker for poor survival in cancer patients.
Figure 2
Analysis of Bud31's influence on cancer survival. A Forest plot showing hazard ratios for overall survival across different cancers. B Kaplan–Meier curve for overall survival in KIRC, comparing high and low Bud31 levels. The ROC curve shows the Bud31's accuracy in predicting survival. C Forest plot for disease-specific survival, with hazard ratios indicating risk across various cancers. D Kaplan–Meier curve for disease-specific survival in KIRC, with the ROC curve showing predictive accuracy based on Bud31 levels. E Forest plot for progression-free survival, with hazard ratios for different cancers. F Kaplan–Meier curve for progression-free survival in KIRC, with the ROC curve indicating the Bud31's predictive accuracy
The correlation between Bud31 expression and clinicopathological parameters in tumor patients includes kidney renal clear cell carcinoma (KIRC).The relationship between BUD31 gene expression and clinicopathological characteristics of clear cell renal cell carcinoma (ccRCC) patients was analyzed. Higher BUD31 expression is significantly associated with advanced tumor stages (T3-4 vs. T1-2, p = 0.00056), lymph node metastasis (N1-4 vs. N0, p = 0.02), distant metastasis (M1 vs. M0, p = 2.1e-07), advanced clinical stages (Stage III-IV vs. Stage I-II, p = 8.5e-07), and higher tumor grades (G3-4 vs. G1-2, p = 0.0093), as shown in Fig. 3A. The Sankey diagram in Fig. 3B further illustrates the distribution of BUD31 expression across various stages and grades, emphasizing its higher expression in more advanced and aggressive ccRCC subtypes. Multivariate Cox regression analyses for overall survival (OS), disease-specific survival (DSS), and progression-free interval (PFI) (Figures C, D, and E) identify high BUD31 expression as a significant independent predictor of worse OS (HR = 1.81, p = 4.90E-03), DSS (HR = 2.90, p = 8.09E-05), and PFI (HR = 1.77, p = 0.02). Other significant predictors include age and metastasis status. A nomogram (Fig. 3F) constructed to predict 1-, 3-, and 5-year OS probabilities based on BUD31 expression, age, and metastasis status shows good predictive performance. The calibration plot (Fig. 3G) demonstrates good agreement between nomogram-predicted and observed OS probabilities. Time-dependent ROC curves (Fig. 3H) for predicting OS at 1, 3, and 5 years yield AUC values of 0.70, 0.75, and 0.72, respectively, indicating that BUD31 expression has good predictive accuracy for OS in ccRCC patients. Overall, these findings indicate that high BUD31 expression is significantly associated with advanced disease and poor prognosis in ccRCC patients, underscoring its potential as a prognostic biomarker.
Figure 3
BUB31's prognostic significance in KIRC. A Bud31 expression is plotted against tumor characteristics, showing variations in early versus advanced stages, node involvement, metastasis, and grade. B The Sankey diagram traces Bud31 levels across stages and grades in KIRC. C A forest plot reveals how Bud31 and other clinical factors are related to overall survival in KIRC patients. D Another forest plot assesses the impact of BUB31 on disease-specific survival. E A forest plot examines Bud31's association with the time KIRC patients remain disease-free after treatment. F A nomogram scores patient characteristics to predict overall survival. G A calibration curve compares the nomogram's survival predictions to actual outcomes. H ROC curves display the nomogram's effectiveness in predicting survival over time
Implications of Bud31 expression on mutation landscape and genomic instability in ccRCCThe impact of BUD31 expression on the mutation landscape and genomic instability in clear cell renal cell carcinoma (ccRCC) was analyzed. As shown in Fig. 4A, the mutation profile of ccRCC samples stratified by high and low BUD31 expression reveals that high BUD31 expression is associated with a higher overall mutation count compared to low BUD31 expression. The most frequently mutated genes include VHL, PBRM1, TTN, SETD2, and MTOR, among others, with various types of mutations such as missense, frame shift, and non-sense mutations observed. Figure 4B presents violin plots comparing various genomic instability metrics between high and low BUD31 expression groups. Tumor mutation burden (TMB) is significantly higher in the high BUD31 expression group (p = 0.024). Similarly, microsatellite instability (MSI) is higher in the high BUD31 expression group (p = 0.00051). Metrics such as loss of heterozygosity (LOH) and homologous recombination deficiency (HRD) are also elevated in the high BUD31 expression group, with p-values of 0.0082 and 0.019, respectively. Additionally, ploidy is higher in the high BUD31 expression group (p = 0.0043). However, no significant difference in tumor purity is observed between the groups (p = 0.23). These results indicate that high BUD31 expression in ccRCC is associated with increased genomic instability, as evidenced by higher TMB, MSI, LOH, HRD, and ploidy. This suggests that BUD31 may play a role in promoting genetic alterations and instability in ccRCC, potentially contributing to tumor progression and aggressiveness.
Figure 4
The impact of BUD31 expression on the mutation landscape and genomic instability in KIRC. A The waterfall plot delineates the correlation between Bud31 expression levels and prevalent oncogenic mutations in KIRC. B The association between Bud31 expression levels and tumor genomic heterogeneity in KIRC
The relationship between BUD31 expression and the tumor immune microenvironment in KIRCOur study focused on the role of BUD31 in clear cell renal cell carcinoma (ccRCC) and revealed significant correlations between BUD31 expression and various immune-related metrics. BUD31 expression exhibited a significant negative correlation with the ESTIMATE score (p = 5.8e-3, r = − 0.12), immune score (p = 0.05, r = − 0.08), and stromal score (p = 1.5e-3, r = − 0.14), indicating that higher BUD31 expression is associated with lower overall immune, stromal, and composite scores in ccRCC (Fig. 5A). Further analysis using the CIBERSORT algorithm (Fig. 5B) showed that BUD31 expression negatively correlated with regulatory T cells, follicular helper T cells, and activated NK cells, while a slight positive correlation was observed with macrophages. The TIMER algorithm (Fig. 5C) revealed significant differences in dendritic cells (DCs), macrophages, and CD4 + T cells between high and low BUD31 expression groups, but not in B cells and CD8 + T cells. A heatmap of the correlation matrix between BUD31 and various immune checkpoint and regulatory genes indicated notable negative correlations with genes such as PDCD1, LAG3, and TGFB1, suggesting BUD31's role in modulating immune checkpoint pathways (Fig. 5D). Additionally, a circular heatmap showed that most immunoinhibitory and MHC genes exhibited a negative correlation with BUD31, while chemokines and some receptors showed positive correlations (Fig. 5E). In summary, the data suggest that in ccRCC, BUD31 expression is inversely correlated with immune, stromal, and ESTIMATE scores, implicating its role in immune suppression within the tumor microenvironment. The correlation with specific immune cell types and key immune checkpoint genes highlights BUD31's potential influence on immune evasion mechanisms in ccRCC, suggesting its relevance as a target for therapeutic interventions in cancer immunotherapy.
Figure 5
The relationship between BUD31 expression and the tumor immune microenvironment in KIRC. A The relationship between Bud31 expression levels and tumor immune infiltration in KIRC. B The dot plot illustrates the correlation between BUD31 expression and different immune cell types using CIBERSORT. C Violin plots display the distribution of immune cell types between high and low BUD31 expression groups using TIMER. D The correlation matrix of BUD31 and various immune checkpoint and regulatory genes. E The correlation between BUD31 expression and the expression of various immune-related genes
BUD31 promotes proliferation, migration, and invasion of ccrcc cells both in vitro and in vivo.Next, we analyzed Bud31 expression levels in various ccRCC cell lines by qRT-PCR. Bud31 mRNA levels were significantly higher in the 786O and OS-RC-2 cell lines compared to the other ccRCC cell lines (Fig. 6A). The immunofluorescence colocalization assays reveal a predominant nuclear localization of the Bud31 protein within the cells (Fig. 6B). We then used specific Bud31-targeting shRNAs to knockdown the expression levels of Bud31 in the 786O and OS-RC-2 cells (Fig. 6C, D). Histograms derived from flow cytometry cell cycle analysis indicate that the downregulation of sh-Bud31 may exert an influence on the progression of the cell cycle (Fig. 6E). CCK-8 assay, flat plate colony formation, wound healing assay, and transwell assay results showed that Bud31 knockdown suppressed the cell proliferation, migration, and invasion of 786O and OS-RC-2 (Fig. 6F–J).
Figure 6
Consequences of Bud31 downregulation in renal carcinoma cell lines. A Bar chart indicating Bud31 transcript levels, with marked expression in renal carcinoma cells. B Immunofluorescence depicting nuclear localization of Bud31 (red), counterstained with DAPI (blue). C Graph showing significant diminution in Bud31 mRNA post-targeted shRNA interference. D Western blot confirming downregulation of Bud31 protein following shRNA application. E Flow cytometric analysis reflecting cell cycle disruption subsequent to Bud31 reduction. F CCK-8 assay illustrating suppressed proliferation in Bud31-deficient cells. G Clonogenic assay outcomes demonstrating reduced colony formation capability upon Bud31 knockdown. H–I Wound healing assays evidencing decreased cellular motility following Bud31 attenuation. J Transwell migration assays substantiate the inhibitory effect on cell motility post-Bud31 knockdown
The effect of BUD31 knockdown on tumor growth was assessed in vivo using a xenograft model. Representative images of tumors excised from mice (Fig. 7A) show that tumors from the shBUD31 group were visibly smaller than those from the control group. Quantitative analysis of tumor weight (Fig. 7B) revealed a significant reduction in the weight of tumors from the shBUD31 group compared to the control group (p < 0.01). Tumor volume measurements over time (Fig. 7C) further demonstrated that tumors in the shBUD31 group grew significantly slower than those in the control group. Immunohistochemical staining for Ki67, a marker of cell proliferation (Fig. 7D), showed markedly reduced staining intensity in tumors from the shBUD31 group compared to the control group, indicating decreased proliferation in BUD31 knockdown tumors. Overall, these results indicate that BUD31 knockdown significantly inhibits tumor growth and proliferation in vivo, suggesting that BUD31 plays a critical role in the progression of renal clear cell carcinoma.
Figure 7
The effect of BUD31 knockdown on tumor growth was assessed in vivo using a xenograft model. A representative images of tumors excised from mice injected with control and shBUD31-transfected cells. B Plot of tumor weights indicating significantly lighter tumors in the sh-Bud31 group than in controls (**P < 0.01). C Graph of tumor volumes over 35 days, with a clear trend of reduced growth in the sh-Bud31 group. D Ki67 staining of tumor sections reveals less cell proliferation in the sh-Bud31 group compared to the control group
BUD31 promotes cell cycle progression by regulating alternative splicing.As an important splicing factor, BUD31 plays a crucial role in the alternative splicing of cells. Using RNA sequencing (RNAseq) on renal clear cell carcinoma cells with knockdown of the BUD31 gene. Further analysis of alternative splicing using rMATS software identified a total of 390 differential alternative splicing events (Fig. 8A). Among these, there were 287 skipped exons (SE), 40 retained introns (RI), 42 alternative 3' splice sites (A3SS), 12 mutually exclusive exons (MXE), and nine alternative 5' splice sites (A5SS). Using KEGG enrichment analysis of differentially spliced genes, it was found that the main enrichment pathways are regulation of microtubule-based process, organic acid catabolic process, and regulation of cell cycle process. Among them, 17 genes related to the cell cycle were identified, such as ECD, SMARCA2, RACGAP1, MUS81, PBRM1, and CCNL1 (Fig. 8B–F).
Figure 8
The extensive impact of BUD31 knockdown on alternative splicing in renal clear cell carcinoma cells. A The distribution of differentially spliced events identified by rMATS analysis in renal clear cell carcinoma cells with BUD31 knockdown. B The results of KEGG enrichment analysis for differentially spliced genes. C–F RNA sequencing read coverage across specific genomic regions, comparing BUD31 knockdown samples
Bud31 promotes the proliferation of ccRCC cells by influencing the cell cycle pathway.Knockdown of BUD31 resulted in significant changes in gene expression. As shown in Fig. 9A, the volcano plot highlights the genes with significant differential expression, with BUD31 prominently downregulated. Figure 9B presents a heatmap of differentially expressed genes, revealing distinct expression patterns between BUD31 knockdown (Bud31_sh1) and wild-type (WT) samples. Key genes such as ALOX5, DTNB, ADGRB3, and PTPRB exhibited notable changes in expression. Further KEGG enrichment analysis (Fig. 9C) identified significant pathways associated with the differentially expressed genes, including regulation of nervous system development (GO:0051960), ossification (GO:0001503), regulation of neuron projection development (GO:0010975), myelination (GO:0031641), and extracellular matrix organization (GO:0030198). Notably, the positive regulation of phosphatidylinositol 3-kinase/protein kinase B signal transduction (GO:0014068) was also significantly enriched. Gene set enrichment analysis (GSEA) (Fig. 9D, E) highlighted the enrichment of gene sets related to cell cycle regulation, such as "HALLMARK_G2M_CHECKPOINT" and "KEGG_SPLICEOSOME." Additional GSEA results indicated significant enrichment scores for pathways involved in cell cycle checkpoints, mitotic spindle assembly, and chromosome segregation, including gene sets like GOBP_CELL_CYCLE_CHECKPOINT_SIGNALING, GOBP_MITOTIC_SPINDLE_ASSEMBLY, and GOBP_MITOTIC_SISTER_CHROMATID_SEGREGATION. Western blot analysis (Fig. 9F) demonstrated that BUD31 knockdown led to decreased levels of cell cycle-related proteins CDK2, CDK4, CDK6, and CCND1, and increased levels of the cell cycle inhibitors P21 and P27 in both 786O and OS-RC-2 cells (p < 0.001). These findings collectively underscore the critical role of BUD31 in regulating gene expression and alternative splicing, with significant implications for cell cycle regulation and other essential cellular processes.
Figure 9
The comprehensive analysis reveals that BUD31 knockdown significantly impacts gene expression. A The volcano plot of gene expression changes upon BUD31 knockdown compared to control (WT) samples. B The heatmap of differentially expressed genes between BUD31 knockdown and WT samples. C A bar chart of the KEGG enrichment analysis, identifying significant pathways associated with differentially expressed genes. D–E The results of gene set enrichment analysis (GSEA). F The expression of cell cycle-related proteins through Western blot analysis
BUD31 regulates the cell cycle pathway by affecting PIK3AP1 expression.Through differential gene enrichment analysis of BUD31, we identified its enrichment in the PI3K activation pathway. Further differential gene analysis indicated that PIK3AP1 primarily functions within this pathway. Consequently, we hypothesize that BUD31 regulates cell cycle progression by modulating PIK3AP1 expression and subsequently activating the PI3K pathway. As shown in Fig. 10A, PIK3AP1 expression is significantly higher in kidney renal clear cell carcinoma (KIRC) tissues compared to normal tissues. Cell proliferation assays (Fig. 10B) demonstrate that PIK3AP1 knockdown significantly reduces cell proliferation compared to control cells over a 5-day period (p < 0.001). Colony formation assays (Fig. 10C) reveal that PIK3AP1 knockdown markedly decreases the number of colonies formed by 786O and OS-RC-2 cells (p < 0.01). EdU incorporation assays (Fig. 10D) show a substantial reduction in DNA synthesis in PIK3AP1 knockdown cells, with significantly fewer EdU-positive cells in both 786O and OS-RC-2 cell lines compared to controls (p < 0.01). Migration assays (Fig. 10E) demonstrate that PIK3AP1 knockdown significantly impairs the migratory ability of both cell lines (p < 0.01). Invasion assays (Fig. 10F) highlight a significant reduction in the invasive capacity of PIK3AP1 knockdown cells compared to control cells in both 786O and OS-RC-2 lines (p < 0.001). Overall, these results indicate that PIK3AP1 knockdown inhibits cell proliferation, colony formation, migration, and invasion in renal clear cell carcinoma cells.
Figure 10
The impact of PIK3AP1 knockdown on renal clear cell carcinoma cells. A PIK3AP1 expression in kidney renal clear cell carcinoma (KIRC) tissues compared to normal tissues. B The results of CCK-8 assays. C Colony formation assays, where PIK3AP1 knockdown markedly decreased the number of colonies formed by 786O and OS-RC-2 cells (p < 0.01). D EdU incorporation assays, indicating a substantial reduction in DNA synthesis in PIK3AP1 knockdown cells. E migration assays, demonstrating that PIK3AP1 knockdown significantly impairs the migratory ability of both cell lines (p < 0.01). F invasion assays, highlighting a significant reduction in the invasive capacity of PIK3AP1 knockdown cells (p < 0.001)
Comments (0)