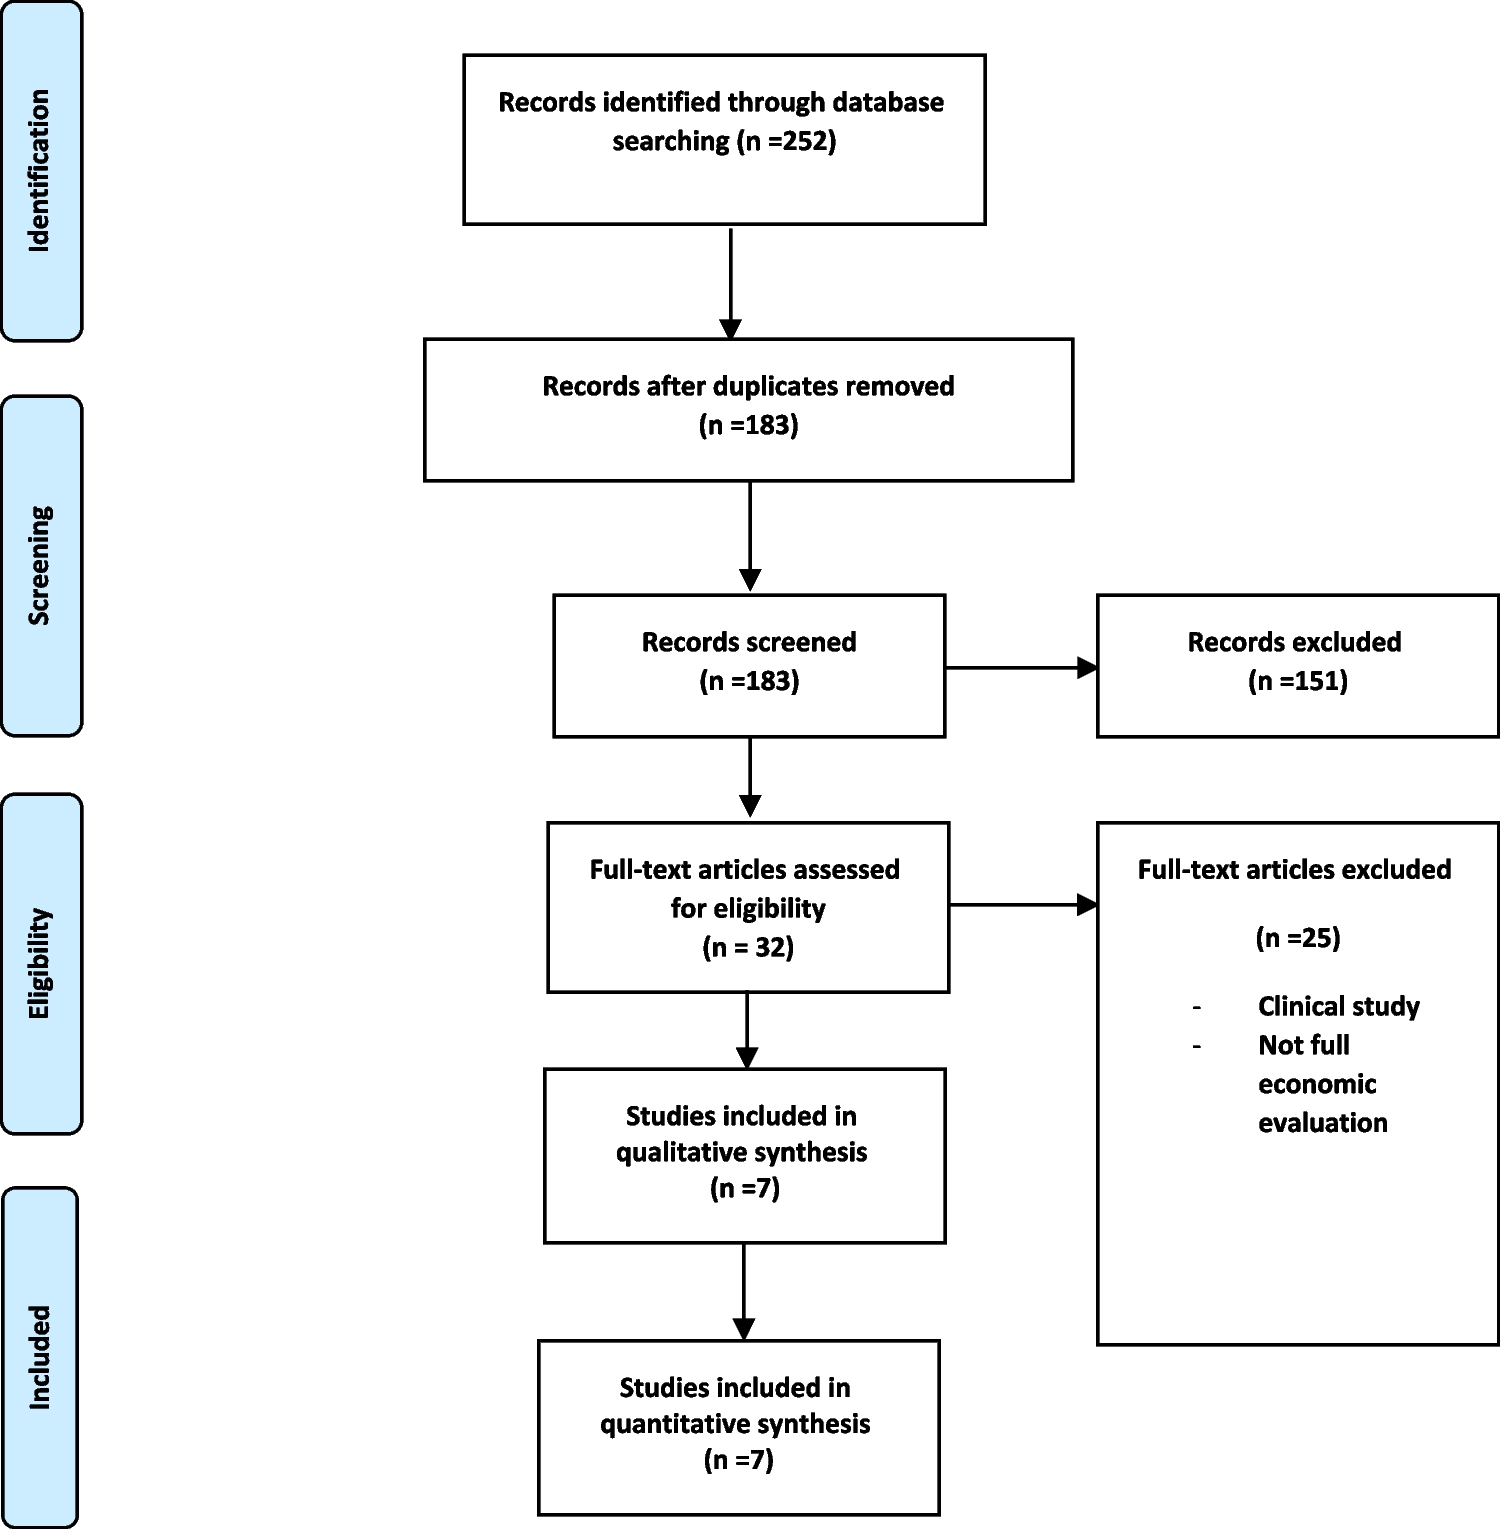
Data source
The UK Biobank comprises 502,507 volunteer participants aged 37–73 from England, Scotland, and Wales who were recruited between 2006 and 2010. Details of the design and survey methods for UK Biobank have been described in previous studies [10, 11]. At baseline assessment visit and repeat assessment visits, participants completed a touchscreen questionnaire and a verbal interview, which collected information on sociodemographic characteristics, lifestyle, medical history, medication history, and reproductive factors. Repeat assessment visits were conducted every 2–3 years during the follow-up period, at which participants underwent a repetition of the baseline assessment visit. Thus, repeat assessment visits could enrich, confirm, and calibrate the data collected at baseline assessment visit. Moreover, touchscreen questionnaire validation was performed in two ways. First, some questions (especially medical questions) in the touchscreen questionnaire would be asked again and confirmed in the subsequent verbal interview. Second, the touchscreen questionnaire incorporated a number of logic checks on the data that were entered, such as checking for contradictory answers and impossible or improbable numeric values [12].
In addition, the collected data were linked to hospital inpatient data, national cancer registry data, and national death registry data, which enabled long-term follow-up of participants and their health-related outcomes. Hospital inpatient data on participants in England, Scotland, and Wales were received from their respective databases: the Hospital Episode Statistics for England (HES), the Scottish Morbidity Record (SMR), and the Patient Episode Database for Wales (PEDW) [9]. National cancer registry data and national death registry data were acquired from the National Health Service (NHS) Digital (for participants in England or Wales) and the NHS Central Register (for participants in Scotland) [13].
Study design and population
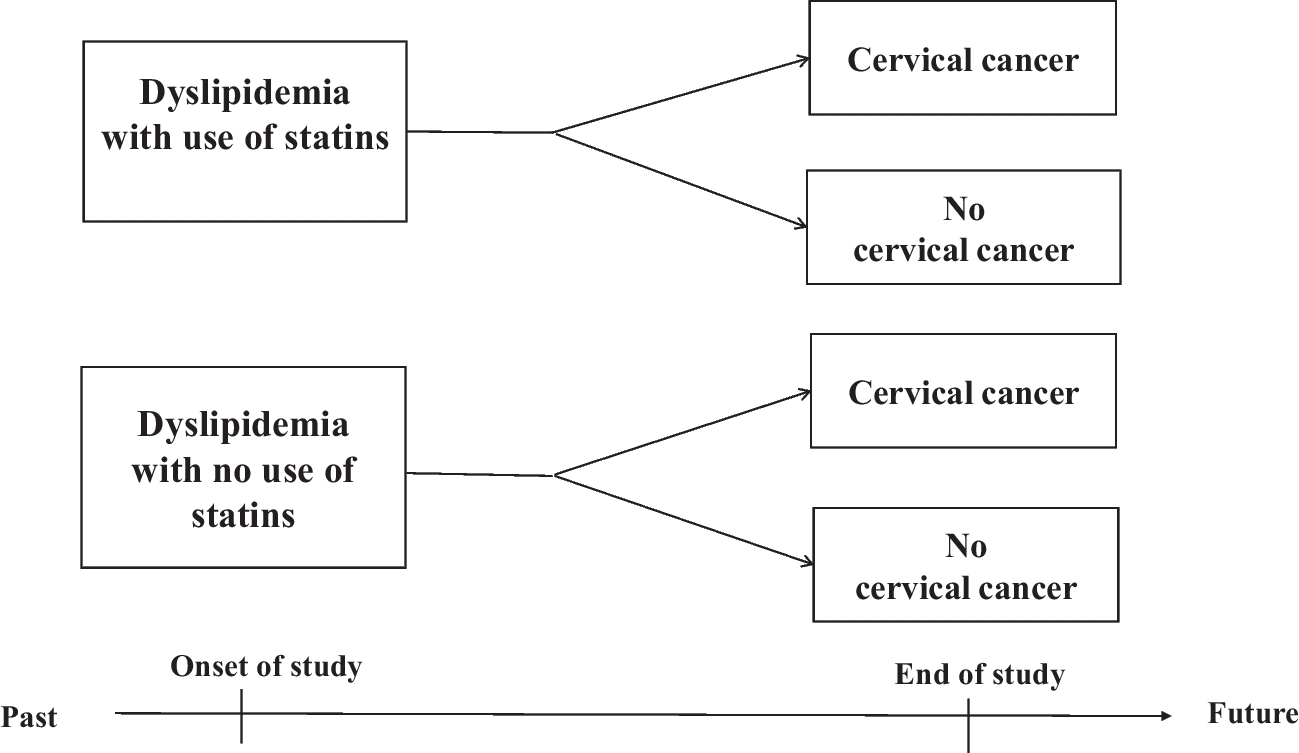
We conducted a cohort study of female participants in the UK Biobank. We excluded females who had a history of cancer (except for non-melanoma skin cancer) [14], ovarian cyst, polycystic ovarian syndrome, endometriosis, endometrial hyperplasia, endometrial polyp, cervical polyp, ovariectomy, hysterectomy, or cervicectomy at baseline, or who had withdrawn from the UK Biobank. The required information was collected through touchscreen questionnaire/verbal interview and linkage to hospital inpatient data and national cancer registry data. Details of the variable name, data field, and data coding in the UK Biobank are given in Supplemental Table 1.
Exposure
Information on the use of statins was self-reported and collected through verbal interview. If the participant indicated in the touchscreen that they were taking cholesterol-lowering drugs, then the interviewer was prompted to record the name of the drug. Use of statins was defined as continuous use of statins for months or years. It did not include the use of statins for a few days or a week, or prescribed statins that were not taken [15]. Based on treatment with a statin or not, the participants were divided into statin users and non-users. The statins recorded in the UK Biobank included simvastatin, atorvastatin, rosuvastatin, and pravastatin (Supplemental Table 2). Specific data on usage, dosage, and duration were not recorded.
Outcome
The outcomes were first diagnoses of ovarian cancer, endometrial cancer, cervical cancer, ovarian cyst, polycystic ovarian syndrome, endometriosis, endometrial hyperplasia, endometrial polyp, and cervical polyp during the follow-up period. Cases of incident ovarian cancer, endometrial cancer, and cervical cancer were ascertained by linking to national cancer registry data and hospital inpatient data, and incident ovarian cyst, polycystic ovarian syndrome, endometriosis, endometrial hyperplasia, endometrial polyp, and cervical polyp were ascertained by linking to hospital inpatient data. We also obtained the first diagnosis date from national cancer registry data and hospital inpatient data. The corresponding variable name, data field, and data coding in the UK Biobank are presented in Supplemental Table 3.
Follow-up time
When assessing cancer outcomes, female participants were followed from baseline visit until the first diagnosis of the outcome, the diagnosis of other cancer (except for non-melanoma skin cancer), death, or the last linkage date with national cancer registry data and hospital inpatient data (31 December 2016 for national cancer registry data, 31 March 2017 for HES, 31 October 2016 for SMR, or 29 February 2016 for PEDW), whichever came first [13, 16]. In addition, when assessing non-cancer outcomes, female participants were followed from baseline visit until the first diagnosis of the outcome, death, or the last linkage date with hospital inpatient data (31 March 2017 for HES, 31 October 2016 for SMR or 29 February 2016 for PEDW), whichever came first [13, 16]. The required information was obtained by linking to national cancer registry data, hospital inpatient data, and national death registry data.
Covariates
The covariates included age, race (white or others), Townsend deprivation index (quintiles), smoking status (never, past, or current), alcohol use (daily or almost daily, three or four times a week, once or twice a week, one to three times a month, special occasions only, or never), vigorous physical activity (low, moderate, or high), number of childbirth, number of abortion, comorbidities at baseline (hyperlipidemia, ischemic heart disease, ischemic cerebrovascular disease, hypertension, diabetes, obesity, or pelvic inflammatory disease), and oral contraceptive. These covariates were factors known to be correlated with risks of all outcomes according to previous literatures, or indications for use of statins [4]. Moreover, for each outcome, we included extra related covariates which were correlated solely with risk of this outcome according to previous literatures (Supplemental Table 4). All these covariates were collected through touchscreen questionnaire/verbal interview and linkage to hospital inpatient data. Details of the variable name, data field and data coding in the UK Biobank are given in Supplemental Table 5. The Townsend deprivation index was widely used as a measure of socioeconomic deprivation, with higher scores indicating greater deprivation [17]. The number of childbirth was derived from the number of live births and stillbirths. In addition, the number of abortion was derived from the number of spontaneous miscarriages and pregnancy terminations. Furthermore, obesity was defined as body mass index (BMI) ≥ 30. Missing data were coded as a missing indicator category for categorical variables and with mean values for continuous variables.
Statistical analysisBaseline analysis
Comparisons were made between satin users and non-users for the following variables at baseline: age, race, Townsend deprivation index, smoking status, alcohol use, vigorous physical activity, number of childbirth, number of abortion, comorbidities (hyperlipidemia, ischemic heart disease, ischemic cerebrovascular disease, hypertension, diabetes, obesity, and pelvic inflammatory disease), and oral contraceptive. Continuous variables were presented as mean (standard deviation (SD)) and analyzed by using the Student’s t-test or median (interquartile range (IQR)) and by Wilcoxon rank-sum test, as appropriate. Categorical variables were presented as counts and percentages and evaluated by chi-square test, Fisher’s exact test, or rank-sum test as appropriate.
Main analysis
We used Cox proportional hazards regression to analyze the associations between use of statins and risks of ovarian, uterine, and cervical diseases, with results expressed as hazard ratios (HRs) and 95% confidence intervals (95% CI). Time since baseline visit was used as the underlying timescale. We developed a multivariable model with adjustment for age, race, Townsend deprivation index, smoking status, alcohol use, vigorous physical activity, number of childbirth, number of abortion, any comorbidity at baseline (hyperlipidemia, ischemic heart disease, ischemic cerebrovascular disease, hypertension, diabetes, obesity, or pelvic inflammatory disease), and oral contraceptive. Moreover, for better control of some outcome-specific confounders, we included extra related covariates in the Cox proportional hazards model for each outcome (Supplemental Table 4). Furthermore, the analyses of ovarian cyst, polycystic ovarian syndrome, and endometriosis were restricted to the premenopausal female cohort because these diseases are less likely to develop after menopause.
Subgroup analysis
We used Schoenfeld residuals to test the proportional hazards assumption and found that the assumption was violated for age. Thus, we performed subgroup analysis stratified by age to assess if change in result was noteworthy. We performed subgroup analysis stratified by the median age (age (≤ 56 or > 56 years) for ovarian cancer, endometrial cancer, cervical cancer, endometrial hyperplasia, endometrial polyp, and cervical polyp; age (≤ 46 or > 46 years) for ovarian cyst, polycystic ovarian syndrome, and endometriosis). In addition, to assess the potential modification effects by statin type, we performed subgroup analysis among different statins.
Sensitivity analysis
We conducted several sensitivity analyses to confirm the robustness of the results. First, to minimize the potential for reverse causality, we performed a sensitivity analysis by excluding the first year of follow-up (for all individuals). Second, to minimize indication bias, we performed a sensitivity analysis by restricting the study population to females with hyperlipidemia, ischemic heart disease, ischemic cerebrovascular disease, hypertension, diabetes, or obesity (all these diseases are indications for use of statins or common comorbidities in statin users). Third, as the average age of menopause in UK women is 51 years [18], we performed a sensitivity analysis by censoring the follow-up at age 51 for the outcomes of ovarian cyst, polycystic ovarian syndrome, and endometriosis.
All data analyses were conducted using R version 3.6.3. Statistical significance was set at P < 0.05 using two-sided tests. However, as the threshold of P < 0.05 is conventional and arbitrary, it does not convey any meaningful evidence of clinical significance or the size of the effect. Thus, we comprehensively examined the precise P values, the estimates of the effect sizes, and the confidence intervals, to interpret the statistical analyses and evaluate the clinical significances [19].


Comments (0)