
Remember me


The measured resection (MR) technique is one of the commonly used methods to achieve ligament balance in total knee arthroplasty (TKA), and achieving adequate ligament balance in extension and flexion is vital for the success of TKA.1–3 Surgeons using the MR technique for varus knees mostly make the posterior femoral cut (PFC) either in 3° of external rotation (ER) to the posterior condylar line (PCL) or parallel to the surgical transepicondylar axis (SEA) or perpendicular to the Whiteside line (WL).2–5 However, a lack of consensus exists on achieving a symmetrical and well-balanced flexion space, if the PFC is planned either in 3° of ER to the PCL or parallel to the SEA or perpendicular to the WL, in TKAs done for varus knee osteoarthritis (VKO).4–8
On the other hand, in gap balancing (GB) TKA, the femoral component rotation (FCR) is planned parallel to the proximal tibial resection plane (TRP). A difference of opinion exists when it comes to the influence of preoperative deformity on the FCR with respect to the distal femur rotational landmarks (PCL, SEA, and WL) in GB TKA.9,10 Nodzo et al10 showed that in GB TKA, the severity of the preoperative varus deformity correlated with an increase in the femoral component ER, with respect to the SEA and PCL. Whereas Heesterbeek et al9 showed that in GB TKA, the preoperative deformity did not influence the FCR with respect to the PCL. While these studies were done on knees with mild-to-moderate deformity, a paucity of research exists on knees with severe deformity, and the data are limited with a small sample size.11
We hypothesized that in the MR TKAs done for VKO, the risk of flexion gap asymmetry (FGA) is high when the preoperative deformity is severe in comparison with that in knees with less severe deformity because (a) the lateral laxity (which normally exists during flexion) increases; (b) a considerable soft-tissue contracture persists medially; or c) both these factors may coexist, in flexion, predominantly in knees with more severe varus deformity, despite adequately releasing the soft tissues in extension.
Therefore, this study asks the following: (1) What is the (a) calculated FGA and (b) theoretical risk of a >2° and >3° FGA, if the PFC is planned based on each of the three intraoperative methods of MR technique ,that is, 3° ER to the PCL, parallel to the SEA, and perpendicular to the WL, in TKAs done for VKO? (2) Does the severity of preoperative deformity influence a) FGA and b) the risk of a >2° and >3° FGA, if the PFC is planned based on each of the abovementioned three MR methods, in TKAs done for VKO?
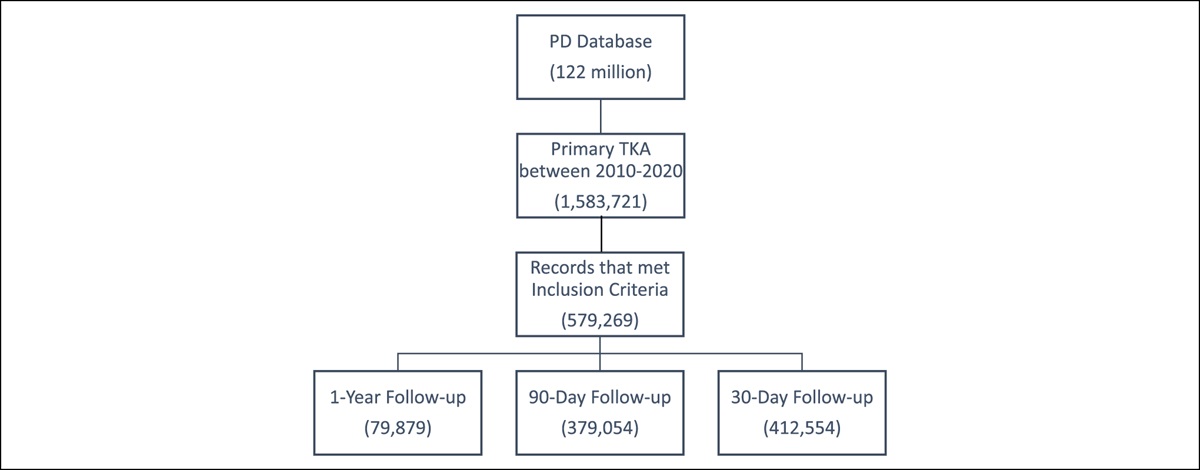
Methods Study Design and ParticipantsWe prospectively studied 320 consecutive patients (500 knees) who underwent computer-assisted TKAs for VKO between January 2017 and March 2020. We excluded 34 knees in which the location of the medial epicondylar sulcus (MES) was doubtful or not discernible by palpation during surgery, five knees where constrained implants were used, 114 limbs which showed either >3° deviation in hip-knee-ankle angle (HKAA) from a neutral alignment (180°) or >1° deviation in the coronal alignment of the tibial components from a neutral alignment (90°) or both in postoperative standing radiographs, and 16 patients (26 knees) who failed to follow up. The inclusion criteria were patients who underwent primary, cruciate-substituting, computer-assisted TKAs for primary knee osteoarthritis with varus deformity. Our institutional review board approved the study design (PRA/IRB/001/2017), and informed consent was obtained from all patients.
Surgical Technique and Calculation of Flexion Gap AsymmetryAll TKAs were performed by a single surgeon (R.K.) using the Kick computer navigation system with its software (Knee 2.6.0, Brainlab). All procedures were performed with the tourniquet, which was inflated just before the skin incision and deflated soon after the cement had hardened. A standard medial parapatellar approach was used in all cases. PFC Sigma (DePuy Orthopaedics) cemented fixed bearing, posterior cruciate-substituting implant was used, and the patella was resurfaced in all patients. The surgical aim in all knees was to align the femoral and tibial components perpendicular to the respective mechanical axes and to attain a neutral lower limb mechanical axis.
Tibial and femoral arrays were mounted on Schanz pins inserted into the proximal tibia and distal femur. First, the computer registered the femoral mechanical axis based on the acquisition of its proximal and distal points, which were the center of the femoral head (acquired by pivoting the femur) and a point 1 cm anterior to the superior border of the intercondylar notch, respectively. Then, the MES, which is located posterior and proximal to the center of the medial epicondyle (Figure 1, A–C), was identified using the tactile method and registered by placing the tip of the pointer on the MES.12 Whenever the overlying synovium was hypertrophied, it was excised to discern the location of the MES (Figure 1, B and C). After this, the lateral epicondylar point, which is the most prominent point on the lateral epicondyle, was registered using the pointer. Based on the MES and lateral epicondylar point, the computer determined the SEA. Subsequently, the WL, which is the axis between two points, that is, the deepest part of the patella groove anteriorly (Figure 2, A) and the center of the intercondylar notch posteriorly (Figure 2, B), as defined by Arima et al,13 was registered by holding the pointer along this axis (Figure 2, C). Finally, the surfaces of the femoral condyles were painted using the pointer, and based on the most posterior points on the medial and lateral femoral condyles, the computer determined the PCL.
 Figure 1:
 A, Image of the medial condyle of the human femur showing the center of the medial epicondyle (black arrow) and MES (red arrow). B, Image of the hypertrophied synovium excised to discern the location of the MES (tip of the pointer). The black arrow points to the center of the medial epicondyle. C, Image showing the close-up view of the center of the medial epicondyle (black arrow) and the MES (tip of the pointer). MES = medial epicondylar sulcus
 Figure 2:
 A, Image of the deepest part of the patella groove marked using a sterile marker pen (blue arrow). B, Image of the Center of the intercondylar notch determined by measuring the distance between the posterior most inner surfaces of the intercondylar notch with a ruler accurate to 1 millimeter and marking the midpoint (red arrow) on a suture material using a sterile marker pen. C, Image showing acquisition of the WL done by holding the pointer along the line connecting the deepest part of the patella groove and the center of the intercondylar notch. WL = Whiteside line
On the tibial side, proximal and distal points of the tibial mechanical axis were defined by acquiring the posterior aspect of the ACL insertion point and the software calculation based on the medial and lateral malleoli reference points, respectively. Then, the most medial, lateral, and anterior points of the proximal tibia were acquired, and the anterior-posterior axis of the proximal tibia was registered by holding the pointer horizontally along the line that connected the tibial attachment of the PCL and the medial and middle third junction of the tibial tuberosity. Finally, modeling of the tibial plateaus was done by placing the tip of the pointer on the deepest point of the plateaus and moving it spirally outward.
The stepwise medial soft-tissue release technique protocol followed in this study is demonstrated in Figure 3. No additional soft-tissue release was performed, if the residual varus deformity was < 2° in extension, because the deformity consistently got corrected after the excision of posterior femoral condyles, the medial one usually being larger with more osteophytes.14 Once the desired correction was achieved in extension, proximal tibial resection was done perpendicular to its mechanical axis using navigation. After this, the spring-loaded tensioner device (DePuy, Leeds) was inserted to open the medial and lateral gaps. The device loaded the medial and lateral compartments separately and constantly with two springs each exerting a load of 12 kg through two parallel plates (Figure 4, A). With the device in situ, medial and lateral gaps were determined in extension and 90° flexion using navigation. Furthermore, in 90° flexion, with the tensioner device in situ and the patella located in the trochlea, the relative positions of various axes (PCL, SEA, and axis perpendicular to the WL) with respect to TRP were determined and stored using the computer ( Figure 4, B and C). All the angles were recorded close to 0.5°. FGA based on the PCL (FGAp), SEA (FGAs), and WL (FGAw) was calculated from the recorded values (Figure 4, B and C) as follows:
FGAp = PFC planned 3° ER to the PCL versus the TRP (Figure 5, A). FGAs = PFC planned parallel to the SEA versus the TRP (Figure 5, B). FGAw = PFC planned perpendicular to the WL versus the TRP (Figure 5, C). Figure 3:
 Flowchart showing the stepwise medial soft-tissue release technique protocol followed to correct the varus deformity.
 Figure 4:
 A, Image of the medial and lateral gaps opened using a spring-loaded tensioner device with a knee in 90° flexion. B, Illustration showing the relative positions of PCL, SEA, and the axis perpendicular to WL with respect to TRP in a knee with mild preoperative varus deformity (HKAA −172.2°). The FGAp, FGAs, and FGAw values were ≤3°, that is, −2.5°, −2.5°, and 0.0°, respectively. C, Illustration showing the relative positions of PCL, SEA, and the axis perpendicular to WL with respect to TRP in a knee with severe preoperative varus deformity (HKAA −146.3°). The FGAp, FGAs, and FGAw values were > 3°, that is, −11.0°, −11.5°, and −5.0°, respectively. PCL = posterior condylar line, SEA = surgical transepicondylar axis, WL = Whiteside line, TRP = proximal tibial resection plane, HKAA = hip-knee-ankle angle, FGAp = flexion gap asymmetry based on PCL, FGAs = flexion gap asymmetry based on SEA, FGAw = flexion gap asymmetry based on WL
 Figure 5:
 A through C, Diagrams of the knee in 90° flexion, illustrating the various reference axes (PCL, SEA, and WL) used for planning the PFC in MR TKA. A, FGAp is the PFC planned 3° ER to the PCL versus TRP. B, FGAs is the PFC planned parallel to SEA versus TRP. C, FGAw is the PFC planned perpendicular to WL versus TRP. PCL = posterior condylar line, SEA = surgical transepicondylar axis, WL = Whiteside line, PFC = posterior femoral cut, MR = measured resection, TKA = total knee arthroplasty, FGAp = flexion gap asymmetry based on PCL, ER = external rotation, TRP = proximal tibial resection plane, FGAs = flexion gap asymmetry based on SEA, FGAw = flexion gap asymmetry based on WL
The value was positive if the planned PFC was in ER with respect to the TRP and vice versa.
Femoral cuts were made using navigation. The GB technique was used to decide the FCR. For sagittal plane positioning of the femoral component, anterior referencing was used, and the component was positioned perpendicular to the distal femur anterior cortex axis, using navigation, to avoid anterior femoral notching (AFN).15 Tibial component rotation was based on self-centering of the trial tibial implant during trial reduction if the orientation was (a) in line with the medial and middle third junction of the tibial tuberosity (neutral rotational alignment), (b) in ER, or (c) in internal rotation (IR) with proper patella tracking.8 However, if the orientation was in IR and the patella tracking was improper, neutral rotational alignment was established.16 After the final implantation and deflating of the tourniquet, patellar tracking was tested once again intraoperatively using the towel clip test.17 The towel clip test is done by reapproximating the vastus medialis and medial retinaculum to the medial border of the patella with a stitch. The knee is taken through a range of motion. Any elevation of the medial edge of the patella is considered a positive test. Lateral retinacular release (LRR) was done in the knees, which showed a positive towel clip test.
Hip-Knee-Ankle AngleStanding full-length (hip to ankle) weight-bearing radiographs were obtained in all patients, and the degree of coronal knee deformity, that is, the HKAA, was determined before surgery and within 6 weeks post-surgery. Preoperative deformity was classified as mild, moderate, or severe, if the HKAA was between 170° and 180°, 160° and 169.9°, or < 160°, respectively.
Tibial Component Coronal AlignmentWeight-bearing anterior-posterior knee radiographs were obtained in all patients within 6 weeks post-surgery, and the coronal alignment of tibial components was measured as the medial angle between the mechanical axis of the tibia and the tangent drawn along the articular surface of the tibial component.
Knee Flexion and Knee Society ScoreActive knee flexion was measured using a goniometer with the patient in the supine position. Clinical and functional assessment was done using the Knee Society Score (KSS) (Insall, 1989), which is divided into two sections: a clinical knee score (Knee Society Knee Score [KSKS]) and a function score (Knee Society Function Score [KSFS]). Knee flexion, KSKS, and KSFS were documented before surgery and at 2 years post-surgery.
FGAp, FGAs, FGAw, and Hip-Knee-Ankle AngleThe following analyses were conducted based on the FGAp, FGAs, and FGAw values.
Theoretical risk of having a >2° and >3° FGAp, FGAs, and FGAw. Comparison of FGAp, FGAs, and FGAw between knees with mild, moderate, and severe preoperative varus deformity. Correlation between preoperative HKAA and the FGAp, FGAs, and FGAw. Comparison of incidence of > 2° and > 3° FGAp, FGAs, and FGAw between knees with mild, moderate, and severe preoperative varus deformity. Calculated Femoral Component RotationThe Calculated Femoral Component Rotation (FCRc) was estimated using the following method:
FCRc = FCR planned with respect to the SEA (Figure 6, A) + Deviation from the planned FCR (resulting from an error during the execution of the anterior-posterior cuts), as quantified by navigation (Figure 6, B). A positive value denotes ER and vice versa.
 Figure 6:
 A, Illustration showing the FCR planned with respect to SEA (+ve for ER). B, Illustration showing deviation from the planned FCR (blue versus yellow plane), resulting from error during the execution of anterior-posterior cuts (+ve for ER). A and B, The estimated FCRc value in this case was 7.0° + 1°, that is, 8.0° (+ve for ER). FCR = femoral component rotation, SEA = surgical transepicondylar axis, ER = external rotation, FCRc = calculated femoral component rotation
Knee flexion, KSKS, and KSFS between knees with absolute FCRc values ≤ 3° and > 3° were compared at 2 years post-surgery.
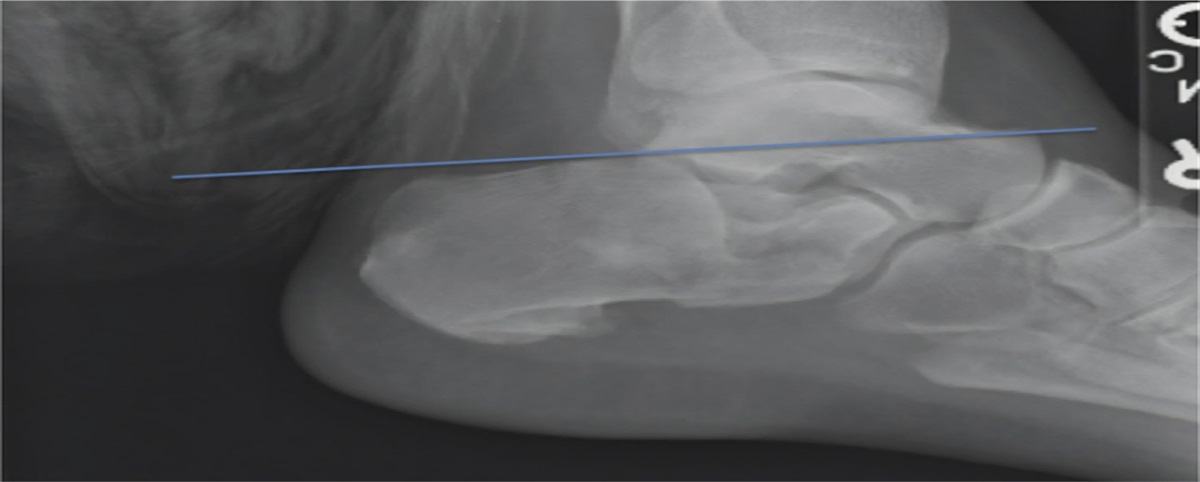
Lateral Retinacular Release and Anterior Femoral NotchingThe number of knees that required LRR was noted. The incidence of LRR was compared between knees with FCRc < 0° and those with FCRc ≥ 0°. Lateral knee radiographs were obtained in all patients within 6 weeks post-surgery and were scrutinized for AFN. The incidence of AFN was compared between knees with FCRc 0 to +3° and those with FCRc > +3°.
Loosening and Other ComplicationsWeight-bearing anterior-posterior and lateral knee radiographs obtained in all patients before surgery, within 6 weeks post-surgery, and at 2 years post-surgery were scrutinized for radiolucent lines and signs of loosening. Patients were also scrutinized for complications of navigated TKA, such as periprosthetic fracture, pin site fracture, pin tract infection, and surgical site infection, until 2 years post-surgery. All radiographs were obtained by an experienced technician and uploaded using a computerized imaging system linked to a picture archiving and communication system. The radiologist analyzed and measured the radiographic images using ImageJ image processing and analysis software version 1.41 (National Institutes of Health).
Statistical AnalysisBased on the literature, with a 25% incidence, the sample size required for our study with the precision/absolute error of 10% and confidence interval of 95%, for an 80% power, was estimated to be 72.6 HKAA, knee flexion, KSKS, and KSFS before and after surgery were compared using the paired Student t-test, and knee flexion, KSKS, and KSFS between groups were compared using the independent Student t-test. A nonparametric test (Mann-Whitney U test) was used to compare FGAp, FGAs, and FGAw values between groups. These data were reported as mean ± standard deviation with range, and in addition, the nonparametric data (FGAp, FGAs, FGAw, and FCRc) were also reported as median with interquartile range. For categorical variables (LRR, AFN, >2° and >3° FGAp, FGAs, and FGAw), we used the chi square test or Fisher exact test (when the expected cell count was < 5) and reported as frequencies (percentage). Spearman correlation coefficient test was used to find the correlation between the preoperative HKAA and the FGAp, FGAs, and FGAw values and was reported as ρ (rho). A P-value of < 0.05 was taken to be statistically significant. Data were statistically evaluated with IBM SPSS Statistics software for Windows, version 26.0., IBM Corp.
Results Patient DemographicsComplete data of 216 patients (321 knees) were available for analysis. 177 patients (81.9%) were female, and 39 (18.1%) were male. The mean age of patients at the time of surgery was 66.5 ± 8.2 years (range 44–89 years). The mean body mass index was 29 ± 3.9 kg/m 2 (range 21.2–45.4 kg/m2).
Knee Flexion, Knee Society Knee Score, Knee Society Function Score, Hip-Knee-Ankle Angle, and Tibial Component Coronal AlignmentMean knee flexion, KSKS, KSFS, and HKAA before and after surgery and post-surgery tibial component coronal alignment (TCCA) are summarized in Table 1.
Table 1 - Mean Knee Flexion, KSKS, KSFS, and HKAA Before and After Surgery and Post-surgery TCCA. Variables Mean ± Standard Deviation (Range) P Before Surgery After Surgery Knee flexion 128.8° ± 14.2° (94°-158°) 133.4° ± 12° (96°-158°) <0.001 KSKS 45.6 ± 13.5 (20-72) 92.9 ± 5.7 (77-100) <0.001 KSFS 42.3 ± 7.5 (30-55) 91.4 ± 6.2 (75-100) <0.001 HKAA 165.8° ± 7.7° (143.8°-180°) 179.9° ± 1.3° (177°-183°) <0.001 TCCA — 89.9° ± 0.6 (89°-91°) —KSKS = Knee Society Knee Score, KSFS = Knee Society Function Score, HKAA = hip-knee-ankle angle, TCCA = tibial component coronal alignment. The bolded entries met statistical significance P < 0.05.
Mean, standard deviation, and range of FGAp, FGAs, and FGAw were −2.9° ± 3.2° (−11.5° to 4°), −3.1° ± 4.1° (−14.5° to 8.5°), and −3.1° ± 4.2° (−12.5° to 10°), respectively. The respective median and interquartile range of FGAp, FGAs, and FGAw were −2.5° (−4.5° to −0.5°), −3° (−5° to −1°), and −3° (−6° to −0.5°). Theoretical risk of a >2° FGAp, FGAs, and FGAw was present in 58.9% (189/321), 67.3% (216/321), and 69.2% (222/321) knees, respectively, and a theoretical risk of a >3° FGAp, FGAs, and FGAw was present in 39.3% (126/321), 52.3% (168/321), and 56.1% (180/321) knees, respectively.
Comparison of FGAp, FGAs, and FGAw between knees with mild, moderate, and severe preoperative varus deformity is summarized in Table 2. FGAp and FGAs correlated statistically with preoperative HKAA (ρ = 0.157 and 0.188, and P = 0.005 and <0.001, respectively). FGAw showed no correlation with preoperative HKAA (ρ = 0.056, P = 0.32). Comparison of incidence of > 2° and > 3° FGAp, FGAs, and FGAw between knees with mild, moderate, and severe preoperative varus deformity is summarized in Tables 3 and 4, respectively.
Table 2 - Comparison of FGAp, FGAs, and FGAw Between Knees with Mild, Moderate, and Severe Preoperative Varus Deformity Parameters Median (Interquartile Range) of FGA in degrees Deformitya P Deformitya P Deformitya P Mild Moderate Moderate Severe Mild Severe FGAp −1.5 (−4.75 to −0.125) −2.5 (−4 to −1) 0.17 −2.5 (−4 to −1) −4 (−6.5 to −0.5) 0.02 −1.5 (−4.75 to −0.125) −4 (−6.5 to −0.5) 0.006 FGAs −2 (−4.25 to −0.25) −3.5 (−5 to −1.5) 0.006 −3.5 (−5 to −1.5) −3.75 (−5.5 to −0.625) 0.64 −2 (−4.25 to −0.25) −3.75 (−5.5 to −0.625) 0.032 FGAw −2.75 (−5.375 to 0) −3.5 (−6 to −1) 0.54 −3.5 (−6 to −1) −3 (−6.375 to −0.5) 1 −2.75 (−5.375 to 0) −3 (−6.375 to −0.5) 0.67FGA = flexion gap asymmetry, FGAp = FGA based on the posterior condylar line, FGAs = FGA based on the surgical transepicondylar axis, FGAw = FGA based on the Whiteside line
aPreoperative varus deformity. Negative value suggests that the planned posterior femoral cut was in internal rotation with respect to the proximal tibial resection plane and vice versa. The bolded entries met statistical significance P < 0.05.
aPreoperative varus deformity. FGA = flexion gap asymmetry, FGAp = FGA based on the posterior condylar line, FGAs = FGA based on the surgical transepicondylar axis, FGAw = FGA based on the Whiteside line. The bolded entries met statistical significance P < 0.05.
FGA = flexion gap asymmetry, FGAp = FGA based on the posterior condylar line, FGAs = FGA based on the surgical transepicondylar axis, FGAw = FGA based on the Whiteside line
aPreoperative varus deformity. The bolded entries met statistical significance P < 0.05.
The mean, standard deviation, and range of FCRc was 3.1° ± 4° (−7.5° to 14.5°). The median was 3°, and the interquartile range was 1° to 5°. The absolute FCRc value was ≤ 3°, > 3°, >5°, >7°, >9°, and >11° in 153 (47.7%), 168 (52.3%), 87 (27.1%), 45 (14%), 21 (6.5%), and 12 (3.7%) of 321 knees, respectively. Comparison of knee flexion, KSKS, and KSFS between the knees with absolute FCRc values ≤ 3° and > 3° at 2 years post-surgery is summarized in Table 5.
Table 5 - Comparison of Knee Flexion, KSKS, and KSFS Between the Knees With Absolute FCRc Value ≤ 3° and > 3° at 2 Years Post-surgery Parameters Knees with absolute FCRc value ≤ 3°n = 153 Knees with absolute FCRc value > 3°n = 168 P Knee flexion 134.1° ± 9.7° (96°-156°) 132.8° ± 13.7° (96°-158°) 0.33 KSKS 93.2 ± 5.4 (81-100) 92.7 ± 6 (77-100) 0.44 KSFS 91.8 ± 6 (80-100) 91.1 ± 6.3 (75-100) 0.29FCRc = calculated femoral component rotation, KSKS = Knee Society Knee Score, KSFS = Knee Society Function Score. P < 0.05 is considered statistically significant.
In our study, LRR was required in 14 of 321 knees (4.4%). In 54 of 321 knees (16.8%), the femoral component was theoretically placed in IR with respect to the SEA, (FCRc was < 0°) and in only two (3.7%) of these 54 knees, LRR was required. On the contrary, in 267 of 321 knees (83.2%), the femoral component was theoretically placed parallel or in ER with respect to the SEA (FCRc was ≥ 0°), and in only 12 (4.5%) of these 267 knees, LRR was required. The rate of LRR was not significantly different between the knees with FCRc < 0° and FCRc ≥ 0° (P = 1).
Anterior femoral notching was present in 18 of 321 knees (5.6%). Within the 267 knees where the femoral component was theoretically placed parallel or in ER with respect to the SEA (FCRc ≥ 0°), the incidence of AFN was not significantly different between knees with FCRc 0 to +3° (n = 114) and those with FCRc > +3° (n = 153), that is, 5 of 114 (4.4%) vs 10 of 153 knees (6.5%; P = 0.45). Of the remaining 54 knees in which the femoral component was theoretically placed in IR with respect to the SEA (FCRc < 0°), AFN was seen in three knees (5.6%).
Loosening and Other ComplicationsNone of the knees showed progressive radiolucent lines or loosening in the postoperative radiographs at 2 years post-surgery. One patient developed a deep infection in one of the knees 3 weeks after surgery, which was treated by débridement and exchange of the polyethylene insert and recovered completely. None of the knees had navigation-related complications such as pin tract infection or pin site fracture.
Discussion Flexion Gap Asymmetry Calculated Based on the Measured Resection TechniqueAchieving adequate ligament balance in extension and flexion is vital for the success of TKA.1 In our study, the FGAp, FGAs, and FGAw values varied widely, that is, −11.5° to 4°, −14.5° to 8.5°, and −12.5° to 10°, respectively. Similarly, Itokazu et al6 showed that in their series of 48 TKAs done for VKO, after performing the medial soft-tissue release to create a rectangular extension gap, the estimated FGAp and FGAs values varied widely, that is, −8° to 7° and −7° to 9°, respectively. The probable reasons for the wide variation in these values are (a) the flexion space balance is more patient-specific, (b) the same is influenced by the extent of the release performed to balance the knee in extension, and (c) a greater variation in the distal femoral osseous landmarks is observed between patients.9,10,18,19
In our study, FGAw showed the largest variation in the values compared with FGAp and FGAs. However, Channoom et al20 in their 140 navigated TKAs done for VKO showed that the WL had the smallest deviation from the GB technique when compared with the PCL or SEA. This discrepancy in the results could be because knees with >10° deformity were excluded from the study by Channoom et al.20 However, in our study, the preoperative deformity was >10° and >20° in at least 66.4% (213/321) and 22.4% (72/321) knees, respectively, and the maximum deformity observed was 36.2°. Poilvache et al21 concluded that in arthritic knees, the anterior-posterior axis is sometimes difficult to define because of trochlear wear or intercondylar osteophytes. Nagamine et al22 showed that osteoarthritic knees may undergo anatomic variations and the WL is less reliable when compared with the PCL in VKO. This could possibly explain the differences observed between the results from our study and those from the study by Channoom et al.20
Our study shows that > 3° FGAp, FGAs, and FGAw was observed in at least 39.3%, 52.3%, and 56.1% of knees, respectively. Similarly, in the study by Itokazu et al,6 >3° FGAp and FGAs was observed in 25% (12/48) and 27% (13/48) knees, respectively. In addition, Fehring et al19 in their series of 100 TKAs done for 84 varus and 16 valgus knees showed that after performing a soft-tissue release to create the rectangular extension gap, > 3° FGAp was observed in at least 44% of knees. In our study, > 2° FGAp, FGAs, and FGAw was observed in at least 58.9%, 67.3%, and 69.2% of knees, respectively. Tsukeoka et al23 showed that an FGA of > 2° negatively affects knee flexion. Similarly, a systematic review by Babazadeh et al1 showed that the FGA affects knee function negatively after TKA.
Influence of Hip-Knee-Ankle Angle on Flexion Gap AsymmetryVKO with moderate-to-severe deformity is
Comments (0)