
Remember me
Brain-computer interfaces (BCIs) devices are quickly transforming the field of motor rehabilitation. By establishing a direct communication pathway between the brain and external devices, BCIs enable individuals with motor impairments to control prosthetic limbs, digital assistants, and other assistive effectors using their brain activity. BCIs show potential to enhance the quality of life of people affected by strokes (Biasiucci et al., 2018), spinal cord injuries (Lorach et al., 2023), neurodegenerative diseases (Vansteensel et al., 2016), but can also open up new avenues for research on neuroscience and brain dynamics. Implanted BCIs based on electrocorticography (ECoG) or microelectrode arrays have achieved major advancements in recent years, both in their decoding capabilities (Benabid et al., 2019; Metzger et al., 2023; Deo et al., 2024) and their usability in home environments (Lorach et al., 2023; Vansteensel et al., 2024).
Decoding different motor states from neural signals remains one of the main challenges of BCIs to enable the control of external effectors. As of today, most of current motor BCI systems rely on signal amplitude modulations, in different frequency bands [generally mu/beta (Abiri et al., 2019) and gamma (Krusienski et al., 2011)], as decoding features. Research on the brain motor-related behavior has indeed been generally focusing on the study of amplitude variations (Cheyne et al., 2008; Cheyne and Ferrari, 2013; Jurkiewicz et al., 2006; Muthukumaraswamy, 2010; Saleh et al., 2010). In ECoG, multiple studies showed that high-gamma amplitude oscillations (>70Hz) correlate closely with specific aspects of motor functions (Tam et al., 2019; Wang et al., 2012; Branco et al., 2017; Spüler et al., 2014). While amplitude modulation based decoding is effective, it overlooks some dimensions of the neural signals. For example, the signal phase modulations, in particular in the very low frequency band (< 2Hz), also seem to contain information about motor behaviors (Combrisson et al., 2017). Currently only few—if any—BCIs use phase information as decoding features, which has however been shown to be informative for continuous movement decoding (Hammer et al., 2013).
To address these limitations, recent research has explored dynamic interactions between neural oscillations in different frequency bands, a phenomenon known as cross-frequency coupling (CFC). Among these, theta/gamma coupling is the most frequently reported and is thought to support different cognitive operations such as short-term memory, long-distance communication, and sensory stimulus integration (Lisman and Jensen, 2013; Hyafil et al., 2015). A particular type of CFC, phase-amplitude coupling (PAC) where the phase of a slow oscillation modulates the amplitude of a faster oscillation has also been studied in motor processes. PAC measurements have shown promise in highlighting critical neural patterns during movement execution and resting phase in ECoG data (Miller et al., 2012), and even during different phases of movement namely preparation and execution in EEG recordings (Combrisson et al., 2017). These studies suggest that PAC features could be used for motor states decoding in the context of BCI. Unlike most decoding methods that focus solely on signal amplitude across frequency bands, PAC-based decoding provides a more nuanced perspective by examining how the phase of low-frequency oscillations interacts with the amplitude of high-frequency oscillations. This interplay could provide insights on richer neural codes, which may contain information beneficial to BCI decoding (Canolty and Knight, 2010).
In this study, we investigate whether PAC-derived features (1) provide relevant information to differentiate various motor behaviors from the resting state in sensorimotor ECoG recordings and (2) could be used to in the context of asynchronous BCIs systems. We computed PAC from ECoG data acquired with WIMAGINE implant (Mestais et al., 2015) on a single tetraplegic individual performing attempted motor tasks to control a virtual avatar. To test their predictive power and gain understanding on how PAC is modulated across different attempted movements, these features were employed to train supervised classifiers to categorize hand movements from idle, as well as right from left hand movements. PAC features were then implemented in a pseudo-online manner for a 3-states classification, to assess if they could be used in real-time asynchronous ECoG-BCIs. The primary objectives of this study are to investigate the potential contribution of PAC features in decoding motor attempts from brain signals and better characterize PAC within the sensorimotor cortex during lateralized motor tasks. We show that PAC features achieve a high-accuracy classification between a motor attempt and rest, as well as between two distinct motor attempts. Additionally, we demonstrate that a PAC-based BCI can be implemented in a pseudo-online setup, although the decoding accuracy does not show significant improvement when compared to amplitude-based decoding.
2 Materials and methods 2.1 Data and participantThe dataset analyzed in this study was recorded as a part of the “BCI and Tetraplegia” clinical trial (ClinicalTrials.gov identifier: NCT02550522). The participant is a 28-years-old right-handed man with traumatic sensorimotor tetraplegia after a C4-C5 spinal cord injury (Benabid et al., 2019). He was implanted bilaterally above the left and right primary motor and sensory cortices with two WIMAGINE implants (Mestais et al., 2015), recording ECoG signal at a sampling rate of 586 Hz. Each implant consists of an 8 × 8 electrode grid, however due to the data transfer limit, only 32 electrodes organized on a checkerboard-like pattern were recorded on each implant, for a total of 64 electrodes. At the time of experiment, the subject was already experienced in BCI setup. Since his implantation, he gradually learned to use the BCI to control effectors with up to 8 degrees of freedom (Moly et al., 2022).
In this study, 32 experimental sessions recorded over more than 200 days were considered. In the experiments, the tetraplegic patient performed attempted movements in order to move a 3D virtual avatar. In particular, the patient used a strategy in which he repeatedly attempted fingers, hands, and arms movements to control an avatar in a virtual environment. Each session was composed of a series of successive tasks decided by the experimenter. Each task corresponded to one of the four possible movements (left or right hand 3D translation or left or right wrist 1D rotation) or an idle state. During idle state, no target was presented to the subject who had to remain in a non-active state until the next instruction. During active tasks, the patient attempted to switch into the correct state in a self-paced manner and then reach the target locations that were presented one after another. A new target was displayed by the experimenter when the subject had reached the previous one leading to unequal movement time for each target (average movement time for left and right hand translation trials : 22.2 ± 4.1s). Organization of the experiment is depicted in Figure 1.
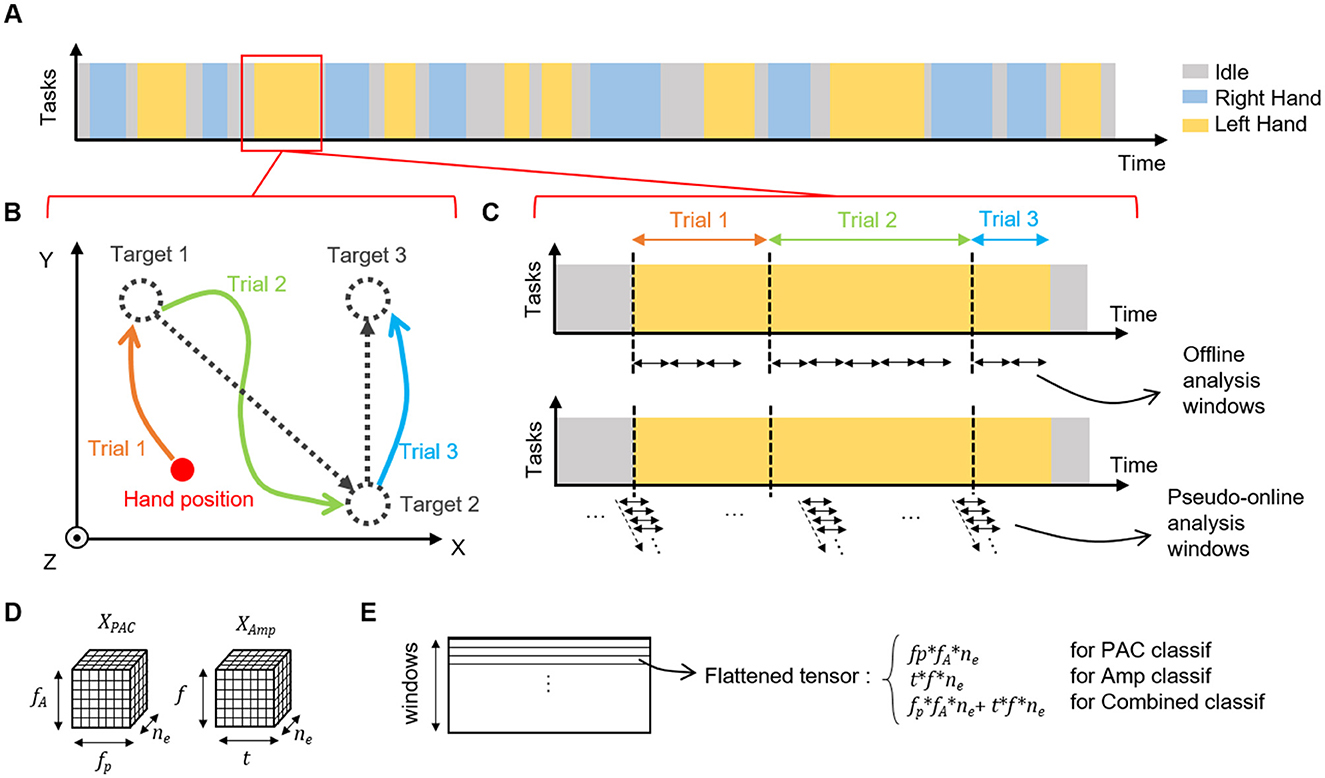
Figure 1. Experimental design. (A) Example of a session sequence of tasks. One session is composed of successive tasks of left hand, right hand or idle (wrist states that were not considered in this study are not represented). (B) Each active task (left or right hand) is composed of several trials in which the patient must reach the proposed targets in 3D. The cursor position is not reset between tasks, during task and during idle state. (C) Example of the timing of a task and organization of temporal windows for offline and online analysis. For offline analysis, non overlapping windows (1, 3, 5, 8, or 10 s) were used, and there was no window that overlapped between trials and/or tasks. In pseudo-online setup, 1 s windows with 90% of overlap were used allowing a 10 Hz prediction rate for the model. Windows were defined regardless of tasks or trials. (D) Shape of PAC and amplitude features tensors used in the offline and pseudo-online classifications. PAC tensor XPAC∈IR6×12×64, corresponding to the number of phase and amplitude bins in the PAC computation, and the number of electrodes. Ampltiude tensor XAmp∈IR10×15×64, corresponding to the number of time and frequency bins in the amplitude features extraction process, and the number of electrodes. One tensor is computed per time-window. (E) Before the classification process, tensors are flattened in row-major order into a one-dimensional vector. For classification based on combined features, flattened tensors of PAC and amplitude are concatenated.
During online experiments, a Recursive Exponentially Weighted Markov-Switching Multi-Linear model (REW-MLSM) decoder was used. This decoder was previously described in Moly et al. (2022). In a nutshell, it consists of a hierarchical decoding, where several predictions from different regression models are computed in parallel to provide a trajectory of hand movement or a wrist rotation angle. Regression outputs are then weighted by the output of a classifier based on a Hidden Markov Model (HMM) approach. The decoding model was trained online in closed-loop on the first four sessions, then the weights of the model were fixed and used to evaluate the performances on the remaining sessions. For the purpose of this study, calibration and test sessions were concatenated and only classification between 3 states was considered, idle (ID), left and right hand translations (respectively LH and RH). The final dataset was globally well balanced between tasks and consisted of around 18 h of experiment, comprising 11.3 min, 11.0 min, and 11.2 min per session on average for ID, LH and RH states, respectively.
2.2 Phase-amplitude coupling features extractionThe ECoG signal was mapped in the time-frequency domain by convolution with Morlet waveforms (Complex Continuous Wavelet Transform - CCWT). Central frequencies of the waveforms ranged from 5 to 30 Hz with a 2.5 Hz step (11 steps), as a range of interest for phase modulating frequencies (fp), and from 30 to 150 Hz with a 10 Hz step (13 steps), as a range of interest for amplitude modulated frequencies (fA), for all the electrodes (64 in total, 32 from left implant and 32 from right implant). The range of frequencies considered has been chosen to represent the theta, alpha, beta bands for the phase, and gamma for the amplitude to study all the possible couplings. The modulus (respectively, the argument) of the CCWT outputs represents the instantaneous amplitude (respectively, phase) information required to compute the PAC.
Several methods have been proposed in the literature to quantify PAC. These methods differ in their theoretical foundations, and it was shown that the modulation index (MI) (Tort et al., 2008) and the mean vector length (MVL) (Canolty et al., 2006; Okurt and Schnitzler, 2011) are the most suitable in terms of accuracy while keeping a good computational efficiency (Hlsemann et al., 2019; Tort et al., 2010). Here, we used both MI and MVL measurements to combine their respective strengths and weaknesses and compare their qualitative estimation of PAC in ECoG recordings.
MI quantifies the deviation of a phase-amplitude distribution from the uniform one using an adapted Kullback-Leibler (KL) distance (Tort et al., 2008, 2010). The phase-amplitude distribution P is calculated by binning phases from the modulating frequency range fp into a chosen number of bins (18 in Tort et al. (2008), kept in our study), and computing the normalized mean amplitude from the modulated frequency range fA for each bin:
P(j)=<AfA>ϕfp(j)∑k=1N<AfA>ϕfp(k),where AfA(t) and ϕfp(t) are the time series of the amplitudes and phases of the frequency ranges of interest, N the number of bins and < > denotes the mean over time. Then MI, ranging from 0 (no coupling) to 1 (strong coupling), is calculated as follows:
where:
DKL(P)=log(N)-H(P),H(P)=-∑j=1NP(j)log[P(j)]with H(p) being the Shannon entropy of the distribution P.
MVL is a more straightforward way of estimating PAC (Canolty et al., 2006) as it is not based on distributions, but is directly calculated from amplitude and phase time series AfA(t) and ϕfp(t). Given the time series of amplitudes and phases, MVL estimates the length of the mean vector of all the vectors in the polar plane represented by each complex number. If the magnitude of some of the vectors (amplitudes) is increased at a particular angle (phase), then the MVL has a non-zero value that represents the amount of PAC. To tackle one of the main drawbacks of MVL, which is its amplitude dependency, we computed the direct MVL proposed later by Okurt and Schnitzler (2011) with the following equation :
MVL=|∑t=1nAfA(t)ejϕfp(t)n|.It normalizes the MVL using the amplitude, which bounds its values between 0 and 1 and renders it less vulnerable to high frequency band power variations.
Given that the measurement of the PAC is highly dependent on the duration of the window over which it is calculated, particularly for short time windows (Dvorak and Fenton, 2014), the amplitude and phase time series of each trial (one target reaching) were segmented into non-overlapping time-windows of equal size before estimating the PAC (either MVL or MI). Part of trials that were shorter than window length were excluded from this analysis (Figure 1). Furthermore, to assess the influence of window length on classification accuracy, windows of 1, 3, 5, 8 and 10 sec were considered. For each window, a phase-amplitude comodulogram of MI or MVL values was obtained using the amplitudes from the fA bands AfA(t) and the phases from the fP bands ϕfp(t), for the whole window duration. PAC was computed for each frequency band pair in (fA, fp), using all the combinations of AfA(t) and ϕfp(t), as no preliminary assumption was drawn on the modulating and modulated frequencies. The same compute process was repeated for each electrode, leading to a PAC features tensor XPAC∈IR11×13×64 (11 bands for phase, 13 bands for amplitude, 64 channels) for each window (Figure 1).
2.3 Offline binary classificationTo assess whether PAC measurements contained information related to the patients individual mental tasks, we conducted three different binary classification tests based on PAC features: idle vs right hand (ID-RH), idle vs left hand (ID-LH) and right hand vs left hand (RH-LH).
The classification was performed with flattened (reshaped in row-major order into a one-dimensional vector) PAC features using two different classifiers: a Partial Least Square regression (PLS) with output variable encoding for classification and a Linear Discriminant Analysis (LDA). PLS was chosen because it is particularly suited for cases with high dimensional features space. In addition it is similar to the BCI classification we use in online settings. LDA was used as a more classical approach for classification, to validate the conclusion drawn from PLS.
PLS extracts a set of latent variables or components that capture the maximum covariance between the independent and dependent variables, and then, constructs a regression model by sequentially fitting these components to the data (Geladi and Kowalski, 1986). To use PLS for classification, the response variables were encoded as n×m binary matrix (m = 2 being the number of classes), with the desired class (i.e. ID, RH and LH) labeled as 1 and the other as 0. The regression output was then discretized by selecting the class with the maximum predicted value as the predicted class. This approach facilitated the modeling of the relationship between predictor variables and class labels. To find the optimal number of components to use in this PLS, other PLS classifications were conducted on a smaller dataset that was recorded before this experiment in which the subject was performing a similar but slightly different task. For this dataset, classification was repeated for each number of components from 1 to 15, and the performance metrics estimated with a 10-fold cross-validation scheme (i.e., mean squared error and percentage of explained variance) were averaged across the folds. The number of components was selected as the best tradeoff between minimal error and maximum explained variance, which led to 6 components in the initial PLS (see Supplementary Figure S1).
Linear Discriminant Analysis (LDA) is a classification and dimensionality reduction technique that projects data onto a space that maximizes class separability. It finds a linear combination of features that best distinguishes between classes by maximizing between-class variance and minimizing within-class variance (Tharwat et al., 2017).
The classification output performance of both classifiers was evaluated on a 5-fold stratified cross validation scheme with balanced accuracy to take into account potential class imbalances within sessions. Although the database is globally balanced, some sessions have individually a slight imbalance. Balanced accuracy was computed for each fold and average across folds, as follows:
balanced accuracy=12TPTP+FN+12TNTN+FP,with TP, FN, TN and TP respectively the number of true positives, false negatives, true negatives and false positives.
For each pair of tasks and classifier, the obtained balanced accuracies across sessions were statistically compared using two-way ANOVAs, with the first factor being the used PAC value (MI or MVL) and the second factor the length of the time-window (from 1 to 10 seconds). Since the distributions of the residuals were not normal, ANOVAs were performed after a rank-transformation procedure on balanced accuracies.
2.4 Features analysisTo evaluate the importance of the features in the classification process of the PLS, in which components are obtained as linear combinations of the original variables, the VIP (Variable Influence on the Projection) score of each feature was computed. VIP score measures the importance of each variable in explaining the variance of the response variable (Y) in the PLS model. The VIP computation is based on the PLS weights, weighted by how much of the responses are explained by each PLS component:
VIPk=K·∑a=1Awak2SSYaA·SSYtotal.where K is the number of original predictors, A the number of PLS components, wak is the weight of the kth feature in the ath component, SSYa the amount of sum of squares of Y explained by the ath component and SSYtotal the amount of sum of squares of Y explained by all components (Wold et al., 1993). Variables with VIP scores greater than 1 are typically considered important.
The VIP score was used to study the features from a spectral and spatial point of view. First, the importance of different frequencies and frequency-couples in the classification was assessed by the number of occurrences of a VIP score greater than 1. Then, for the most represented frequency pair, we depicted the mean VIP score over each electrode of the implant to analyze the localization of the features of importance.
Features of importance analysis was only performed for PLS-based classification as it output better classification results than LDA, then should provide more accurate insights on spectral and spatial contributions.
2.5 Shared variance between gamma amplitude and PACTo assess on which extent information provided by PAC was independent from the information contained in amplitude of gamma time series, we estimated the portion of variance of gamma amplitude that can be explained by MVL. To do so, for each window on which MVL was calculated, values of gamma amplitude were extracted by averaging AfA(t) time series over window duration. This led to a tensor of gamma amplitude Xγ∈IR13×64 (13 bands, 64 electrodes). Then, for each session, each band and each electrode, a linear model was fitted between gamma amplitude and PAC estimated by MVL method, which was averaged over all phase frequency bands. For each model, the coefficient of determination R2 was assessed as the proportion of the total sum of squares explained by the model.
2.6 Pseudo-online classificationPrevious offline method using non overlapping and long windows is inapplicable in an online asynchronous BCI. Then, to assess if PAC features could be used in online asynchronous BCI settings, classification was also performed in a pseudo-online manner. PAC features were computed in the same way as the previous binary-classification approach, obtaining the time series AfA and ϕfP in the frequency bands of interest. However, instead of considering windows containing only data from the same trial and task, PAC features XPAC∈IR11×13×64 (11 bands for phase, 13 bands for frequency, 64 channels) were computed every 0.1 s, based on the last second of signal (sliding window with 0.9 s overlap), simulating an online feature computation at the rate of 10 Hz.
Similar to online experiments, Hidden Markov Models (HMM) combining emission and transition probabilities were trained and used for 3-class classification (ID, RH, LH) in a pseudo-online setup (Moly et al., 2022). Emission probability was computed using Recursive Exponentially Weighted N-way Partial Least Squares Regression (REW-NPLS) with one-hot encoded class labels, post-processed by softmax function. REW-NPLS is a variant of PLS for tensor features and compatible with recursive online updates (Eliseyev et al., 2017). The transition probability matrix was estimated by counting the number of transitions in the training set. The class prior was established to ensure equal probability distribution among classes.
To assess if PAC features add information to the amplitude features generally used, the 3-class pseudo-online classification task was performed based on PAC features only, on amplitude features only and on the combination of PAC and amplitude features concatenated in the same tensor. For amplitude features the same CCWT as for PAC features computation was used to map the ECoG signal in the time-frequency domain, with central frequencies ranging from 10 to 150 Hz (10 Hz step, 15 bands). Features were then defined as 10 points description of 1-s windows of the amplitude time series (averaging over 0.1 s fragments) with 0.9 s overlap, leading to an amplitude features tensor XAmp∈IR10×15×64 (10 time points, 15 bands, 64 channels) for each window. Note that these are the same features that were used during the online experiments (Moly et al., 2022). To combine PAC and amplitude features in the same classification, tensors were flattened and concatenated over time and frequency dimensions resulting in a combined features tensor XBoth∈IR222×64.
As the MVL method showed better performances than the MI in offline binary classifications, only the MVL was used to compute PAC features for the pseudo-online setup. Models were retrained on the first six sessions, which allows to reach 85% of the maximum achievable performances, defined as a REW-MLSM decoder trained on all sessions (Śliwowski et al., 2023).
The obtained models were then tested on every other sessions and balanced accuracy was calculated. For each class, accuracy (one-vs.-all), recall, precision and specificity were also assessed as follows:
accuracy=TP+TNTP+TN+FP+FN,recall=TPTP+FN,precision=TPTP+FP,specificity=TNTN+FP.Chance levels were estimated by computing the same metrics 100 times with random permutations of the real label vector, then averaging the results across repetitions.
Weights of the amplitude and PAC models were were also analyzed to determine whether classifications were based on the same spatial patterns and frequency bands. To do so, model regression tensors were summed over all dimensions except the dimension of interest.
All the analysis were performed with Matlab R2024a. In the offline classifications, the MI and MVL indices were computed with the original codes proposed by the respective authors (Tort et al., 2010; Okurt and Schnitzler, 2011). In the pseudo-online classification, the MVL computation was performed in a tensor-based way adapted from Tensorpac (Combrisson et al., 2020).
3 Results 3.1 Offline binary classifications: performancesWe tested MI and MVL features in three classification tasks (ID-RH, ID-LH, RH-LH) with two different classifiers and several time windows. Although both features sets performed above chance (33% in balanced accuracy), MVL demonstrated significantly higher performances regardless of the classification task, the classifier used and the length of the time window (p < 0.001—Figure 2A). Regarding the influence of the time window, a significant loss of performance was observed as the window length decreases, more prominent when using LDA as a classifier as opposed to PLS (p < 0.001 both for PLS and LDA). The higher accuracy was reached for 10 s-windows with 92.9 ± 0.7% (mean ± sem), 88.7 ± 1.2% and 95.3 ± 0.7% respectively for ID-RH, and RH-LH classifications using PLS and 94.6 ± 0.6%, 91.9 ± 1.0% and 97.9 ± 0.4% respectively for ID-RH, for ID-RH, ID-LH and RH-LH classifications using LDA. This accuracy dropped to 83.6 ± 0.7%, 80.5 ± 0.7% and 88.2 ± 0.6% respectively for ID-RH, ID-LH and RH-LH classifications using PLS and 73.6 ± 0.6%, 72.0 ± 0.7% and 77.3 ± 0.6% respectively for ID-RH, ID-LH and RH-LH classifications using LDA, when window length was reduced to 1 s.
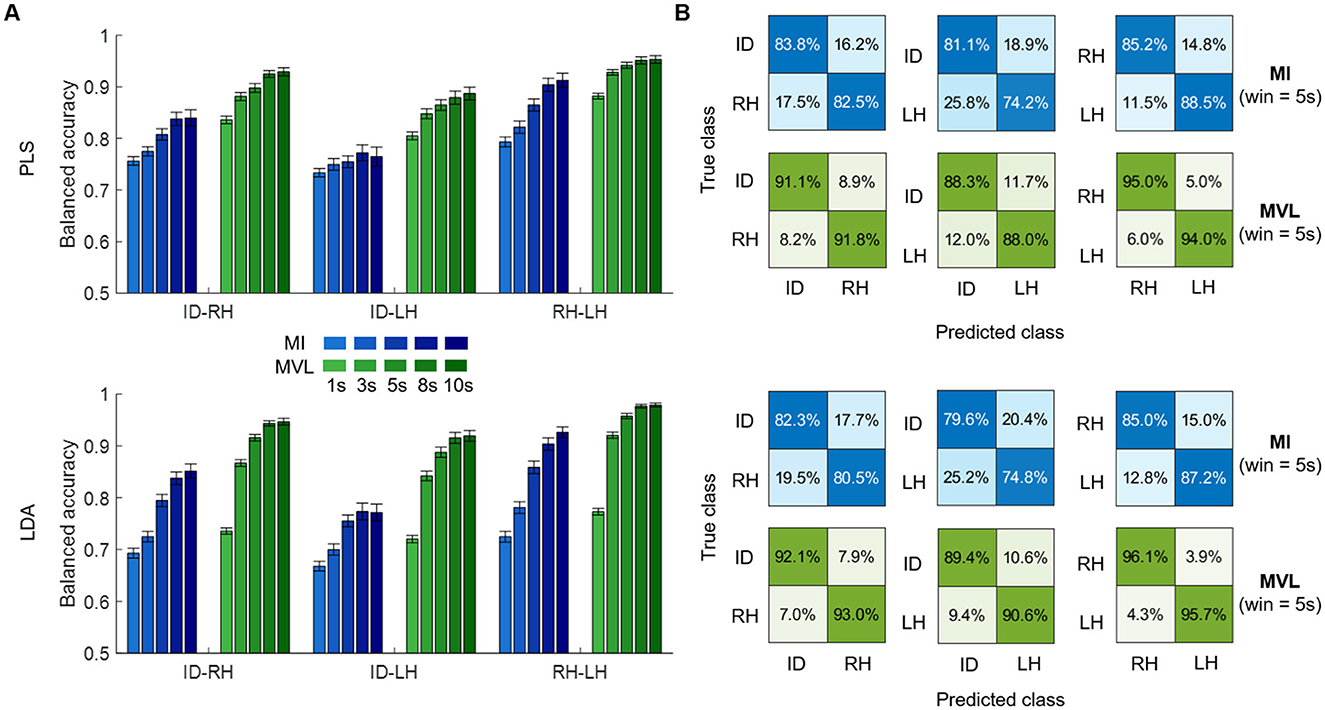
Figure 2. Binary classification results. (A) Average balanced accuracy of PLS (top) and LDA (bottom) using MI (blue) or MVL (green) features computed on different time windows lengths (shaded) for three different tasks: idle vs. right hand (ID-RH), idle vs. left hand (ID-LH) and right vs. left hand (RH-LH). (B) Confusion matrices (row normalized) depicting results of the 5s window length case.
These results illustrate that MVL features are more efficient for classifying ECoG motor tasks on a span of a few seconds, as also illustrated by the average row-normalized confusion matrices for a 5s window (Figure 2B).
3.2 Offline binary classifications : features' importanceTo assess the impact of different features components on classification performance, we conducted VIP score analysis, both on spectral and spatial perspectives. Since results were similar across window lengths, only those with a 5 s window are presented here.
For all the classifications, the gamma band (30–80 Hz) was the most modulated amplitude while the phase frequencies were all represented in the PLS weights. However, looking at the most represented couples highlighted different pattern of contributing frequencies in the distinction of idle vs. hand and hand vs. hand tasks (Figure 3A). In the ID-RH and ID-LH classifications, the most contributing phase-amplitude couplings were the modulation of the amplitude of the 30–40 Hz low-gamma band by the whole range of frequency bands for phase (5–30 Hz) (e.g., 43.0 ± 0.8 and 45.7 ± 0.9 occurrences of the 15–30 Hz PAC for ID-RH and ID-LH respectively). This coupling, which was maximal at 15 Hz and below, was also present in RH-LH classification (45.0 ± 0.9 occurrences of the 15–30 Hz PAC), however a pattern of beta/high-gamma coupling also figured in the comodulogram with the modulation of the 70 Hz amplitude by the 15 -30 Hz phase (e.g. 40.8 ± 1.1 occurrences of the 20 Hz–70 Hz PAC).
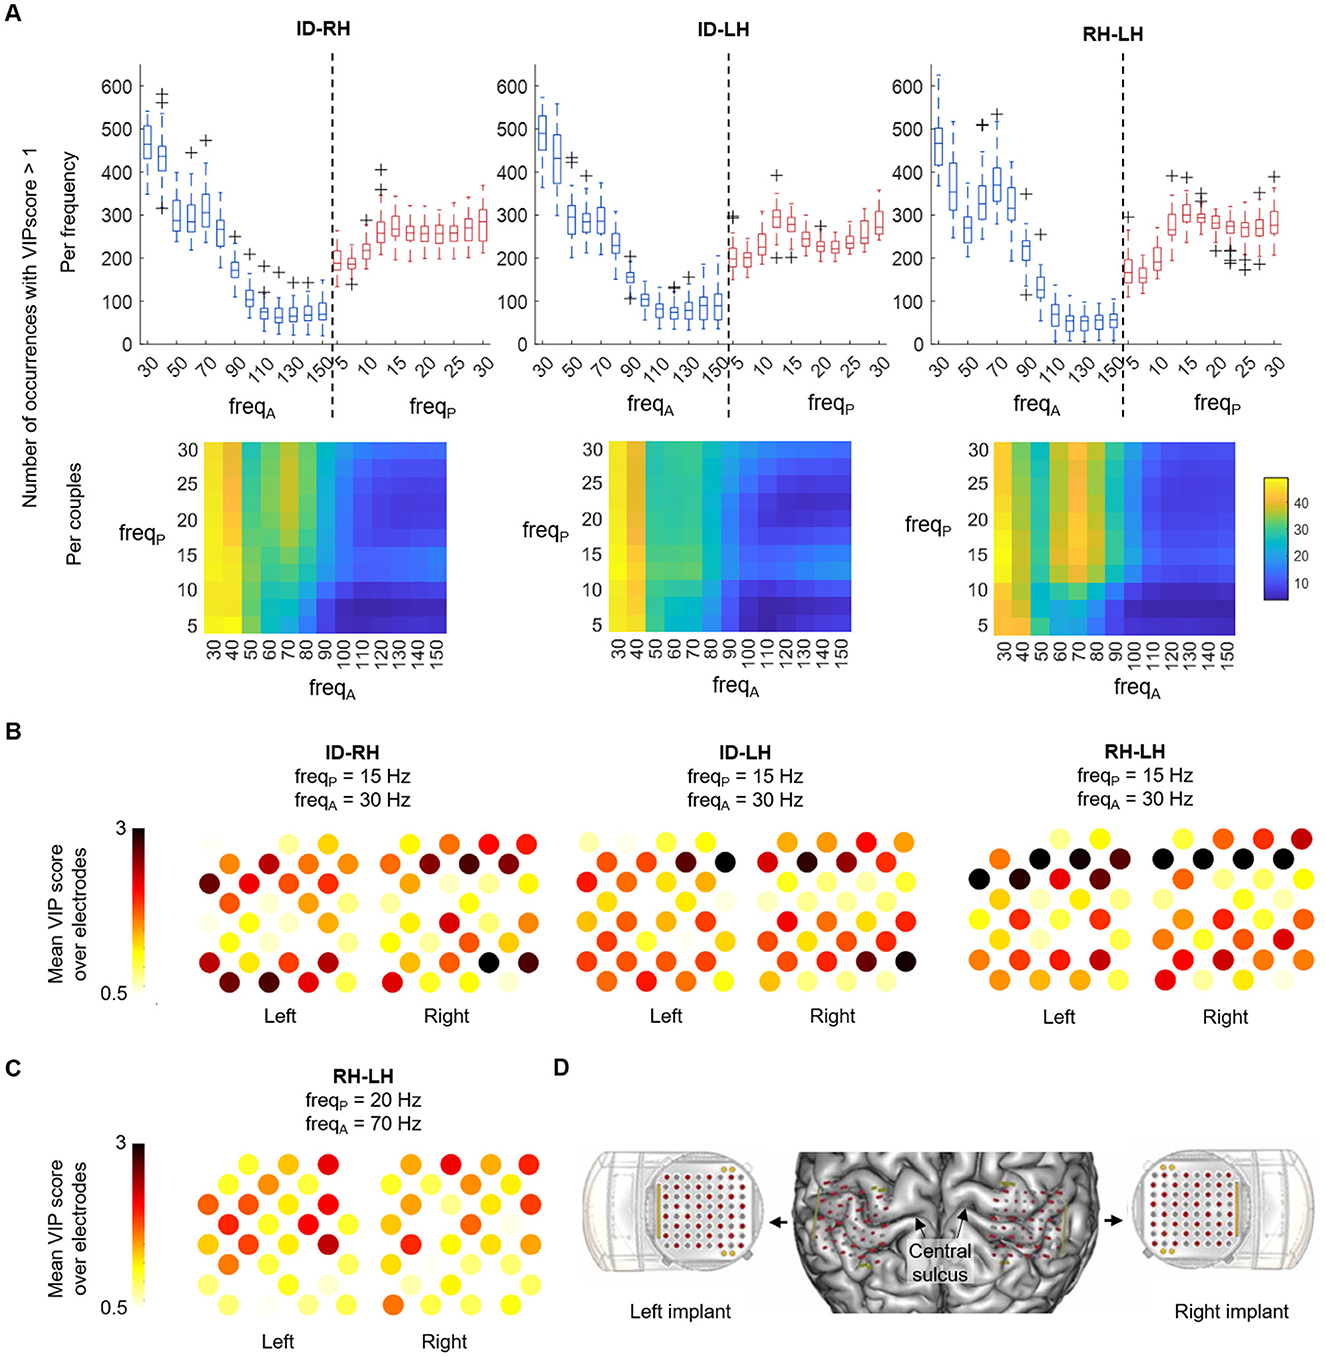
Figure 3. PAC spectral and spatial features analysis, with a 5 s window. (A) Top: boxplot of the number of occurrences of the different frequencies with a VIP score > 1. On each box, the central mark indicates the median of occurrences of amplitude (blue) and phase (red) frequencies of interest in the features; the bottom and top edges of the box indicate the 25th and 75th percentiles, respectively. Bottom: occurrences are shown by amplitude-phase frequencies couples. (B) Average VIP scores of each WIMAGINE implant electrode following their anatomical distribution for the three classification scenarios for the 15-30 Hz phase-amplitude couple. (C) Average VIP scores of each WIMAGINE implant electrode following their anatomical distribution for the RH-LH case, for the 20–70 Hz couple. (D) Anatomical localization of the implants and the electrodes on the brain surface reconstruction of the subject.
Figures 3B, C show the anatomical spatial distribution on the left and right implants of electrodes of importance, based on their average VIP scores. The VIP scores are shown for the influential amplitude-phase frequency couples found in the previous analysis for the different classification cases (15–30 Hz for ID-RH, ID-LH and RH-LH in Figure 3B and 20–70 Hz for RH-LH in Figure 3C). For the 15–30 Hz coupling, the pattern of contributing electrodes was similar across the classification tasks with contribution of large clusters of electrodes, in particular on the anterior and posterior parts of the implants (mean VIP score, all electrodes, ID-RH: 1.38 ± 0.51 and 1.42 ± 0.54; ID-LH: 1.41 ± 0.45 and 1.55 ± 0.48; RH-LH: 1.48 ± 0.62 and 1.58 ± 0.72 for left and right implants respectively). Regarding the 20–70 Hz coupling present int the RH-LH case, it can be observed that contributing electrodes are less clustered, with information extracted from few individual electrodes (mean VIP score, all electrodes, left implant: 1.20 ± 0.40, right implant: 1.19 ± 0.32). Figure 3D provides the anatomical localization of the implants on the subject's cortex.
3.3 Shared variance between PAC and gamma amplitudeSince PAC can be used to decode motor states, like gamma amplitude (Branco et al., 2017), we may ask whether the information carried by these two markers is identical, distinct, or overlapping. To assess the extent to which these two pieces of information overlap, we conducted a regression analysis. Figure 4 shows the coefficient of determination (portion of shared variance) between PAC and gamma amplitude across the electrodes for different frequency bands, using a time window of 5 s. On average across frequencies, PAC accounted for 6 to 31% of gamma amplitude variance for the different electrodes (Figure 4A). The portion of shared variance was maximal at 70 Hz, ranging from 9 to 50% across the implant (Figure 4B), and minimal at 30 Hz ranging from 0 to 12% (Figure 4C).
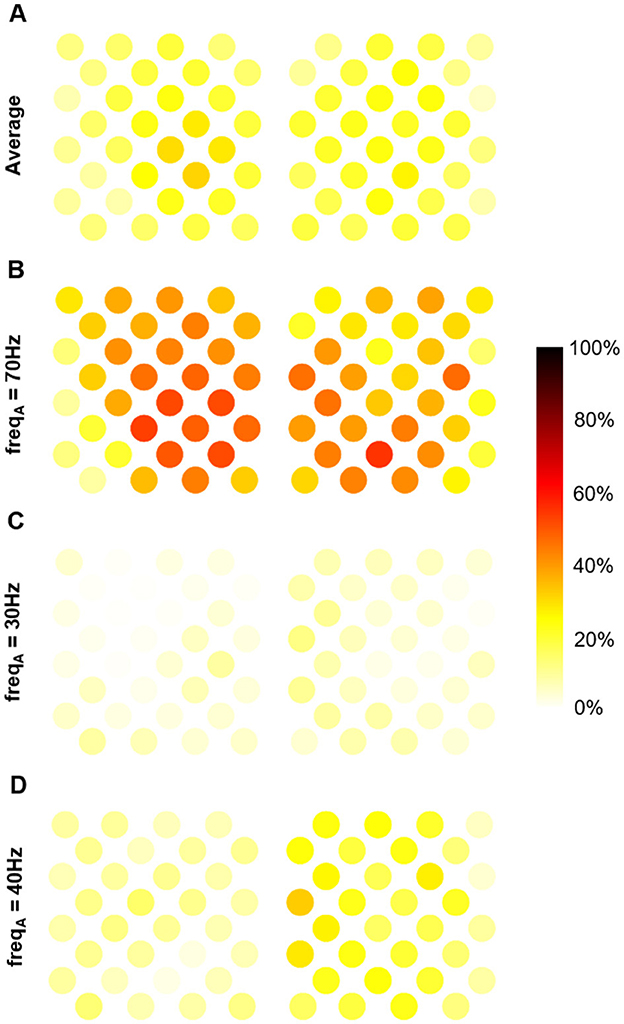
Figure 4. Portion of shared variance between MVL-based PAC and gamma amplitude averaged over time window (with a 5s time-window). (A) Average over frequencies. (B) At 70 Hz (maximal shared variance). (C) At 30 Hz (minimal shared variance). (D) At 40 hz.
3.4 Pseudo-online classification resultsLastly, we tested the PAC features performances in a pseudo-online setting (Figure 5), to compare their classifying power with the amplitude-only features. Classifications were performed using PAC features, amplitude features and the combination of PAC and amplitude features to test if information provided by PAC is different from that provided by amplitude. While PAC features showed a good classification power, amplitude features performed better (balanced accuracy by session) and combined features classification was not significantly different than amplitude-based (balanced accuracy by session 91.4% ± 4.0%, 82.9% ± 6.4% and 89.7% ± 4.3% for amplitude, PAC and combined features respectively). Interestingly, the confusion matrices (Figure 5A) reveal that misclassifications primarily occur when motor states (LH and RH) are incorrectly identified as idle. Thus, regarding precision and specificity, PAC features performed almost as well as amplitude-based features for right and left hands states, but with a lower recall. Regarding idle state precision/specificity and recall were lower with PAC features. Although combined features decoding did not outperform amplitude-based decoding, weights of the amplitude and PAC models indicates that decoding was based on overlapped but different frequency bands. The most contributing frequency band was centered on 20 Hz for amplitude decoding and on 40 Hz for PAC. Regarding spatial patterns, PAC decoding was based on more localized areas than amplitude decoding.
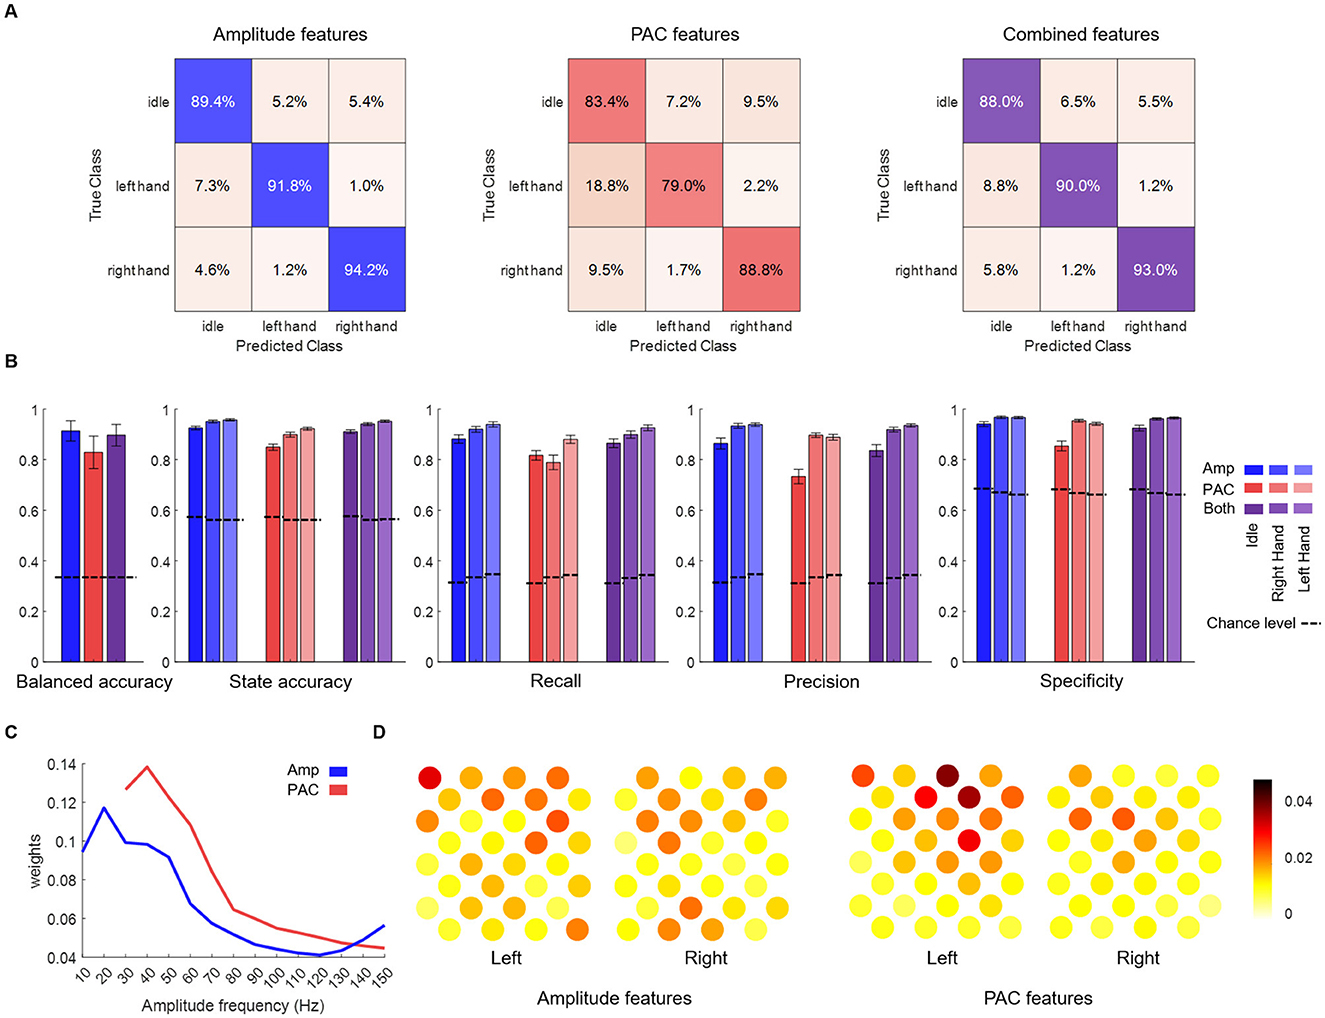
Figure 5. Pseudo online classification results.(A) Confusion matrices (row normalized) using the different input features. (B) Average balanced accuracy, accuracy (one vs. rest), recall, precision and specificity. Except for balanced accuracy, metrics were calculated per state. Performances of the pseudo-online classification are shown for amplitude (blue), PAC (red) or both (purple) features on the three states classification. States are shown in different shades. (C) Amplitude (blue) and PAC (red) models weights across amplitude frequency bands (weight tensors summed over time steps and electrodes for amplitude and over phase frequency bands and electrodes for PAC). (D) Amplitude and PAC models weights across electrodes (weight tensors summed over time steps and frequency bands for amplitude and over phase and amplitude frequency bands for PAC).
4 DiscussionThe findings presented above advance empirical evidence of the discriminative power of phase-amplitude coupling measurements in neural oscillations to classify motor attempts of different movements. On one hand, we demonstrated that PAC enables offline classification of a motor attempt vs. rest, or between two different motor attempts, with high accuracy. However, this accuracy deteriorates as the length of the time window used for PAC computation decreases. On the other hand, we demonstrated that a PAC-based pseudo-online BCI operates effectively, although it is less efficient than amplitude-based decoding.
4.1 PAC features are able to decode motor attempts with high accuraciesThe high classification accuracies achieved using PAC features derived from Mean Vector Length (MVL) in the offline approach highlights its efficacy in distinguishing motor attempts. This is in line with previous studies (Combrisson et al., 2017; Yanagisawa et al., 2012) that highlighted the capability of PAC features to discriminate different motor states and intentions, and demonstrates that PAC can effectively differentiate attempted motor tasks in ECoG. Although Modulation Index (MI), which also quantifies phase-amplitude coupling allowed to classify left and right hands and hand vs. idle, it showed significantly lower performances. This contrasts with previous research that showed the robustness of MI (Canolty et al., 2006; Tort et al., 2010) and suggest that MI is less suited for ECoG-BCI applications. This might be due to the fact that MVL is more sensitive to modulation strength high signal-to-noise ratio conditions (Hlsemann et al., 2019), which is the case with ECoG recordings as opposed to EEG.
The supervised machine learning framework based on PLS method also allowed to determine which PAC features (phase-amplitude couples and electrodes) contributed the most to the discrimination between the different states and motor tasks, as evaluated by features VIP scores. Furthermore, regression analysis showed that, although a portion of variance was shared between PAC and amplitude of gamma oscillations, they also carried out different information. In particular, while coupling with low-gamma amplitude was the major contributor discriminating motor and idle states, there was almost no shared variance between PAC and gamma amplitude in this frequency band. This suggests that classification framework was able to extract PAC information that was not present in gamma amplitude alone. In the contrary, at 70 Hz an important part of the variance was shared between PAC and gamma amplitude, although the distribution over the implant was different. Thus, classifier seems to have extracted information that is specific to PAC measure. Moreover, one should note that a part of the shared variance can be explained by the fact both measures correlated to the task (motor attempts). This does not necessarily mean that both measures encompass the same information.
4.2 Coupling with low-gamma amplitude discriminates motor and idle statesIn all the binary classification evaluated, whether between idle and motor states (ID-RH, ID-LH), or motor and motor states (RH-LH), the coupling of the whole range of frequencies with low-gamma band contributed to the discrimination between states. It includes theta/low-gamma, alpha/low-gamma and to a lesser extent beta/low-gamma couplings. The spatial contributions were similar across classification tasks, and did not reveal a clear contralateral pattern when distinguishing idle from motor states, as it might have been expected. Instead, the coupling was visible widely over both implants. However, this coupling was also present in discriminating left from right motor states, indicating that the spatial pattern is nevertheless task-dependent.
Theta/gamma coupling, where the phase of theta oscillations drives the amplitude of the gamma oscillations is thought to be a neural code that reflects the coordination of the communication between brain regions (Lisman and Jensen, 2013). It has recently gained interest in cognitive neuroscience and has been observed across a wide variety of paradigms, in particular in tasks involving memory processes (Mormann et al., 2005; Sauseng et al., 2009; Axmacher et al., 2010) but also in sensorimotor tasks (Canolty et al., 2006). Thus, although brain activity of the patient was only recorded over the sensorimotor cortex, it is likely that the theta/gamma coupling we observed indicates large-scale integration and/or transmission of information from/to other brain areas involved in motor process. This can explain the wide spatial distribution of the contributing electrodes in the classifications, as well as the implication of both motor and sensorimotor cortices in the process. Low-gamma power has also been shown to be phase-locked to alpha oscillations, during resting spontaneous brain activity (Osipova et al., 2008). This phenomenon could also have contributed to the distinction between states.
During movement and motor attempts, theta and alpha activity, typically ranging from 4-8 Hz and 8-12 Hz, is particularly notable in the frontal and motor areas of the brain, where it is thought to play a role in motor planning and execution, enhancing the integration of sensory and motor information necessary for movement (Horschig et al., 2015; Brauns et al., 2014). In particular, studies have shown that theta rhythms are involved in the coordination of motor tasks, with increased event-locked theta activity observed in the following milliseconds (aroud 500 ms) after cues are presented to the subject - either motor preparation or motor execution cues (Pellegrino et al., 2018; Struber et al., 2021). This burst of activity then decreases during motor execution, as well as the theta/gamma coupling which has been shown to be accurately time-locked to the theta band activity evolution (Canolty et al., 2006). Alpha activity which is suppressed during movement, is also phase-locked to motor or execution cues and coupled with gamma band power albeit in a lesser extent (Canolty et al., 2006; Struber et al., 2021).
It is probable that our classifiers detected these brief time-locked changes in theta/gamma coupling as the patient was planning and imagining several movements in a row during the motor states periods. This could partly explain why th
Comments (0)