
Remember me


This is a retrospective study conducted at Cincinnati Children's Hospital Medical Center, a tertiary, academic pediatric center. The study protocol was approved by the institutional review board with a waiver of documentation of written informed consent. All study activities were compliant with the Health Insurance Portability and Accountability Act.
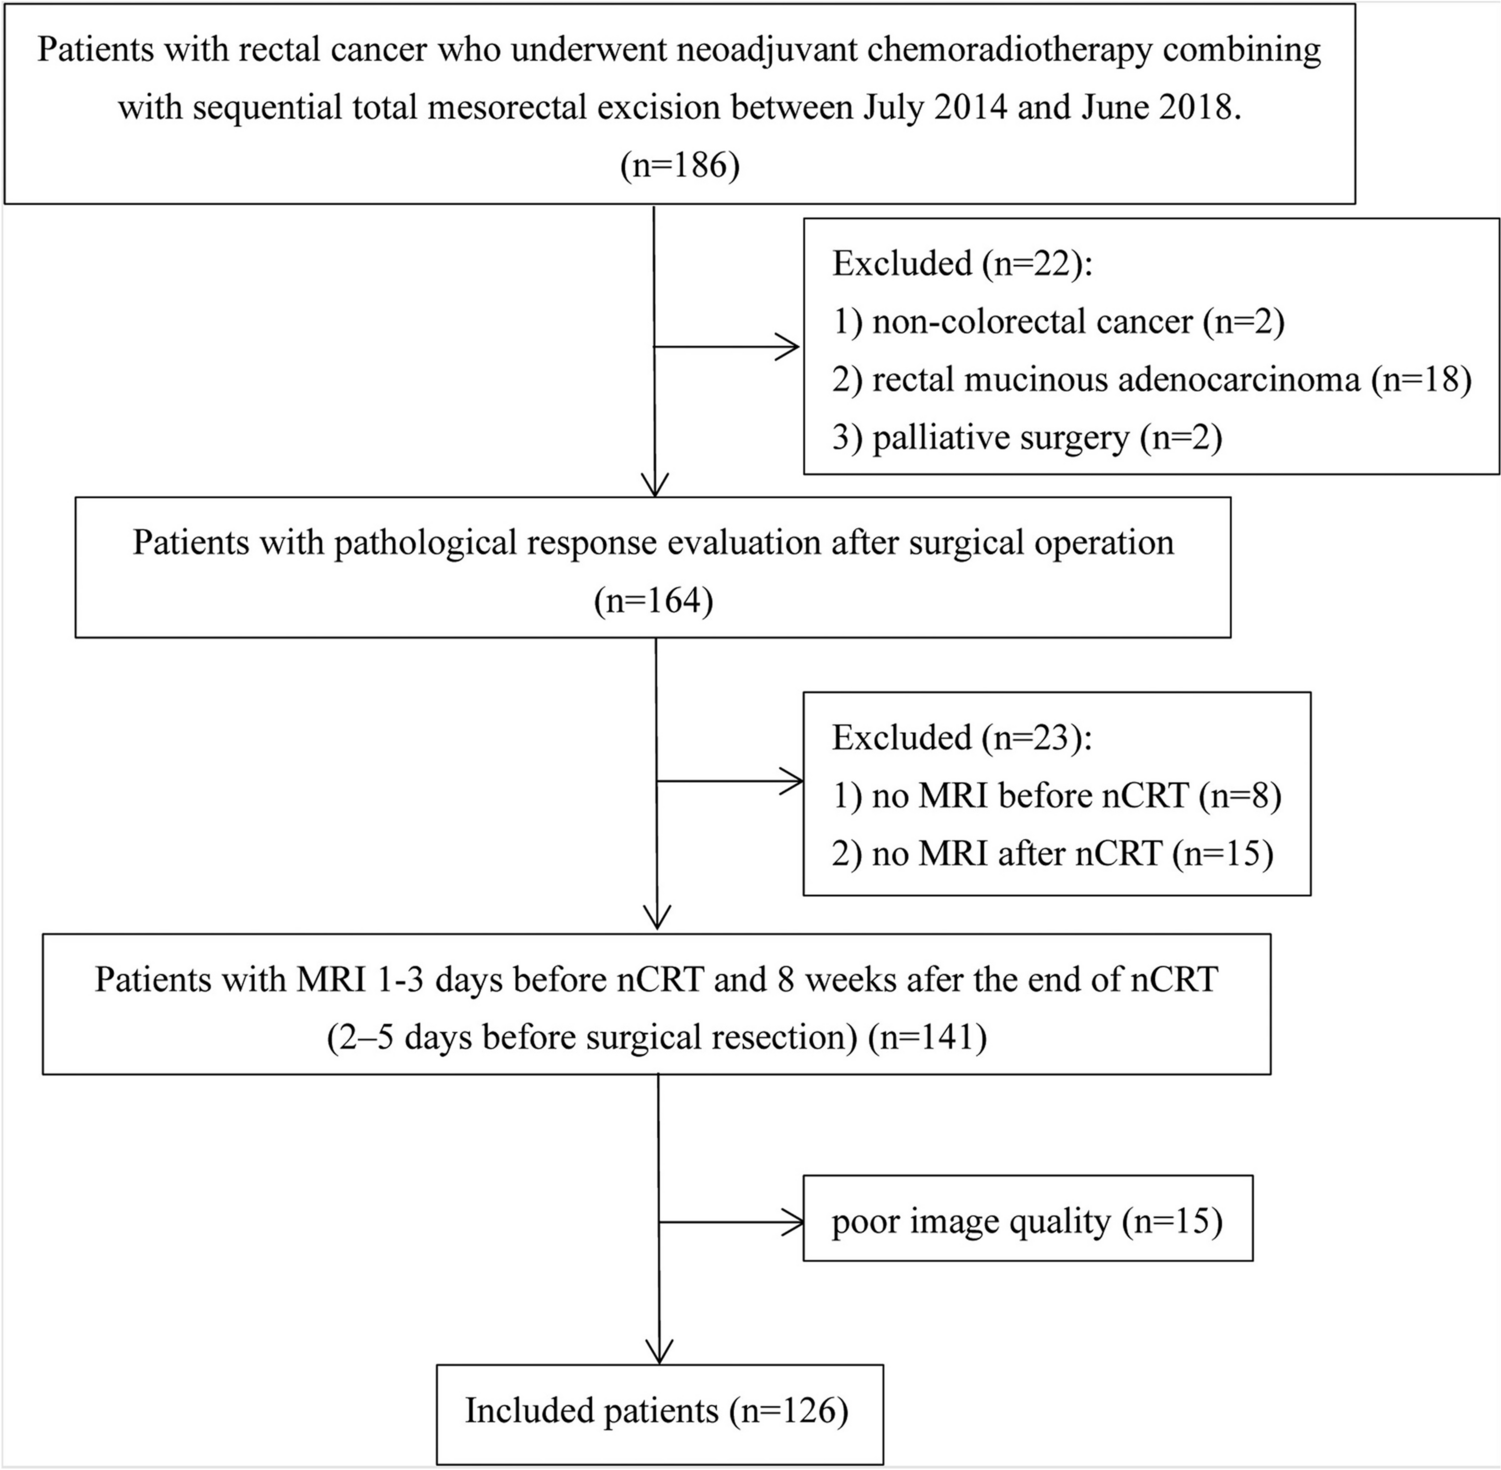
At our institution, clinically performed MR cholangiopancreatography (MRCP) examinations routinely include acquisition of T1 mapping data. A research fellow (P.D.) used an imaging report search engine (Illuminate InSight v4.3, Softek Illuminate) to identify patients who had undergone a clinically indicated MRCP examination between January 1, 2020, and August 31, 2023. Because of potential technical differences in implementation of T1 mapping, we limited inclusion to examinations performed on Philips MRI scanners. We then excluded patients who were 18 years of age or older on the day of their MRCP examination. Among the remaining patients, we sub-categorized our patient sample into those scanned on 1.5 T versus 3 T scanners. Finally, to ensure a relatively even distribution of ages, we limited the number of included examinations with a visible and measurable pancreas per year of age to 12 for the 1.5 T scanner and 6 per year of age on the 3 T scanner based on selection of consecutive examinations. The patient selection process is summarized in Fig. 1.
Fig. 1
Flow diagram shows study sample selection
MRI examinationsAll included clinical MRI examinations had been performed on one of the following three MRI scanner platforms: Philips Ingenia 1.5 T, Philips Ingenia 3 T, and Philips Ambition 1.5 T (Philips Healthcare, Best, The Netherlands). Routine T1 mapping as part of clinical MRCP examination protocols at our institution is accomplished using an Electrocardiogram (ECG)-triggered two-dimensional Modified Look-Locker Inversion Recovery (MOLLI) sequence implemented as a (5 s(3 s)3 s) scheme using a balanced steady state free precession (bSSFP). An MRI system simulated ECG signal of 60 beats per minute was used to trigger the acquisition. Four axial slices, positioned to cover the pancreas, and thus also including portions of the liver and spleen, were acquired as one slice per 11 s end-expiration breath hold. Sequence parameters were as follows: TR, 3.2 ms; TE, 1.32 ms; 16 TIs at 122, 347, 572,797, 1022, 1247, 1472, 1697, 1922, 2147, 2372, 2597, 2822,3047, 3272, and 3497 ms; flip angle, 8 degrees; FOV, 380 × 309 mm2; matrix, 192 × 125; slice thickness, 5 mm; acquisition time, 11 s/slice location.
T1 relaxation parametric maps, with 95% confidence maps overlaid, were generated immediately on the scanner console using the vendor’s product software and then exported to the picture archiving and communication system (PACS) (Merge PACS, version 7.2.0.157991, Merge Healthcare). The T1 estimation was based on a single compartment model, i.e., assuming that the signal evolution within a given voxel is described by a single T1 relaxation time.
Clinical MRCP examinations also included the routine acquisition of proton density fat fraction (PDFF) images. These images are acquired using the Philips product three dimensional mDixon Quant® sequence over an independent single breath hold (of ~ 5–13 s duration). As with the T1 parametric maps, the PDFF parametric maps were generated immediately on the scanner console using the vendor’s product software. However, unlike for the T1 parametric maps, the vendor software does not generate 95% confidence maps overlays for the PDFF parametric maps. Once generated, the PDFF parametric maps were exported to the PACS.
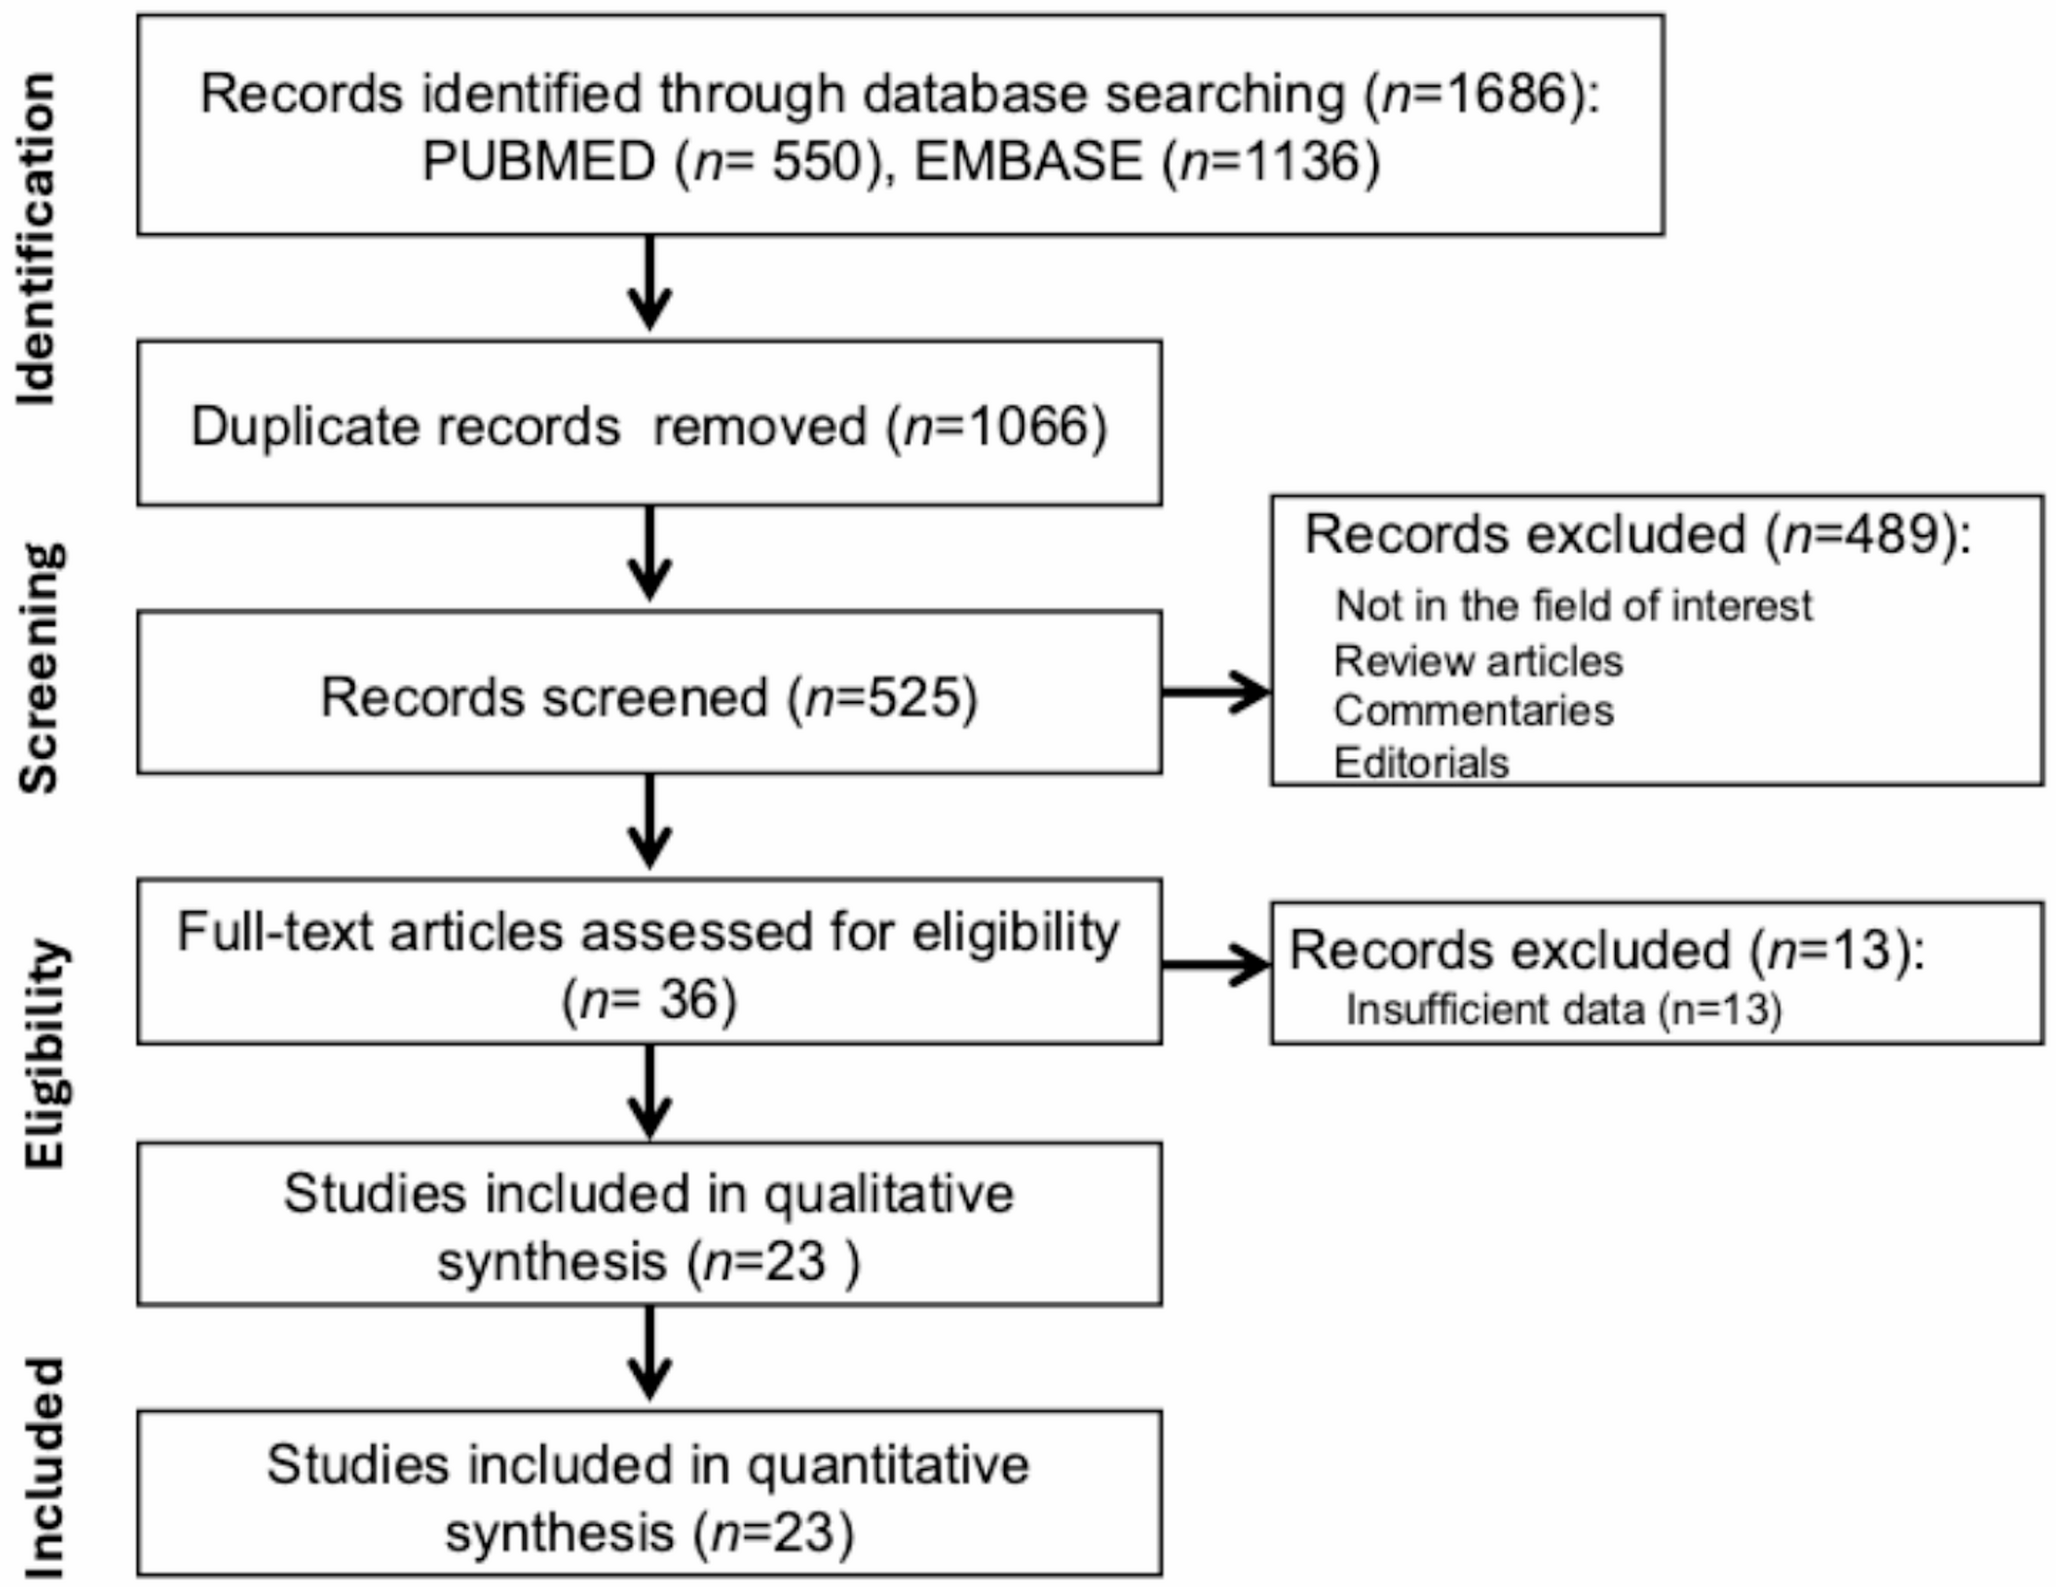
Image analysisThe same research fellow (P.D.) used a vendor-neutral post-processing platform (IntelliSpace, Philips Healthcare) to record T1 estimates for the liver, pancreas and spleen. Freehand regions of interest (ROIs) were drawn on the T1 parametric maps to include as much of the relevant organ as possible and excluding all lesions, large vessels and areas of artifact while staying within the 95% confidence maps (Fig. 2). For each patient, a maximum of three ROIs were drawn for liver and a maximum of three ROIs were drawn for the spleen. Each of the three ROIs were drawn on images acquired at different slice locations. For the pancreas, due to the relatively smaller areas and appreciable spatial heterogeneity of the acceptable 95% confidence regions, a maximum of eight ROIs were drawn, with more than one ROI drawn on images acquired at the same slice location as necessary to maximize measurement area.
Fig. 2
Six images (A–F) from a T1 parametric map acquired at 1.5 T in a healthy (no disease) 14-year-old girl. Regions of interest are drawn in the liver, pancreas and spleen. Regions of interest were drawn to be as large as possible while avoiding large vessels, any lesion, and areas of low-confidence data defined by scanner-generated confidence maps
Liver PDFF was measured by the same research fellow by drawing a separate smoothed contour ROI in the right hepatic lobe on the scanner generated PDFF parametric map. A PDFF greater than 5% was considered to reflect steatosis.
All ROIs were reviewed by a board-certified pediatric radiologist with more than 10 years of post-fellowship experience (A.T.T.). Once confirmed, T1 relaxation time estimates were reported as a mean weighted by their respective ROI areas calculated as:
$$Mean\ T1\ relaxation\ time = \frac_\ *\ _\right)} +\dots +\frac_\ *\ _\right)}$$
Medical record reviewFor all included patients, electronic health records (Epic; Verona, WI) were reviewed to record demographics, anthropometric data, and any relevant health conditions (involving the liver, spleen, pancreas, inflammatory bowel disease). Additionally, relevant laboratory values were recorded which included alanine aminotransferase, aspartate aminotransferase, alkaline phosphatase, gamma-glutamyl transferase, amylase and lipase within 24 h of imaging date. The radiology reports were also reviewed to identify the indications and imaging findings relevant to the liver, pancreas (including acute pancreatitis and chronic pancreatitis), and spleen.
Patient groupingPatient subgroups were defined based on review of imaging reports, electronic medical records and laboratory values. Grouping strategies are summarized in Fig. 3. Acute pancreatitis was defined by meeting at least two of three International Study Group of Pediatric Pancreatitis (INSPPIRE) diagnostic criteria (imaging findings, lipase ≥ 3 × the upper limit, or abdominal pain) [16]. Chronic pancreatitis was defined also based on the INSPPIRE criteria which included imaging findings (ductal and/or parenchymal changes) plus one of the following: abdominal pain in the pancreatic region, pancreatic exocrine insufficiency or pancreatic endocrine insufficiency [16]. The no pancreas pathology group included patients with no evidence of pancreatic disease but with abnormalities of the liver or spleen distinguishing this group from the no disease group who had no evidence of disease in the pancreas, liver, or spleen. Liver and spleen pathology was identified from imaging findings, medical record problem lists and laboratory values. Liver groupings included five or three groups (Fig. 3) with the 3-group scheme based on creating a combined no disease group including: Isolated biliary dilation/prominence, no liver pathology (but pancreas or liver pathology), no disease. Spleen grouping consisted of spleen pathology (e.g., splenomegaly, acquired aspenia), no spleen pathology (but liver or pancreas pathology) and no disease. Based on patient grouping, scatterplots were created to visualize the distribution of T1 relaxation time estimates by organ. Outliers in each group were reviewed by the same board-certified pediatric radiologist (A.T.T.), who was blinded at the time to group assignment, to confirm the quality of images, and to assess for imaging findings not included in the original report. Outliers were defined as follows: Pancreas: no disease or no pancreas pathology with T1 relaxation time greater than 800 ms (1.5 T) or 850 ms (3 T) and any case with pancreatitis (acute or chronic or both) with T1 relaxation time less than 600 ms (1.5 T) or 750 ms (3 T); Liver: no disease or no liver pathology with T1 time greater than 700 ms (1.5 T) or 900 ms (3 T) and any case with liver disease with T1 relaxation time less than 600 ms (1.5 T) or 850 ms (3 T). After review, outliers were annotated with an explanation if identifiable (e.g., excess iron or fat deposition) or patient grouping was changed if previously unidentified pathology was identified (e.g. segmental pancreatitis).
Fig. 3
Patient grouping scheme for A Pancreas, B Liver, C Spleen diagnoses
Statistical analysisMeans and standardized deviations or medians and interquartile ranges (IQR) were used to summarize continuous data. Counts and percentages were used for categorical data. The Kruskal–Wallis test was used to compare T1 relaxation time estimates between subgroups with Dunn’s test used for pairwise comparisons. Pearson correlations were calculated between predictor and outcome variables and their strength of correlation was classified as follows: 0–0.19, very weak; 0.2–0.39, weak; 0.40–0.59, moderate; 0.60–0.79, strong; and 0.80–1.0, very strong [17]. A p value < 0.05 was considered to be statistically significant. Statistical analyses were performed using MedCalc Statistical Software version 22.009 (MedCalc Software Ltd., Ostend, Belgium) and GraphPad Prism software (version 9.5.0 for Windows).
Comments (0)