
Remember me
Chronic obstructive pulmonary disease (COPD) and asthma are the most common chronic inflammatory airway diseases worldwide [1, 2]. According to data from the World Health Organization, approximately 600 million patients worldwide have COPD. COPD is the third leading cause of death worldwide and its incidence is increasing every year. COPD poses a huge global health and macroeconomic burden [3]. Asthma is a common chronic disease which affect as many as 262 million people worldwide [4]. Globally, asthma is ranked 24th among the leading causes of years lived with disability and 34th among the leading causes of burden of disease, as measured by disability adjusted life years. Asthma continues to be a major source of global economic burden in terms of both direct and indirect costs [4]. COPD and asthma are major public health problems that can seriously harm human health. The pathophysiological mechanisms of the two conditions differ; however, their clinical manifestations are similar. At present, diagnosis is mainly based on clinical symptoms and pulmonary function examinations [1, 2]. Pulmonary function examination is time-consuming and is affected by patient status, cooperation, and multiple drugs; therefore, its accuracy and timeliness are limited. According to the effective control of the treatment level can be divided into: mild asthma, moderate asthma, severe asthma, refractory asthma. COPD can be divided into stable stage and acute exacerbation (AE) stage according to clinical course. In clinical practice, the clinical manifestations of severe asthma patients are complicated and lack typical asthma characteristics, which is easy to be confused with COPD. In addition, the clinical symptoms of elderly patients with asthma are atypical and difficult to distinguish from those with COPD. These factors affect the treatment and prognosis of the disease. Therefore, it is important to develop a rapidfast, accurate, convenient, and simple differential diagnostic method.
Volatile organic components (VOCs) are carbon-containing compounds that are volatile enough to be detected in the gas phase at room temperature. The US Environmental Protection Agency set a vapor pressure lower than 0.1 mmHg as the VOC criterion [5]. Exhaled organic compounds consist mainly of exogenous volatiles (generated by external sources and inhaled via breath) and endogenous volatiles (from various biochemical processes) [6]. VOCs come not only from the upper and lower airways, but also from the capillary beds near the alveoli. Their concentration in exhaled gas is affected by blood gas coefficient, cardiac output and alveolar fractional volume [7]. Therefore, the VOCs concentration produced in different physiological states will be different. For example, the concentration of isoprene increases significantly during exercise [8]. VOCs detection has shown good application value for the diagnosis of lung cancer [9], esophageal cancer [10], COPD [11], tuberculosis [12], COVID-19 [13], cognitive dysfunction [14], and other diseases [15]. Until now, there have been few studies on the differentiation of COPD and asthma by VOCs, and whether they can be distinguished is controversial [16–19]. In our study, we aimed to identify the accuracy of breath biomarkers for the discrimination of COPD and asthma through breathomics testing, and to explore the VOCs associated with COPD and asthma.
2.1. Participants recruitmentIn this multi-center cross-sectional study, we enrolled participants from 20 October 2022 to 20 May 2023, in four independent hospitals: Hebei General Hospital(Hospital A), Shijiazhuang People's Hospital(Hospital B), The Second Hospital of Hebei Medical University(Hospital C), and The First Hospital of Hebei Medical University(Hospital D). Enrolled participants were included in the COPD and asthma groups. All participants signed an informed consent form for the study approved by the Ethics Committee of the Second Hospital of Hebei Medical University. The inclusion criteria were as follows: (1) age > 18 years, (2) willingness to join and sign the informed consent form, (3) diagnosis of COPD according to the Guidelines for the Diagnosis and Management of Chronic Obstructive Pulmonary Disease (revised version 2021) [20], and (4) diagnosis of asthma according to the Guidelines for Bronchial Asthma Prevention and Management (2020 edition) [21]. The exclusion criteria were as follows: (1) patients with serious comorbidities (chronic renal failure, hepatic disease, etc), (2) patients diagnosed with COPD combined with asthma, (3) pregnant or preparing for pregnancy or breastfeeding, (4) signs of active infection, (5) patients with AE of COPD, and (6) history of cancer. All clinical data were extracted from medical records or telephone calls by two individual researchers.
2.2. Exhaled breath collectionAll breath samples were collected based on a standard protocol to minimize the possible effects of daily diet, smoking, alcohol consumption, medication, and environment on exhaled gas VOC. First, all participants were required to prepare for sampling in advance under the following conditions: (1) stop any inhalation medication and oral corticosteroids, antihistamines, and leukotriene receptor antagonists for 24 h; and (2) no smoking, alcohol, food and oral medication within an hour before sampling. Second, the participants were required to clean their mouths with purified water immediately before sampling. Third, all samples in each center were collected from the same site to minimize the effects of environmental factors. Finally, deep inhalation, no breath hold and exhalation training was executed for each participant to homogenize the collection of gases contained in a complete deep breath. With deep nasal inhalation, participants completely exhaled their breath into a 1.2 L volume sampling bag made of polyether-ether-ketone (PEEK) via a disposable gas nipple. The ambient gas was collected at the same time as exhaled gas sampling.
In this study, all collected samples were stored and transformed at room temperature and keep away from light. All samples were detected in the high-pressure photon ionization time-of-flight mass spectrometry (HPPI-TOF-MS) platform in The Second Hospital of Hebei Medical University within 24 h after sampling. Our previous studies have shown that the PEEK breath bags had a limited impact with relative differences <20% on VOCs in the collected breath samples in 24 h [13]. Ambient air was collected using negative air pressure through an automatic suction bag, which is used to make sure the environment was not polluted.
2.3. VOCs detection and model constructionVOCs in breath samples were detected using the HPPI-TOFMS platform as described in our previous studies [9, 10, 13, 22]. As shown in figure 1, the samples collected from hospitals A and B were assigned to the discovery dataset, and 20% of them were randomly split into interval validation datasets. The samples collected from Hospitals C and D were used as independent test datasets. The discovery and internal validation sets were used for potential VOC biomarker selection and diagnostic model construction, and a blinded test set was used for the model evaluation. To select valuable breathomic features and avoid model overfitting, a combined feature selection method was executed for breathomic features. First, breathomic features with no significant differences (p > 0.05) between the COPD and asthma groups were excluded. VOC ions with low intensity but highly correlated with other selected VOC ions (correlation coefficient > 0.9) among all the discovery samples were excluded. Finally, a random forest (RF) model was constructed on the discovery dataset, and the ten most important VOC ions were selected based on the feature coefficient in the RF model.
Figure 1. Flowcharts of participants' recruitment, model construction, and evaluation.
Download figure:
Standard image High-resolution imageIn this study, we constructed COPD and asthma discrimination models ( ) using six popular machine learning (ML) methods, RF, logistic regression (LR), eXtreme gradient boosting (XGB), K-nearest neighbor (KNN), decision tree (DT), and the soft voting ensemble algorithm of RF, XGB, and LR, in the discovery dataset. To evaluate the performance of the VOC-based
  , the model detection results were evaluated and compared with the clinically confirmed diagnosis results in the independent test set.
In this study, descriptive statistics are described as frequencies (percentages) for categorical variables and medians (minimum to maximum) for continuous variables. The Mann–Whitney U test for continuous variables and the chi-square test for categorical variables were used to compare the two groups. Analysis of variance was used to analyze variance among the three groups. Sensitivity (SEN), specificity (SPE), and accuracy (ACC) were calculated to evaluate the performance of  . A receiver operating characteristic (ROC) curve was plotted, and the area under the ROC curve area under the curve (AUC) was calculated to assess the overall performance of the
  . The 95% confidence interval (95%CI) was also calculated. All statistical analyses were performed using SAS version 9.4 (SAS Institute Inc., Cary, NC, USA) or the Origin software (version 2018). Statistical p-value < 0.05. All tests were two tailed. The power (1−β) and significant level (α) in the statistical analysis of this study was set as 0.8 and 0.05, respectively. β and α is the probability of making a Class II error and a Class I error.
We recruited 162 participants from four medical centers, of which 89 had COPD and 73 had asthma. The basic demographic characteristics of the study participants are presented in table 1. There were no significant differences in body mass index (BMI), comorbidities, or medication status between the COPD and asthma groups. However, age, sex, and smoking status, which are also general high-risk factors for COPD, were significantly different between the two groups.
Table 1. The baseline characteristics of enrolled participants. The bold p-values represent there are significant differences.
CharacteristicsAll (n = 162)COPD (n = 89)Asthma (n = 73) p-valuesAgeMedian (Range)60.0 (17.0, 86.0)66.0 (46.0, 86.0)44.0 (17.0, 80.0) 1.9 × 10⁻¹⁵ Gender (%)Male54 (33.3)14 (15.7)40 (54.8) 3.8 × 10⁻⁷ Female108 (66.7)75 (84.3)33 (45.2)BMIMedian (Range)24.5 (14.5, 38.8)24.5 (14.5, 33.2)24.2 (17.6, 38.8)0.418Smoking (%)Non-smoker82 (50.6)20 (22.5)62 (84.9) 2.0 × 10⁻¹⁴ Smoker33 (20.4)30 (33.7)3 (4.1)Ex-smoker47 (29.0)39 (43.8)8 (11.0)Comorbiditiesa(%)With92 (56.8)45 (50.6)47 (64.4)0.108Without70 (43.2)44 (49.4)26 (35.6)MedicationsbWith53 (32.7)34 (38.2)19 (26.0)0.140Without109 (67.3)55 (61.8)54 (74.0)a Comorbidities included hypertension, hyperlipidemia, coronary heart disease, and diabetes. b Medications for asthma and COPD were both the combinations of inhaled corticosteroid (ICS), and long-acting β2-agonist (LABA) or long-acting muscarinic antagonist (LAMA).
3.2. Diagnostic accuracy of the breathomics modelIn this study, the ten most important VOCs were selected for  construction using the combined feature selection method. Six
  were constructed using six popular ML methods. As illustrated in table 2, all five ML methods achieved good performance, with an AUC > 0.93, except for DT. Overall, the LR based
  achieved the best performance with the highest SEN, SPE, and ACC of 83.3%, 100.0%, and 91.7%, respectively, in the internal validation dataset. The corresponding AUC was 0.944, second only to that of the KNN method. Thus, the LR based
  was employed and analyzed in further studies.
Table 2. Performance comparison of six ML algorithms for COPD and asthma discrimination in the internal validation set. The bold values represent the best performance metrics.
ModelsSEN (%)SPE (%)ACC (%)AUCRF83.3 (62.2, 100.0)91.7 (76.0, 100.0)87.5 (74.3, 100.0)0.938 (0.841, 1.000)LR 83.3 (62.2, 100.0) 100.0 (100.0, 100.0) 91.7 (80.6, 100.0) 0.944 (0.853, 1.000) XGB75.0 (50.5, 99.5)83.3 (62.2, 100.0)79.2 (62.9, 95.4)0.938 (0.841, 1.000)KNN75.0 (50.5, 99.5)100.0 (100.0, 100.0)87.5 (74.3, 100.0)0.951 (0.865, 1.000)DT66.7 (40.0, 93.3)75.0 (50.5, 99.5)70.8 (52.6, 89.0)0.708 (0.526, 0.890)Ensemble83.3 (62.2, 100.0)83.3 (62.2, 100.0)83.3 (68.4, 98.2)0.944 (0.853, 1.000)As shown in figure 2, compared to the performance on the internal validation dataset, the LR based  still achieved good performance with an AUC of 0.843 on the independent test dataset. The corresponding SEN and SPE was 75.9%(95% CI: 60.3%, 91.4%), and 87.5%(95% CI: 71.3%, 100.0%). We also analyzed the model performance on two parts of the independent test dataset from hospitals C and D separately. As illustrated in table 3, there is a small SEN gap, but a large SPE gap between the two test datasets. This was considered because there were only four control cases in the Test 2 dataset. Overall, the performance of
  was consistent and good for the two test datasets.
Figure 2. The ROCs of the constructed  on internal validation dataset, and overall and separated independent test datasets from hospitals C and D.
Download figure:
Standard image High-resolution imageTable 3. Performance comparison of LR based  in independent test datasets.
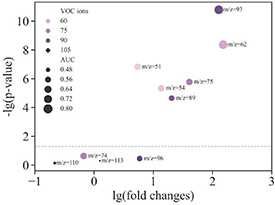
We further analyzed the fold changes of the top ten VOCs identified by  between COPD and asthma, and evaluated the individual discrimination power of each VOC marker. In the bubble chart in figure 3, 6/10 (60%) VOC ions showed significant differences between the COPD and asthma groups in the whole dataset, although all ten VOC ions were significantly different in the discovery dataset. In the bubble chart, the bubble size represents the individual discrimination power of the corresponding VOC ions. The highest AUC for a single VOC (m/z = 93) was 0.854 and the lowest for a single VOC ion (m/z = 113) was 0.422. The AUCs of the other single VOC ions for COPD and asthma discrimination were between them (figure 3).
Figure 3. The fold changes and individual discrimination power of the top ten VOCs identified by  .
.
Download figure:
Standard image High-resolution imageWe also analyzed the relative concentrations of the top 10 VOCs in the COPD and asthma groups, which were positively correlated with the peak area of VOC ions detected by HPPI-TOF-MS. As shown in figure 4, Six VOCs (m/z = 51, 93, 62, 89, 54, and 75) were significantly higher in the COPD group than in the asthma group (p < 0.05). No significant differences were observed between the two groups for the other four VOCs (m/z = 96, 113, 110, and 74). Based on the m/z, peak area, correlation with other ions, and the human breathomics database [23], we can infer the possible compounds of the 10 VOC ions. As illustrated in table 4, the VOC ions with m/z values of 96, 113, 62, 110, 89, 54, 74, and 75 were furfural, creatinine, dimethyl sulfide, resorcinol, methyl propionate, butadiene, hydroxyacetone, and glycine, respectively. The VOC ion with an m/z value of 51 is the aryl ion of aromatic compounds. The VOC ion with an m/z of 93 was 3-mepy or 2-picoline, which were isomers.
Figure 4. The relative concentration of the top ten VOCs identified by  between COPD and asthma groups.
Download figure:
Standard image High-resolution imageTable 4. The ten potential VOC markers associated with COPD and asthma discrimination.
m/z Potential VOCsCAS numberMolecular weightMolecular formula96Furfural98-01-196.084C5H4O251Aryl ion//C4H3+933-mepy/2-picoline108-99-6/109-06-893.127C6H7N113Creatinine60-27-5113.118C4H7N3O62Dimethyl sulfide75-18-362.134C2H6S110Resorcinol108-46-3110.11C6H6O289Methyl propionate554-12-188.105C4H8O2 (+H)54Butadiene106-99-054.090C4H674Hydroxyacetone116-09-674.078C3H6O275Glycine56-40-675.067C2H5NO23.4. VOCs related to COPD and asthmaTo further identify potential breath biomarkers related to COPD and asthma, the relative concentrations of VOCs in the different subgroups of COPD and asthma were analyzed individually. In this study, we identified other VOC ions for COPD participants that are related to the number of AE, comorbidities (such as cardiovascular and cerebrovascular diseases and diabetes), chest imaging (such as emphysema and bronchiectasis), and different severity stages and symptoms. For asthma, we analyzed the VOC ions related to whether the participant had received inhaled corticosteroids (ICS) treatment, with comorbidities (such as allergic rhinitis), and with different eosinophil granulocyte count groups (EOS ⩾ 300 ul−1 and EOS < 300 ul−1). As illustrated in supplementary table 1, the VOC ion with an m/z of 104 was related to the number of AEs within one year in stable COPD, which was not identified as a distinguishing marker for COPD and asthma. There were 27 VOC associated with comorbidities in the COPD participants. Two VOC ions (m/z = 96 and 110) were selected to distinguish COPD and asthma. There were 12 VOC ions with significant differences between participants with COPD with and without pulmonary imaging changes (emphysema and bronchiectasis); VOC ions with an m/z of 51 were also used to distinguish between COPD and asthma. Twelve VOCs were related to the different severity stages (slight, median, and serious) of patients with COPD. However, they have not yet been used to distinguish between COPD and asthma. Interestingly, 5/17 VOC ions were significantly different between COPD patients with different symptoms (cough, shortness of breath, or both) and were used as distinguishing markers for COPD and asthma. For asthma participants, seven VOC ions were significantly different between asthma participants with and without ICS treatment. Two VOC ions with m/z values of 86 and 140 were significantly different between patients with asthma with and without comorbidities (allergic rhinitis). Three VOC ions with m/z values of 62, 82, and 123 were significantly different between asthma patients with different eosinophil granulocyte counts (EOS ⩾ 300 ul−1 and EOS < 300 ul−1). Among the 12 VOC ions, only the VOC ion with m/z of 62 was used to distinguish between COPD and asthma.
In this study, for the first time, we used HPPI-TOF-MS breathomics data to explore their value in the differential diagnosis of COPD and asthma. In our model, we identified ten key VOC markers that distinguished COPD from asthma. The VOC panel-based LR model achieved a good performance in distinguishing between COPD and asthma. The joint panel of these ten VOCs achieved an area under the curve (AUC) of 0.843, sensitivity of 75.9%, specificity of 87.5%, and accuracy of 80.0% in COPD and asthma discrimination. This implies that the identification model has good accuracy. This also suggests that the proposed breathomics method using online HPPI-TOF-MS is a potentially feasible diagnostic tool in clinical practice. Previous studies by Fens et al confirmed that breathprints of the electronic nose can distinguish COPD from asthma (accuracy, 96%) [17], which is consistent with our findings. In contrast, Schivo et al used a gas chromatograph/differential mobility spectrometer technique to compare the VOC profiles of 13 patients with asthma, 5 patients with COPD, and 13 healthy controls and found that the VOC profiles could not distinguish between COPD and asthma [16]. This was most likely related to the limited sample size.
There are large differences between COPD and asthma in the characteristics of chronic airway inflammation [24, 25]. Airway inflammation in COPD is dominated by neutrophils, CD8+T lymphocytes, and macrophages, and various inflammatory cells are present in the lung parenchyma [26]. In contrast, patients with asthma have a predominance of eosinophils, CD4+T lymphocytes, and mast cells, and activated CD4+T lymphocytes exacerbate chronic inflammation [27]. In addition, the inflammatory mediators in these two conditions are different [28–31]. Based on this consideration, they may produce different breath fingerprints [17]. In our study, ten VOC ion compounds were identified that could be used to distinguish COPD from asthma were identified. These included furfural, creatinine, dimethyl sulfide, resorcinol, methyl propionate, butadiene, hydroxyacetone, glycine, aryl ions of aromatic compounds, and 3-mepy or 2-picoline. Unlike previous studies, we did not find hexanal [32–35], nonanal [32], decane [34, 36], or 2-pentanone [37], which are considered potential biomarkers of COPD or are significantly associated with COPD. The differences in the results of these studies are considered to be related to the different sampling techniques, control groups, and data processing methods. The biological sources and metabolic mechanisms of most VOCs have not been fully elucidated. It is generally accepted that [38] the source of aldehydes in the human body is related to alcohol metabolism, the reduction of hydrogen peroxide by cytochrome P450, cigarette smoking, detoxification of cytochrome P450, and food intake. Gupta et al found that furfural caused lung parenchymal injury and alveolar type II cell regeneration and proliferation [39]. The main pathological manifestations of COPD are structural alveolar fracture injuries, such as loss of elastin crosslinking, microscopic fracture of elastic fibers, and macroscopic fracture of the alveolar wall [40, 41]. In our study, furfural was used as a biomarker to discriminate between COPD and asthma. Furfural may be associated with COPD-related lung injury and regeneration of alveolar type II cells. Butadiene is a known carcinogen [42]. It is widely found in tobacco smoke, gasoline vapor, and ambient air. Metabolically active lung cells are potential targets for toxicity and carcinogenicity induced by butadiene metabolites [43]. Patients with COPD are at a higher risk of developing lung cancer [44]. Our study found that butadiene levels in exhaled breath were significantly elevated in patients with COPD, which may be a potential mechanism of lung carcinogenesis. The mechanisms of bronchial lumen obstruction in patients with COPD include small airway remodeling and increased mucus secretion. Previous studies have confirmed [45] the positive effect of aromatics on mucus clearance in chronic airway obstruction, which may explain why we observed a significant increase in aryl ions in patients with COPD.
In addition, we performed separate subgroup analyses for COPD and asthma and found that different VOC combinations were associated with corresponding subgroup categories. We found that 2-methyl-1-butanethiol/pentanethiol (m/z = 104) was associated with the number of AEs in stable COPD; however, the underlying mechanism remains unclear. In contrast, Gaugg et al [46] reported that the class of nitroaromatic compounds increased in patients with frequent AEs of stable COPD, but the mechanism of this increase has not been elucidated. In patients with asthma, eosinophil counts were associated with dimethyl sulfide(m/z = 62), 2-methylfuran(m/z = 82), and 4-hydroxybenzaldehyde(m/z = 123). Schleich et al [47] found that hexane and 2-hexanone can accurately identify eosinophilic asthma. Another multicenter cross-sectional study [48] found that the electronic nose could identify inflammatory phenotypes (eosinophilic and neutrophilic types) of bronchial asthma. We also found that pentanal (m/z = 86) and furfuryl acetate (m/z = 140) were associated with the presence or absence of comorbid allergic rhinitis in patients with asthma. Pentanal is flammable and irritating. It irritates the mucous membranes of the upper respiratory tract, and is harmful to the environment. Dragonieri et al found that patients with allergic rhinitis alone and those with bronchial asthma had different respiratory fingerprints, which may be related to their different pathophysiologies and inflammatory processes [49].
Although current research cannot accurately classify or diagnose a certain disease using a single VOC, the use of VOC combinations can achieve disease classification, diagnosis, and differential diagnosis. This provides hope for further exploration of VOC production mechanisms, metabolic pathways, disease-related basic research, and the development of precision medicine in the future. This provides optimism for advancing investigations into the mechanisms underlying VOC production, metabolic pathways, disease-related fundamental research, and future progression of precision medicine.
Our study was designed at a multi-center to avoid non-pathogenic biases related to diet, environment, and lifestyle. This is the first study to use an HPPI-TOF-MS respiratory data assay for the differential diagnosis of COPD and asthma. Compared with other VOC detection methods, HPPI-TOF-MS offers the advantages of no sample pre-processing or enrichment, high-resolution capability for more accurate identification and quantification of VOCs, and a short sample analysis time of only 60 s [50].
This study has some limitations. First, the exhalation flow in breath sample collected is not controlled in this study, which may affect the exhaled VOC concentrations. The exhalation flows of COPD and asthma patients could be a bias in this breath analysis study. As illustrated in the ERS technical standard for exhaled biomarkers in lung diseases published in 2017 [51], four exhalation flow dependency VOCs has been reported, which include acetone [52], ethanol [53], isoprene [54, 55] and pentane [54]. Although these four VOCs are not involved in discrimination of COPD and asthma, that does not mean that the found 10 VOC molecules that we found are not affected. Thus, we think the bias from the exhalation flow is still exist in this study. Secondly, the sex, age, and smoking status of the patients with COPD and asthma were significantly different. As Silvano Dragonier's study [56] reported, age and gender do not seem to affect the overall profile of exhaled volatile organic compounds measured by an e-nose. In Matthias Lechner's study [57], they demonstrated gender and age specific differences of isoprene levels in the exhaled air. Thus, age and gender introduced influences to exhaled breath would be limited. Considering that these three clinical features were high-risk factors for COPD or asthma, we further evaluated the distinguishing power of the identified VOC markers according to sex (male vs. female), age (>50 vs. ⩽50 years), and current smoking status (smoking vs. nonsmoking) in our independent test dataset. As illustrated in supplementary figure 1, the panel of 10 VOC marker-based LR models achieved slightly above-average performance, with AUC of 0.714, 0.701, and 0.656, respectively. Therefore, the confounding effects were considered limited. However, a more rigorous study setting is needed in the future, which would make the results more convincing. Thirdly, the different medications taken by asthma and COPD would be a slight confounding factors to this study, although we had kept a 24 h medication control
Comments (0)